Global Real-Time Streaming Analytics Market Report: Trends, Growth and Forecast (2026-2032)
By Component (Software and Platforms, Professional Services (Consulting, Deployment and Integration, Support and Maintenance), Managed Services), By Deployment Mode (Cloud, On-Premises, Hybrid), By Enterprise Size (Large Enterprises, Small and Medium Enterprises), By Application (Fraud Detection and Risk Management, Network Monitoring and Optimization, Predictive Maintenance, Operations Management and IT Observability, Sales, Marketing and Customer Experience Analytics, Supply Chain and Logistics Analytics, Location Intelligence, Others), By Industry Vertical (BFSI, IT and Telecommunications, Retail and E-commerce, Manufacturing, Healthcare and Life Sciences, Transportation and Logistics, Energy and Utilities, Government and Public Sector, Media and Entertainment, Others), By Region (North America, South America, Europe, Middle East and Africa, Asia Pacific) ... Read more
|
Major Players
|
Global Real-Time Streaming Analytics Market Statistics and Insights, 2026
- Market Size Statistics
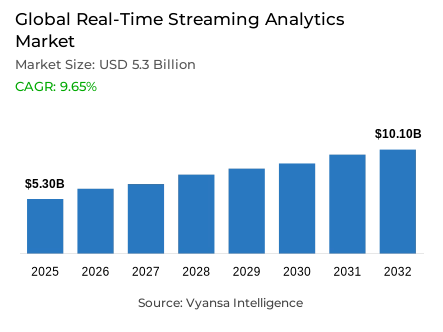
- Real-Time Streaming Analytics market size was valued at USD 5.3 billion in 2025 and is estimated at USD 5.99 billion in 2026.
- The market size is expected to grow to USD 10.1 billion by 2032.
- Market to register a CAGR of around 9.65% during 2026-32.
- Component Shares
- Software and platforms grabbed market share of 60%.
- Competition
- Global real-time streaming analytics market is currently being catered to by more than 20 companies.
- Top 5 companies acquired around 55% of the market share.
- Databricks Inc., Snowflake Inc., SAS Institute Inc., Microsoft Corporation, Amazon Web Services Inc. etc., are few of the top companies.
- Industry Vertical
- Bfsi grabbed 30% of the market.
- Region
- North America leads with a 40% share of the global market.
Global Real-Time Streaming Analytics Market Outlook
The real-time streaming analytics market covers software platforms and services that ingest, process, analyze, and act on continuous enterprise data streams. It serves BFSI, telecom, manufacturing, retail, healthcare, logistics, energy, government, and media users that require low-latency analytics, event stream analytics, real-time business intelligence, and operational alerts. The market was valued at USD 5.30 billion in 2025, USD 5.99 billion in 2026, and is projected to reach USD 10.10 billion by 2032, growing at a CAGR of 9.65% from 2026 to 2032, supporting rapid decisioning.
Cloud-native stream processing, IoT telemetry, AI-powered streaming analytics solutions, and serverless data streaming are strengthening the global real-time streaming analytics industry. According to Microsoft, Azure Event Hubs can ingest millions of events per second with low latency, supporting Apache Kafka-compatible workloads without cluster management overhead. This capability expands adoption for high-velocity data analytics across enterprises that need continuous intelligence, real-time pipelines, and anomaly detection across distributed operating environments under variable workloads with resilient throughput planning.
Enterprise demand is moving from delayed reporting toward operational decisioning, making the real-time streaming analytics market a direct enabler of fraud detection, predictive maintenance, network monitoring, and supply chain visibility. Google Cloud states that Dataflow supports real-time stream analytics, real-time ML, Apache Beam-based processing, autoscaling, and petabyte-scale workloads. These capabilities improve procurement confidence for scalable data ingestion, streaming ETL, and event-driven architecture across regulated and asset-intensive sectors with complex operating footprints and multicloud deployment priorities.
Adoption momentum in 2026 is shaped by platform consolidation, cloud migration, and demand for low-latency data analytics in enterprise workflows. The global real-time streaming analytics industry is benefiting as suppliers integrate real-time data processing with AI models, data lakehouses, event hubs, and real-time dashboards. Microsoft Fabric Real-Time Intelligence positions streaming data as an end-to-end event-driven solution, strengthening vendor competition and improving buyer access to unified real-time intelligence platforms within the real-time streaming analytics market strategically.

Global Real-Time Streaming Analytics Market Growth Driver
Latency-Critical Operations are Accelerating Platform Adoption
Immediate decisioning requirements are pushing the real-time streaming analytics market deeper into enterprise operating models. Banks need real-time fraud detection and risk monitoring, telecom operators need network monitoring analytics, manufacturers need sensor data analytics, and retailers need customer behavior analytics that reacts while events are still actionable. This demand supports procurement of cloud-based real-time streaming analytics platforms, managed streaming analytics services, and event processing software that can reduce operational lag across distributed operating centers immediately.
Amazon Web Services states that Amazon Kinesis collects, processes, and analyzes real-time video and data streams, supporting log analytics, event analytics, and IoT analytics. That product positioning directly strengthens the global real-time streaming analytics industry by converting high-frequency events into usable alerts, operational signals, and automated responses. It also improves demand capture for suppliers offering real-time data pipeline and streaming ETL solutions. This supports faster platform evaluation, stronger budget justification, and higher managed-service attach rates.
Global Real-Time Streaming Analytics Market Challenge
Governance Pressure is Raising Deployment Barriers
Streaming data complexity, interoperability pressure, and real-time data governance requirements are slowing broader enterprise deployment. Buyers must connect legacy systems, cloud services, edge devices, and application logs while maintaining data quality, privacy controls, latency management, and auditability. These conditions increase implementation cost and lengthen procurement cycles in the real-time streaming analytics market, especially for regulated industries handling transaction streams, connected-device data, and cross-border operational records across multicloud, hybrid, and edge streaming environments during modernization.
The European Commission states that the Data Act applies from 12 September 2025 and requires connected devices to allow data sharing while enabling consumers to transfer data and switch cloud providers. This regulatory shift supports data access, but it also raises compliance workload for platform operators. The global real-time streaming analytics industry must therefore strengthen secure event streaming, data portability, contract readiness, and regulated data stream processing. Procurement teams must also validate portability and governance controls.
Unlock Market Intelligence
Explore the market potential with our data-driven report
Global Real-Time Streaming Analytics Market Trend
Open Frameworks are Rewriting Architecture Priorities
Apache Kafka and Apache Flink-based analytics are reshaping enterprise architecture as buyers seek portable, scalable, and fault-tolerant streaming systems. Platform teams are favoring distributed stream processing, exactly-once processing, and continuous query processing to support real-time model inference, operational AI data streams, and event-driven enterprise systems. This trend strengthens the real-time streaming analytics market by making cloud-native and hybrid streaming deployments technically easier to justify while reducing dependence on rigid batch analytics architectures in mission-critical environments faster.
The Apache Software Foundation released Apache Flink 2.0.0 in March 2025, describing it as a new era of real-time data processing focused on more practical, efficient, and widely applicable real-time computing. This update reinforces the global real-time streaming analytics industry by improving developer confidence in open stream processing engines, accelerating platform modernization, and supporting unified batch and streaming analytics strategies. It also sharpens vendor differentiation around streaming infrastructure scalability and resilient data availability planning.
Global Real-Time Streaming Analytics Market Opportunity
Subsecond Analytics is Unlocking Premium Workloads
Subsecond analytics creates a higher-value opportunity for vendors serving payment authorization, fraud scoring, live personalization, industrial automation analytics, and real-time observability platforms. Buyers increasingly require low-latency analytics for enterprise decision-making rather than delayed dashboard updates. This expands the real-time streaming analytics market toward mission-critical workloads where responsiveness, resilience, and streaming data quality directly affect operating performance and competitive positioning across high-volume digital channels, connected assets, and AI-enabled service operations and regulated service workflows at scale.
Databricks announced in March 2026 that Real-Time Mode for Apache Spark Structured Streaming became generally available, bringing millisecond performance and sub-100ms processing speeds to familiar Spark APIs. This milestone supports the global real-time streaming analytics industry by reducing the need for specialized engines, improving migration economics, and helping suppliers capture demand for AI and streaming data convergence across enterprise data platforms. It strengthens pricing power where latency becomes procurement criteria within competitive enterprise modernization programs.
Global Real-Time Streaming Analytics Market Regional Analysis

By Region
- North America
- South America
- Europe
- Middle East and Africa
- Asia Pacific
North America holds 40% share because the region combines hyperscale cloud infrastructure, mature enterprise data architecture, strong BFSI and technology demand, and early adoption of event-driven analytics. The real-time streaming analytics market benefits from this concentration as buyers have wide access to cloud streaming analytics services, enterprise streaming analytics platforms, and specialized vendors supporting real-time compliance monitoring, IoT streaming analytics, and operational analytics modernization across public cloud and private enterprise environments alike.
AWS opened the Mexico Central Region in January 2025 with three Availability Zones, adding its first infrastructure region in Mexico and expanding low-latency cloud access across North America. This infrastructure milestone supports industry adoption by improving regional deployment options, reducing latency for streaming workloads, and strengthening supplier positioning for enterprise automation analytics across connected economies. It also improves localization choices for workloads requiring regional resilience and data proximity while improving vendor access to latency-sensitive enterprise accounts locally faster.
Unlock Market Intelligence
Explore the market potential with our data-driven report
Global Real-Time Streaming Analytics Market Segmentation Analysis
By Component
- Software and Platforms
- Professional Services
- Consulting
- Deployment and Integration
- Support and Maintenance
- Managed Services
Software and platforms hold 60% share under component segmentation because buyers prioritize reusable processing engines, real-time dashboards, streaming data integration tools, and event streaming platforms before layering consulting or managed support. This leadership reflects the real-time streaming analytics market need for scalable data ingestion, stream monitoring tools, and embedded analytics capabilities that can support multiple applications across BFSI, telecom, manufacturing, logistics, and digital commerce environments under predictable lifecycle, integration, and enterprise compliance requirements.
Azure Stream Analytics is described by Microsoft as a fully managed real-time analytics service that analyzes and processes fast-moving streams of data for insights, reports, alerts, and actions. This platform-led model strengthens industry adoption by making streaming analytics software easier to deploy, standardize, and scale across enterprise workloads without requiring every buyer to build custom infrastructure. It also supports supplier bundling around integration, monitoring, governance, and managed lifecycle services across hybrid and cloud-native secure enterprise procurement programs.

By Industry Vertical
- BFSI
- IT and Telecommunications
- Retail and E-commerce
- Manufacturing
- Healthcare and Life Sciences
- Transportation and Logistics
- Energy and Utilities
- Government and Public Sector
- Media and Entertainment
- Others
BFSI holds 30% share under industry vertical segmentation because transaction monitoring, real-time fraud detection, risk scoring, compliance surveillance, and customer-event analytics require immediate analysis of high-frequency data. The real-time streaming analytics market benefits from BFSI procurement intensity because banks, payment processors, insurers, and capital-market firms use low-latency analytics to reduce exposure, improve decision quality, and maintain stronger control over digital transaction environments across always-on digital banking and payment operations networks.
Databricks reported in 2025 that a mission-critical payments authorization pipeline using Real-Time Mode achieved p99 end-to-end latency of 15 milliseconds in early testing. This operational evidence supports BFSI adoption in the global real-time streaming analytics industry by showing how real-time machine learning analytics can strengthen fraud response, transaction approval workflows, and streaming anomaly detection in financial infrastructure. It also raises expectations for platform resilience, explainability, and audit-ready performance controls, supporting premium platform selection and stronger managed-service requirements for regulated buyers.
Market Players in Global Real-Time Streaming Analytics Market
These market players maintain a significant presence in the Global real-time streaming analytics market and contribute to its ongoing evolution.
- Databricks Inc.
- Snowflake Inc.
- SAS Institute Inc.
- Microsoft Corporation
- Amazon Web Services Inc.
- Google LLC
- IBM Corporation (Confluent)
- Oracle Corporation
- Cloud Software Group Holdings Inc. (TIBCO)
- SAP SE
- Alibaba Cloud (Singapore) Private Limited
- Cloudera Inc.
- Cisco Systems Inc. (Splunk)
- QlikTech International AB (Qlik)
- Cumulocity GmbH (Apama)
Market News & Updates
- IBM Corporation (Confluent), 2025:
Confluent launched Confluent Intelligence in October 2025 as a fully managed service for real-time, context-rich AI systems using Apache Kafka and Apache Flink. The platform continuously streams and processes historic and real-time data and includes Real-Time Context Engine, Streaming Agents, and built-in ML functions. The update expands Confluent’s real-time analytics and event-processing capability for AI-driven enterprise workloads.
- QlikTech International AB (Qlik), 2025:
Qlik added streaming ingestion and real-time transformations to Qlik Open Lakehouse in December 2025. The update enables high-volume events from Apache Kafka, Amazon Kinesis, and Amazon S3 to land in governed Apache Iceberg tables with on-the-fly transformations, data quality, lineage, and cataloging. The release strengthens Qlik’s real-time analytics platform for governed AI, ML, and operational analytics workloads.
Frequently Asked Questions
Related Report
- Market Segmentation
- Research Scope
- Research Methodology
- Definitions and Assumptions
- Executive Summary
- Global Real-Time Streaming Analytics Market Policies, Regulations, and Standards
- Global Real-Time Streaming Analytics Market Dynamics
- Growth Factors
- Challenges
- Trends
- Opportunities
- Global Real-Time Streaming Analytics Market Statistics, 2022-2032F
- Market Size & Growth Outlook
- By Revenues in USD Million
- Market Segmentation & Growth Outlook
- By Component
- Software and Platforms- Market Insights and Forecast 2022-2032, USD Million
- Professional Services- Market Insights and Forecast 2022-2032, USD Million
- Consulting- Market Insights and Forecast 2022-2032, USD Million
- Deployment and Integration- Market Insights and Forecast 2022-2032, USD Million
- Support and Maintenance- Market Insights and Forecast 2022-2032, USD Million
- Managed Services- Market Insights and Forecast 2022-2032, USD Million
- By Deployment Mode
- Cloud- Market Insights and Forecast 2022-2032, USD Million
- On-Premises- Market Insights and Forecast 2022-2032, USD Million
- Hybrid- Market Insights and Forecast 2022-2032, USD Million
- By Enterprise Size
- Large Enterprises- Market Insights and Forecast 2022-2032, USD Million
- Small and Medium Enterprises- Market Insights and Forecast 2022-2032, USD Million
- By Application
- Fraud Detection and Risk Management- Market Insights and Forecast 2022-2032, USD Million
- Network Monitoring and Optimization- Market Insights and Forecast 2022-2032, USD Million
- Predictive Maintenance- Market Insights and Forecast 2022-2032, USD Million
- Operations Management and IT Observability- Market Insights and Forecast 2022-2032, USD Million
- Sales, Marketing and Customer Experience Analytics- Market Insights and Forecast 2022-2032, USD Million
- Supply Chain and Logistics Analytics- Market Insights and Forecast 2022-2032, USD Million
- Location Intelligence- Market Insights and Forecast 2022-2032, USD Million
- Others- Market Insights and Forecast 2022-2032, USD Million
- By Industry Vertical
- BFSI- Market Insights and Forecast 2022-2032, USD Million
- IT and Telecommunications- Market Insights and Forecast 2022-2032, USD Million
- Retail and E-commerce- Market Insights and Forecast 2022-2032, USD Million
- Manufacturing- Market Insights and Forecast 2022-2032, USD Million
- Healthcare and Life Sciences- Market Insights and Forecast 2022-2032, USD Million
- Transportation and Logistics- Market Insights and Forecast 2022-2032, USD Million
- Energy and Utilities- Market Insights and Forecast 2022-2032, USD Million
- Government and Public Sector- Market Insights and Forecast 2022-2032, USD Million
- Media and Entertainment- Market Insights and Forecast 2022-2032, USD Million
- Others- Market Insights and Forecast 2022-2032, USD Million
- By Region
- North America
- South America
- Europe
- Middle East and Africa
- Asia Pacific
- By Competitors
- Competition Characteristics
- Market Share & Analysis
- By Component
- Market Size & Growth Outlook
- North America Real-Time Streaming Analytics Market Statistics, 2022-2032F
- Market Size & Growth Outlook
- By Revenues in USD Million
- Market Segmentation & Growth Outlook
- By Component- Market Insights and Forecast 2022-2032, USD Million
- By Deployment Mode- Market Insights and Forecast 2022-2032, USD Million
- By Enterprise Size- Market Insights and Forecast 2022-2032, USD Million
- By Application- Market Insights and Forecast 2022-2032, USD Million
- By Industry Vertical- Market Insights and Forecast 2022-2032, USD Million
- By Country
- The US
- Canada
- Mexico
- Rest of North America
- The US Real-Time Streaming Analytics Market Statistics, 2022-2032F
- Market Size & Growth Outlook
- By Revenues in USD Million
- Market Segmentation & Growth Outlook
- By Component- Market Insights and Forecast 2022-2032, USD Million
- By Deployment Mode- Market Insights and Forecast 2022-2032, USD Million
- By Enterprise Size- Market Insights and Forecast 2022-2032, USD Million
- By Application- Market Insights and Forecast 2022-2032, USD Million
- By Industry Vertical- Market Insights and Forecast 2022-2032, USD Million
- Market Size & Growth Outlook
- Canada Real-Time Streaming Analytics Market Statistics, 2022-2032F
- Market Size & Growth Outlook
- By Revenues in USD Million
- Market Segmentation & Growth Outlook
- By Component- Market Insights and Forecast 2022-2032, USD Million
- By Deployment Mode- Market Insights and Forecast 2022-2032, USD Million
- By Enterprise Size- Market Insights and Forecast 2022-2032, USD Million
- By Application- Market Insights and Forecast 2022-2032, USD Million
- By Industry Vertical- Market Insights and Forecast 2022-2032, USD Million
- Market Size & Growth Outlook
- Mexico Real-Time Streaming Analytics Market Statistics, 2022-2032F
- Market Size & Growth Outlook
- By Revenues in USD Million
- Market Segmentation & Growth Outlook
- By Component- Market Insights and Forecast 2022-2032, USD Million
- By Deployment Mode- Market Insights and Forecast 2022-2032, USD Million
- By Enterprise Size- Market Insights and Forecast 2022-2032, USD Million
- By Application- Market Insights and Forecast 2022-2032, USD Million
- By Industry Vertical- Market Insights and Forecast 2022-2032, USD Million
- Market Size & Growth Outlook
- Market Size & Growth Outlook
- South America Real-Time Streaming Analytics Market Statistics, 2022-2032F
- Market Size & Growth Outlook
- By Revenues in USD Million
- Market Segmentation & Growth Outlook
- By Component- Market Insights and Forecast 2022-2032, USD Million
- By Deployment Mode- Market Insights and Forecast 2022-2032, USD Million
- By Enterprise Size- Market Insights and Forecast 2022-2032, USD Million
- By Application- Market Insights and Forecast 2022-2032, USD Million
- By Industry Vertical- Market Insights and Forecast 2022-2032, USD Million
- By Country
- Brazil
- Argentina
- Chile
- Rest of South America
- Brazil Real-Time Streaming Analytics Market Statistics, 2022-2032F
- Market Size & Growth Outlook
- By Revenues in USD Million
- Market Segmentation & Growth Outlook
- By Component- Market Insights and Forecast 2022-2032, USD Million
- By Deployment Mode- Market Insights and Forecast 2022-2032, USD Million
- By Enterprise Size- Market Insights and Forecast 2022-2032, USD Million
- By Application- Market Insights and Forecast 2022-2032, USD Million
- By Industry Vertical- Market Insights and Forecast 2022-2032, USD Million
- Market Size & Growth Outlook
- Argentina Real-Time Streaming Analytics Market Statistics, 2022-2032F
- Market Size & Growth Outlook
- By Revenues in USD Million
- Market Segmentation & Growth Outlook
- By Component- Market Insights and Forecast 2022-2032, USD Million
- By Deployment Mode- Market Insights and Forecast 2022-2032, USD Million
- By Enterprise Size- Market Insights and Forecast 2022-2032, USD Million
- By Application- Market Insights and Forecast 2022-2032, USD Million
- By Industry Vertical- Market Insights and Forecast 2022-2032, USD Million
- Market Size & Growth Outlook
- Chile Real-Time Streaming Analytics Market Statistics, 2022-2032F
- Market Size & Growth Outlook
- By Revenues in USD Million
- Market Segmentation & Growth Outlook
- By Component- Market Insights and Forecast 2022-2032, USD Million
- By Deployment Mode- Market Insights and Forecast 2022-2032, USD Million
- By Enterprise Size- Market Insights and Forecast 2022-2032, USD Million
- By Application- Market Insights and Forecast 2022-2032, USD Million
- By Industry Vertical- Market Insights and Forecast 2022-2032, USD Million
- Market Size & Growth Outlook
- Market Size & Growth Outlook
- Europe Real-Time Streaming Analytics Market Statistics, 2022-2032F
- Market Size & Growth Outlook
- By Revenues in USD Million
- Market Segmentation & Growth Outlook
- By Component- Market Insights and Forecast 2022-2032, USD Million
- By Deployment Mode- Market Insights and Forecast 2022-2032, USD Million
- By Enterprise Size- Market Insights and Forecast 2022-2032, USD Million
- By Application- Market Insights and Forecast 2022-2032, USD Million
- By Industry Vertical- Market Insights and Forecast 2022-2032, USD Million
- By Country
- Germany
- France
- The UK
- Italy
- Spain
- Rest of Europe
- Germany Real-Time Streaming Analytics Market Statistics, 2022-2032F
- Market Size & Growth Outlook
- By Revenues in USD Million
- Market Segmentation & Growth Outlook
- By Component- Market Insights and Forecast 2022-2032, USD Million
- By Deployment Mode- Market Insights and Forecast 2022-2032, USD Million
- By Enterprise Size- Market Insights and Forecast 2022-2032, USD Million
- By Application- Market Insights and Forecast 2022-2032, USD Million
- By Industry Vertical- Market Insights and Forecast 2022-2032, USD Million
- Market Size & Growth Outlook
- France Real-Time Streaming Analytics Market Statistics, 2022-2032F
- Market Size & Growth Outlook
- By Revenues in USD Million
- Market Segmentation & Growth Outlook
- By Component- Market Insights and Forecast 2022-2032, USD Million
- By Deployment Mode- Market Insights and Forecast 2022-2032, USD Million
- By Enterprise Size- Market Insights and Forecast 2022-2032, USD Million
- By Application- Market Insights and Forecast 2022-2032, USD Million
- By Industry Vertical- Market Insights and Forecast 2022-2032, USD Million
- Market Size & Growth Outlook
- The UK Real-Time Streaming Analytics Market Statistics, 2022-2032F
- Market Size & Growth Outlook
- By Revenues in USD Million
- Market Segmentation & Growth Outlook
- By Component- Market Insights and Forecast 2022-2032, USD Million
- By Deployment Mode- Market Insights and Forecast 2022-2032, USD Million
- By Enterprise Size- Market Insights and Forecast 2022-2032, USD Million
- By Application- Market Insights and Forecast 2022-2032, USD Million
- By Industry Vertical- Market Insights and Forecast 2022-2032, USD Million
- Market Size & Growth Outlook
- Italy Real-Time Streaming Analytics Market Statistics, 2022-2032F
- Market Size & Growth Outlook
- By Revenues in USD Million
- Market Segmentation & Growth Outlook
- By Component- Market Insights and Forecast 2022-2032, USD Million
- By Deployment Mode- Market Insights and Forecast 2022-2032, USD Million
- By Enterprise Size- Market Insights and Forecast 2022-2032, USD Million
- By Application- Market Insights and Forecast 2022-2032, USD Million
- By Industry Vertical- Market Insights and Forecast 2022-2032, USD Million
- Market Size & Growth Outlook
- Spain Real-Time Streaming Analytics Market Statistics, 2022-2032F
- Market Size & Growth Outlook
- By Revenues in USD Million
- Market Segmentation & Growth Outlook
- By Component- Market Insights and Forecast 2022-2032, USD Million
- By Deployment Mode- Market Insights and Forecast 2022-2032, USD Million
- By Enterprise Size- Market Insights and Forecast 2022-2032, USD Million
- By Application- Market Insights and Forecast 2022-2032, USD Million
- By Industry Vertical- Market Insights and Forecast 2022-2032, USD Million
- Market Size & Growth Outlook
- Market Size & Growth Outlook
- Middle East and Africa Real-Time Streaming Analytics Market Statistics, 2022-2032F
- Market Size & Growth Outlook
- By Revenues in USD Million
- Market Segmentation & Growth Outlook
- By Component- Market Insights and Forecast 2022-2032, USD Million
- By Deployment Mode- Market Insights and Forecast 2022-2032, USD Million
- By Enterprise Size- Market Insights and Forecast 2022-2032, USD Million
- By Application- Market Insights and Forecast 2022-2032, USD Million
- By Industry Vertical- Market Insights and Forecast 2022-2032, USD Million
- By Country
- Saudi Arabia
- The UAE
- South Africa
- Rest of Middle East and Africa
- Saudi Arabia Real-Time Streaming Analytics Market Statistics, 2022-2032F
- Market Size & Growth Outlook
- By Revenues in USD Million
- Market Segmentation & Growth Outlook
- By Component- Market Insights and Forecast 2022-2032, USD Million
- By Deployment Mode- Market Insights and Forecast 2022-2032, USD Million
- By Enterprise Size- Market Insights and Forecast 2022-2032, USD Million
- By Application- Market Insights and Forecast 2022-2032, USD Million
- By Industry Vertical- Market Insights and Forecast 2022-2032, USD Million
- Market Size & Growth Outlook
- The UAE Real-Time Streaming Analytics Market Statistics, 2022-2032F
- Market Size & Growth Outlook
- By Revenues in USD Million
- Market Segmentation & Growth Outlook
- By Component- Market Insights and Forecast 2022-2032, USD Million
- By Deployment Mode- Market Insights and Forecast 2022-2032, USD Million
- By Enterprise Size- Market Insights and Forecast 2022-2032, USD Million
- By Application- Market Insights and Forecast 2022-2032, USD Million
- By Industry Vertical- Market Insights and Forecast 2022-2032, USD Million
- Market Size & Growth Outlook
- South Africa Real-Time Streaming Analytics Market Statistics, 2022-2032F
- Market Size & Growth Outlook
- By Revenues in USD Million
- Market Segmentation & Growth Outlook
- By Component- Market Insights and Forecast 2022-2032, USD Million
- By Deployment Mode- Market Insights and Forecast 2022-2032, USD Million
- By Enterprise Size- Market Insights and Forecast 2022-2032, USD Million
- By Application- Market Insights and Forecast 2022-2032, USD Million
- By Industry Vertical- Market Insights and Forecast 2022-2032, USD Million
- Market Size & Growth Outlook
- Market Size & Growth Outlook
- Asia Pacific Real-Time Streaming Analytics Market Statistics, 2022-2032F
- Market Size & Growth Outlook
- By Revenues in USD Million
- Market Segmentation & Growth Outlook
- By Component- Market Insights and Forecast 2022-2032, USD Million
- By Deployment Mode- Market Insights and Forecast 2022-2032, USD Million
- By Enterprise Size- Market Insights and Forecast 2022-2032, USD Million
- By Application- Market Insights and Forecast 2022-2032, USD Million
- By Industry Vertical- Market Insights and Forecast 2022-2032, USD Million
- By Country
- China
- India
- Japan
- South Korea
- Australia
- Rest of Asia Pacific
- China Real-Time Streaming Analytics Market Statistics, 2022-2032F
- Market Size & Growth Outlook
- By Revenues in USD Million
- Market Segmentation & Growth Outlook
- By Component- Market Insights and Forecast 2022-2032, USD Million
- By Deployment Mode- Market Insights and Forecast 2022-2032, USD Million
- By Enterprise Size- Market Insights and Forecast 2022-2032, USD Million
- By Application- Market Insights and Forecast 2022-2032, USD Million
- By Industry Vertical- Market Insights and Forecast 2022-2032, USD Million
- Market Size & Growth Outlook
- India Real-Time Streaming Analytics Market Statistics, 2022-2032F
- Market Size & Growth Outlook
- By Revenues in USD Million
- Market Segmentation & Growth Outlook
- By Component- Market Insights and Forecast 2022-2032, USD Million
- By Deployment Mode- Market Insights and Forecast 2022-2032, USD Million
- By Enterprise Size- Market Insights and Forecast 2022-2032, USD Million
- By Application- Market Insights and Forecast 2022-2032, USD Million
- By Industry Vertical- Market Insights and Forecast 2022-2032, USD Million
- Market Size & Growth Outlook
- Japan Real-Time Streaming Analytics Market Statistics, 2022-2032F
- Market Size & Growth Outlook
- By Revenues in USD Million
- Market Segmentation & Growth Outlook
- By Component- Market Insights and Forecast 2022-2032, USD Million
- By Deployment Mode- Market Insights and Forecast 2022-2032, USD Million
- By Enterprise Size- Market Insights and Forecast 2022-2032, USD Million
- By Application- Market Insights and Forecast 2022-2032, USD Million
- By Industry Vertical- Market Insights and Forecast 2022-2032, USD Million
- Market Size & Growth Outlook
- South Korea Real-Time Streaming Analytics Market Statistics, 2022-2032F
- Market Size & Growth Outlook
- By Revenues in USD Million
- Market Segmentation & Growth Outlook
- By Component- Market Insights and Forecast 2022-2032, USD Million
- By Deployment Mode- Market Insights and Forecast 2022-2032, USD Million
- By Enterprise Size- Market Insights and Forecast 2022-2032, USD Million
- By Application- Market Insights and Forecast 2022-2032, USD Million
- By Industry Vertical- Market Insights and Forecast 2022-2032, USD Million
- Market Size & Growth Outlook
- Australia Real-Time Streaming Analytics Market Statistics, 2022-2032F
- Market Size & Growth Outlook
- By Revenues in USD Million
- Market Segmentation & Growth Outlook
- By Component- Market Insights and Forecast 2022-2032, USD Million
- By Deployment Mode- Market Insights and Forecast 2022-2032, USD Million
- By Enterprise Size- Market Insights and Forecast 2022-2032, USD Million
- By Application- Market Insights and Forecast 2022-2032, USD Million
- By Industry Vertical- Market Insights and Forecast 2022-2032, USD Million
- Market Size & Growth Outlook
- Market Size & Growth Outlook
- Competitive Outlook
- Company Profiles
- Microsoft Corporation
- Business Description
- Service Portfolio
- Collaborations & Alliances
- Recent Developments
- Financial Details
- Others
- Amazon Web Services Inc.
- Business Description
- Service Portfolio
- Collaborations & Alliances
- Recent Developments
- Financial Details
- Others
- Google LLC
- Business Description
- Service Portfolio
- Collaborations & Alliances
- Recent Developments
- Financial Details
- Others
- IBM Corporation (Confluent)
- Business Description
- Service Portfolio
- Collaborations & Alliances
- Recent Developments
- Financial Details
- Others
- Oracle Corporation
- Business Description
- Service Portfolio
- Collaborations & Alliances
- Recent Developments
- Financial Details
- Others
- Databricks Inc.
- Business Description
- Service Portfolio
- Collaborations & Alliances
- Recent Developments
- Financial Details
- Others
- Snowflake Inc.
- Business Description
- Service Portfolio
- Collaborations & Alliances
- Recent Developments
- Financial Details
- Others
- SAS Institute Inc.
- Business Description
- Service Portfolio
- Collaborations & Alliances
- Recent Developments
- Financial Details
- Others
- Cloud Software Group Holdings Inc. (TIBCO)
- Business Description
- Service Portfolio
- Collaborations & Alliances
- Recent Developments
- Financial Details
- Others
- SAP SE
- Business Description
- Service Portfolio
- Collaborations & Alliances
- Recent Developments
- Financial Details
- Others
- Alibaba Cloud (Singapore) Private Limited
- Business Description
- Service Portfolio
- Collaborations & Alliances
- Recent Developments
- Financial Details
- Others
- Cloudera Inc.
- Business Description
- Service Portfolio
- Collaborations & Alliances
- Recent Developments
- Financial Details
- Others
- Cisco Systems Inc. (Splunk)
- Business Description
- Service Portfolio
- Collaborations & Alliances
- Recent Developments
- Financial Details
- Others
- QlikTech International AB (Qlik)
- Business Description
- Service Portfolio
- Collaborations & Alliances
- Recent Developments
- Financial Details
- Others
- Cumulocity GmbH (Apama)
- Business Description
- Service Portfolio
- Collaborations & Alliances
- Recent Developments
- Financial Details
- Others
- Microsoft Corporation
- Company Profiles
- Disclaimer
| Segment | Sub-Segment |
|---|---|
| By Component |
|
| By Deployment Mode |
|
| By Enterprise Size |
|
| By Application |
|
| By Industry Vertical |
|
| By Region |
|
Research Methodology
This study followed a structured approach comprising four key phases to assess the size and scope of the electro-oxidation market. The process began with thorough secondary research to collect data on the target market, related markets, and broader industry context. These findings, along with preliminary assumptions and estimates, were then validated through extensive primary research involving industry experts from across the value chain. To calculate the overall market size, both top-down and bottom-up methodologies were employed. Finally, market segmentation and data triangulation techniques were applied to refine and validate segment-level estimations.
Secondary Research
The secondary research phase involved gathering data from a wide range of credible and published sources. This step helped in identifying industry trends, defining market segmentation, and understanding the market landscape and value chain.
Sources consulted during this phase included:
- Company annual reports, investor presentations, and press releases
- Industry white papers and certified publications
- Trade directories and market-recognized databases
- Articles from authoritative authors and reputable journals
- Gold and silver standard websites
Secondary research was critical in mapping out the industry's value chain and monetary flow, identifying key market segments, understanding regional variations, and tracking significant industry developments.
Other key sources:
- Financial disclosures
- Industry associations and trade bodies
- News outlets and business magazines
- Academic journals and research studies
- Paid industry databases
Primary Research
To validate secondary data and gain deeper market insights, primary research was conducted with key stakeholders across both the supply and demand sides of the market.
On the demand side, participants included decision-makers and influencers from end-user industries—such as CIOs, CTOs, and CSOs—who provided first-hand perspectives on market needs, product usage, and future expectations.
On the supply side, interviews were conducted with manufacturers, industry associations, and institutional participants to gather insights into current offerings, product pipelines, and market challenges.
Primary interviews provided critical inputs such as:
- Market size and revenue data
- Product and service breakdowns
- Market forecasts
- Regional and application-specific trends
Stakeholders consulted included:
- Leading OEM and solution providers
- Channel and distribution partners
- End users across various applications
- Independent consultants and industry specialists
Market Size Estimation and Data Triangulation
- Identifying Key Market Participants (Secondary Research)
- Goal: To identify the major players or companies in the target market. This typically involves using publicly available data sources such as industry reports, market research publications, and financial statements of companies.
- Tools: Reports from firms like Gartner, Forrester, Euromonitor, Statista, IBISWorld, and others. Public financial statements, news articles, and press releases from top market players.
- Extracting Earnings of Key Market Participants
- Goal: To estimate the earnings generated from the product or service being analyzed. This step helps in understanding the revenue potential of each market player in a specific geography.
- Methods: Earnings data can be gathered from:
- Publicly available financial reports (for listed companies).
- Interviews and primary data sources from professionals, such as Directors, VPs, SVPs, etc. This is especially useful for understanding more nuanced, internal data that isn't publicly disclosed.
- Annual reports and investor presentations of key players.
- Data Collation and Development of a Relevant Data Model
- Goal: To collate inputs from both primary and secondary sources into a structured, data-driven model for market estimation. This model will incorporate key market KPIs and any independent variables relevant to the market.
- Key KPIs: These could include:
- Market size, growth rate, and demand drivers.
- Industry-specific metrics like market share, average revenue per customer (ARPC), or average deal size.
- External variables, such as economic growth rates, inflation rates, or commodity prices, that could affect the market.
- Data Modeling: Based on this data, the market forecasts are developed for the next 5 years. A combination of trend analysis, scenario modeling, and statistical regression might be used to generate projections.
- Scenario Analysis
- Goal: To test different assumptions and validate how sensitive the market is to changes in key variables (e.g., market demand, regulatory changes, technological disruptions).
- Types of Scenarios:
- Base Case: Based on current assumptions and historical data.
- Best-Case Scenario: Assuming favorable market conditions, regulatory environments, and technological advancements.
- Worst-Case Scenario: Accounting for adverse factors, such as economic downturns, stricter regulations, or unexpected disruptions.


