Qatar Water Pump Market Report: Trends, Growth and Forecast (2026-2032)
By Pump Type (Centrifugal Pumps (Overhung Pumps (Vertical Line, Horizontal End Suction), Split Case Pumps (Single/Two Stage, Multi Stage), Vertical Pumps (Turbine, Axial, Mixed Flow), Submersible Pumps (Solid Handling, Non-Solid Handling)), Positive Displacement Pump (Diaphragm Pumps, Piston Pumps, Gear Pumps, Lobe Pumps, Progressive Cavity Pumps, Screw Pumps, Vane Pumps, Peristaltic Pumps, Others)), By End User (Oil & Gas, Power, Residential, Agriculture & Irrigation, Commercial Building, HVAC, Chemical, Water & Wastewater, Food & Beverage, Others) ... Read more
|
Major Players
|
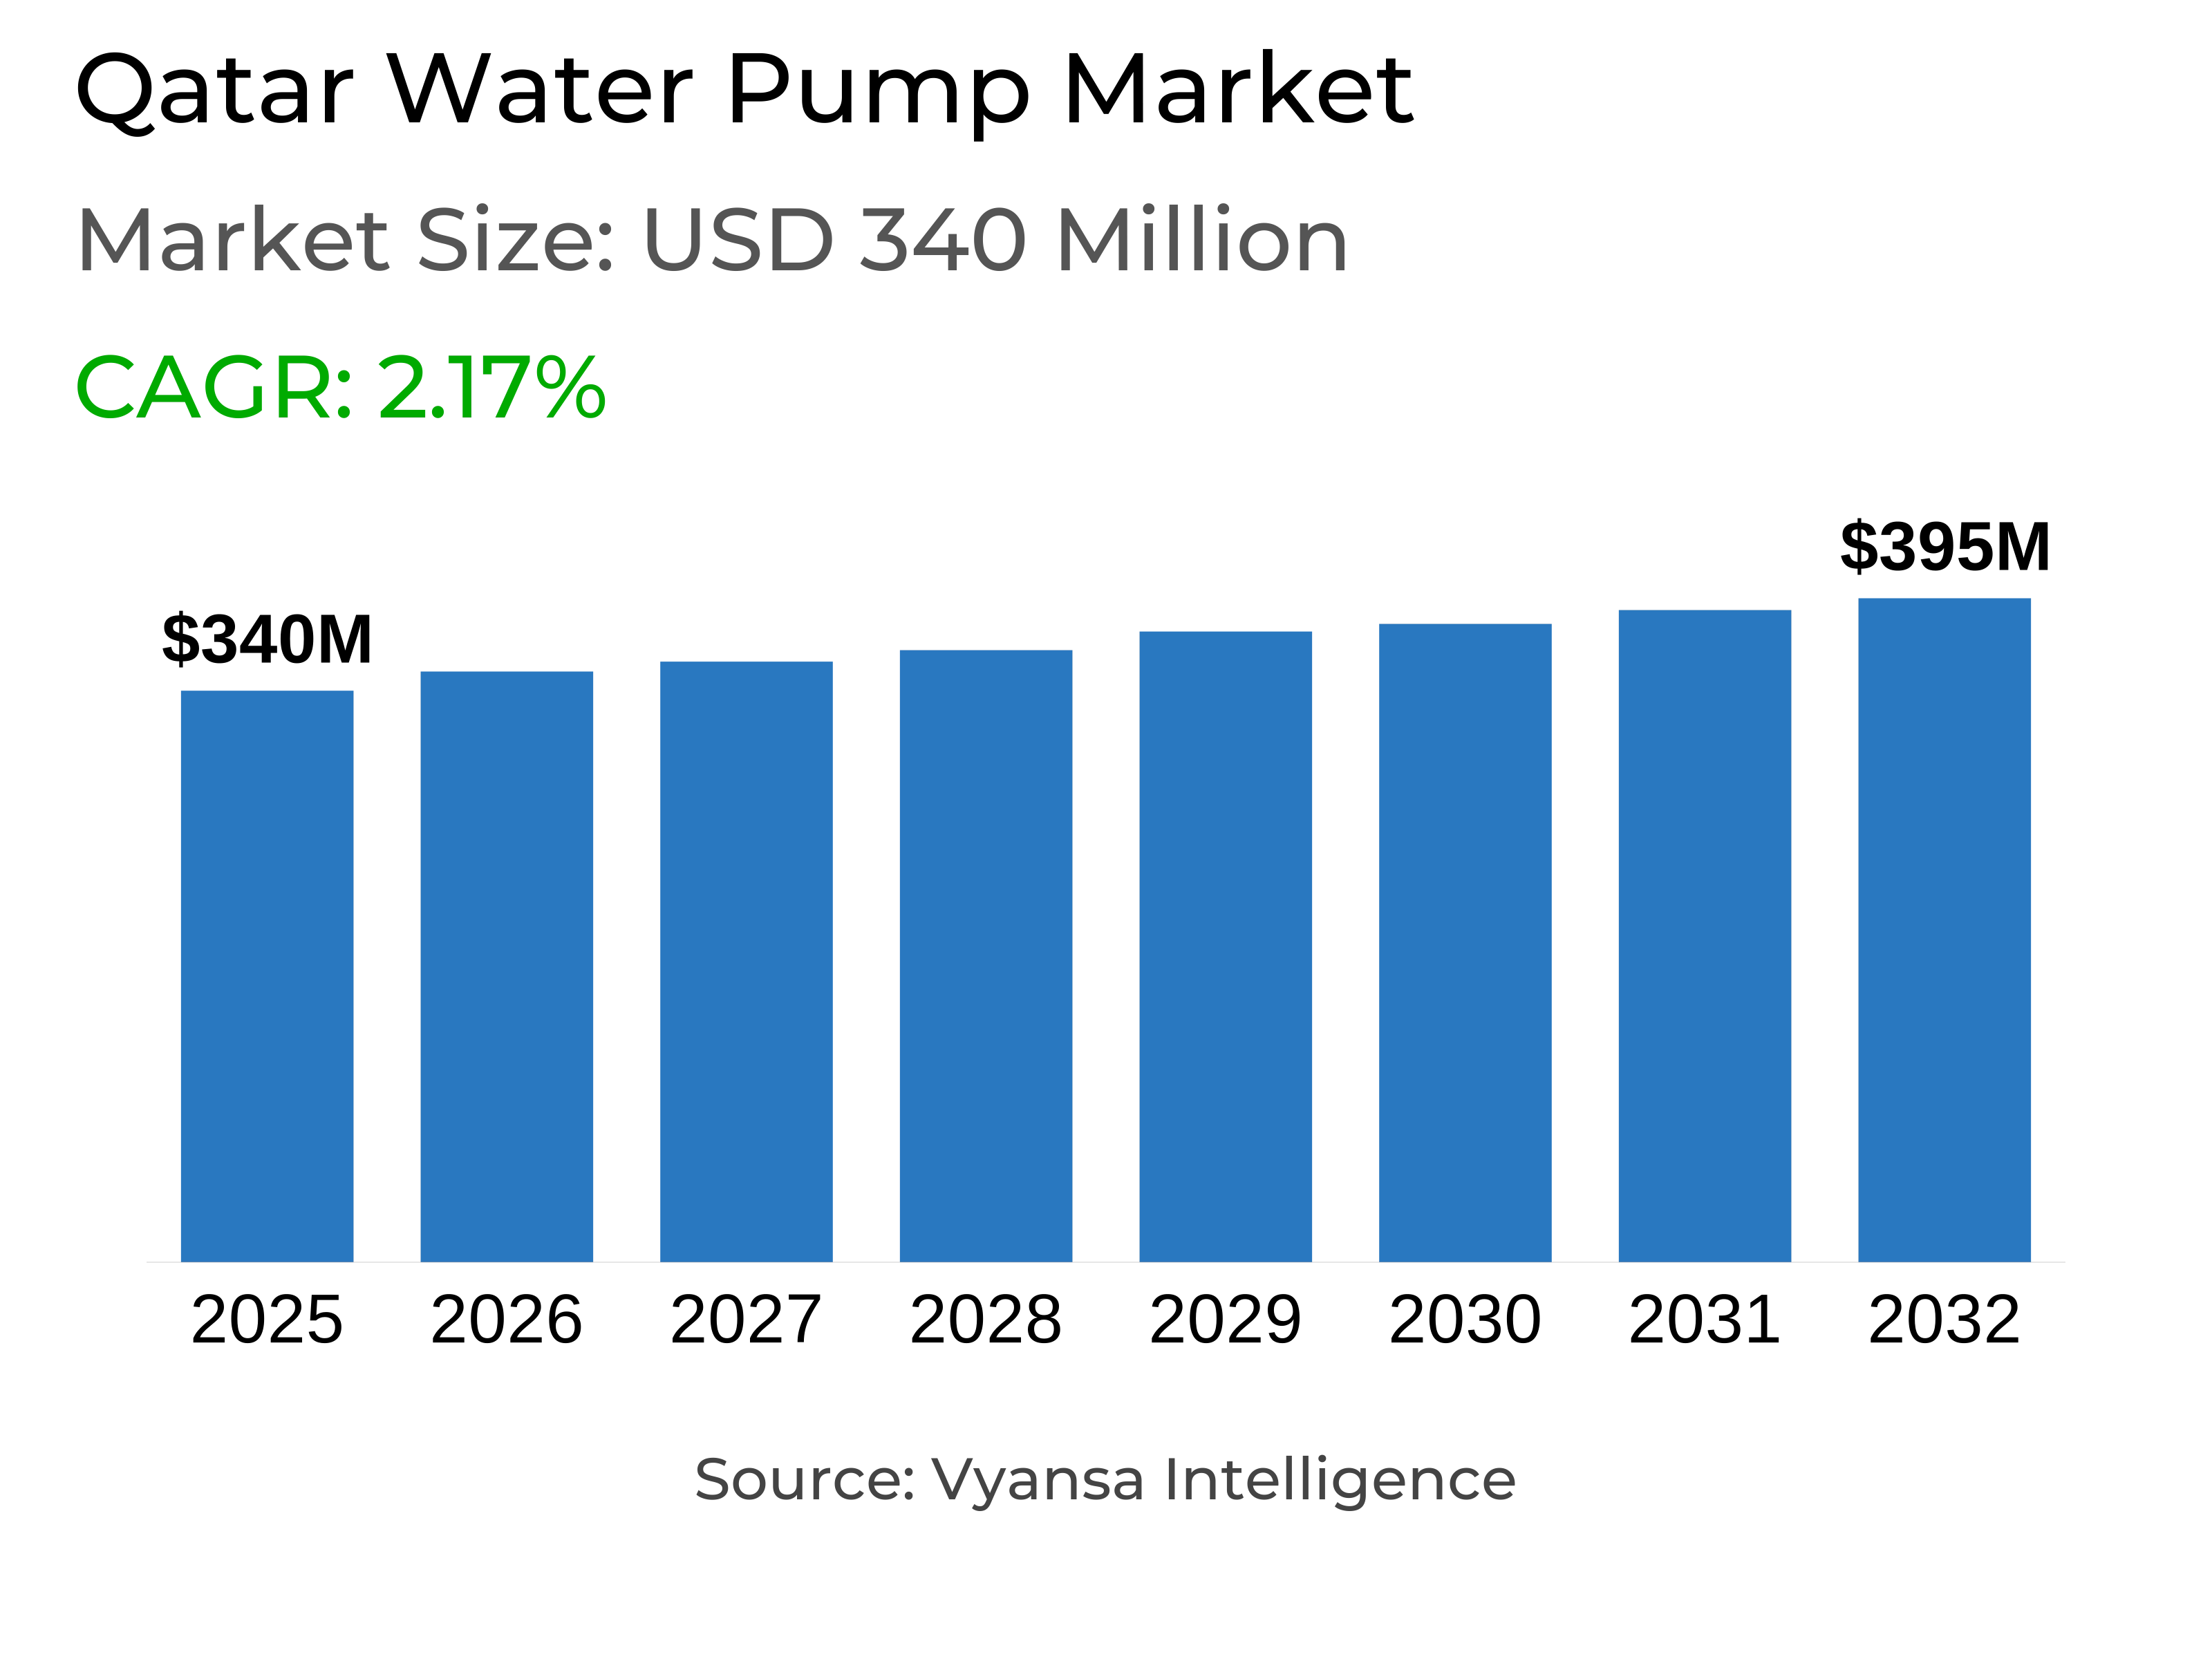
Qatar Water Pump Market Statistics and Insights, 2026
- Market Size Statistics
- Water Pump in Qatar is estimated at $ 340 Million.
- The market size is expected to grow to $ 395 Million by 2032.
- Market to register a CAGR of around 2.17% during 2026-32.
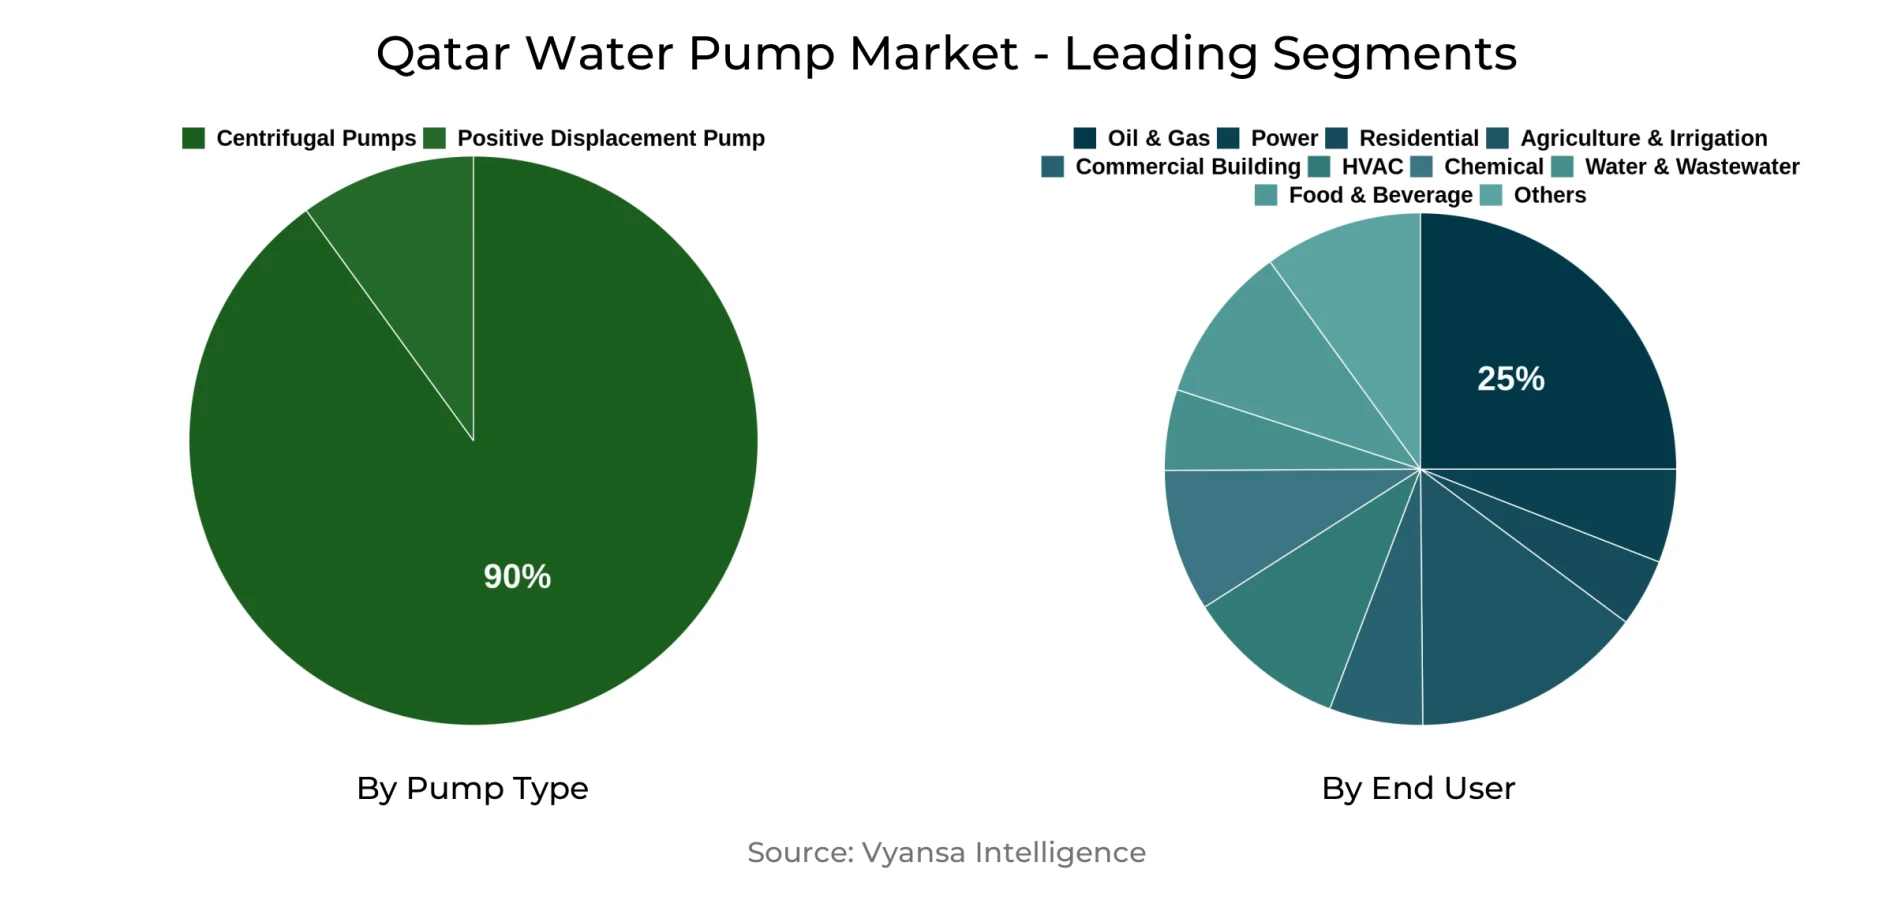
- Pump Type Segment
- Centrifugal Pumps grabbed market share of 90%.
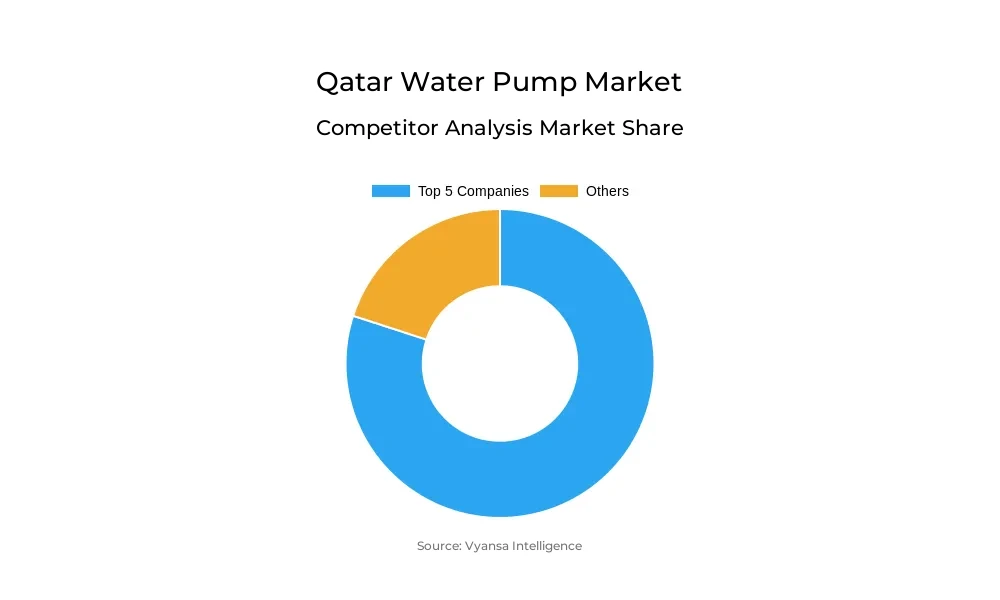
- Competition
- More than 10 companies are actively engaged in producing Water Pump in Qatar.
- Top 5 companies acquired the maximum share of the market.
- ITT, IDEX, Dover, Flowserve, Sulzer AG etc., are few of the top companies.
- End User
- Oil & Gas grabbed 25% of the market.
Qatar Water Pump Market Outlook
The water pump market of Qatar is anticipated to grow moderately during 2026-2032 on account of ongoing oil and gas investment and consistent municipal water infrastructure upkeep. The market value rises from USD 340 million in 2025 to USD 395 million in 2032 at a CAGR of 2.17%. Government projects and private power industry contracts collectively drive demand for high capacity centrifugal pumps that represent 90% of unit shipments. Large oil and gas and desalination plant procurement cycles underpin stable aftermarket service and spare parts revenues.
Capital spending commitments in Qatar's hydrocarbon industry still drive pump buying. A number of multi year field redevelopment and gas processing projects involve pump systems for high pressure and around the clock operation. Foreign pump manufacturers win long term supply and service deals for tens to hundreds of millions of USD each, contributing to steady sales even with minimal new building activity. Replacement and maintenance market for old fleet equipment provides steady income that dampens cyclicality.
Operational reliability and energy efficiency are two commercial drivers informing procurement. End users in the oil and gas and utility sectors increasingly demand pumps with enhanced energy performance and reduced life cycle cost. Retrofits of energy efficiency and variable speed drive provide incremental aftermarket opportunity. With relatively limited domestic market size, competition between global pump manufacturers is focused on local service capability, spare parts logistics and turnkey project delivery.
Peering out to 2026 to 2032 the market balance will be decided by project timing in the power industry and by utility and government maintenance budgets. Incremental spending on water reuse and distribution network maintenance will contribute modest volume for water and wastewater pumps. Supply chain robustness and local technical assistance will continue to be key differentiators for suppliers looking to turn tender opportunities into long term contracts.
Qatar Water Pump Market Growth Driver
Large scale operation in oil and gas and related midstream infrastructure is the key driver of growth for pumps in Qatar. The oil and gas industry is responsible for 25% of end user demand and demands highly reliable centrifugal pumps for produced water handling, process circulation and export systems. Procurement at the project level for field redevelopment and plant upgrade contracts on a regular basis involves pump packages between hundreds of thousands and several million USD. These transactions, along with long term maintenance agreement scopes, offer consistent order flow.
Public and private investment proposals in the energy market produce stable procurement pipelines up to 2032. Operators prefer suppliers that are able to offer full life cycle assistance such as installation commissioning and spare parts supply. That preference serves to bar entry for smaller vendors and to consolidate share among well-established global makers and service providers.
Qatar Water Pump Market Challenge
A major challenge is the small size of the Qatar market which limits economies of scale for manufacturing localization and makes the project sensitive to timing. With a national market of hundreds of millions USD and dominated by few large energy and utility buyers, the movements in a few significant tenders can make a material difference to annual revenues for suppliers.
Procurement focus also means buyers take aggressive commercial terms that squeeze margins. New entrants are challenged by the need to fulfill tough technical qualification requirements and build local service networks. For most suppliers, the expense of building a competitive local presence may not be worthwhile based on market size in the absence of bundled regional opportunities.
Unlock Market Intelligence
Explore the market potential with our data-driven report
Qatar Water Pump Market Trend
One prominent trend is quick uptake of digital monitoring systems and predictive maintenance across pump fleets. No fewer than three to four of the largest suppliers currently operating in Qatar provide bundled condition monitoring packages that integrate sensors cloud analytics and service agreements. These packages minimize unplanned downtime and drive buyer attention away from lowest initial price to total cost of ownership.
Implementation of predictive analytics and remote monitoring is allowing for extended maintenance periods and improved spare parts planning. Suppliers that combine these features with on site service facilities gain competitive edge in winning multi year maintenance contracts which underpin recurring revenue and higher retention.
Qatar Water Pump Market Opportunity
The leading chances for firms is expansion of aftermarket services and energy-saving retrofit projects during 2026-2032. Due to the mature installed base in Qatar of centrifugal pumps, suppliers can increase revenues from organized maintenance contracts, spare parts sales and upgrades like variable speed drives. Incremental retrofit work tends to be favorable margin and generates recurring revenue streams that complement equipment revenues.
Electrification of ancillary systems and regulatory stress to reduce energy intensity in industrial plants will drive demand for efficiency upgrades. Suppliers that integrate pump replacement with predictive maintenance products and remote monitoring can capture increased lifetime value per installation and differentiate when tender evaluations are made.
| Report Coverage | Details |
|---|---|
| Market Forecast | 2026-32 |
| USD Value 2025 | $ 340 Million |
| USD Value 2032 | $ 395 Million |
| CAGR 2026-2032 | 2.17% |
| Largest Category | Centrifugal Pumps segment leads with 90% market share |
| Top Drivers | Energy sector investment sustains demand |
| Top Challenges | Small domestic scale and procurement concentration |
| Top Trends | Adoption of digital monitoring and predictive maintenance for pumps |
| Top Opportunities | Aftermarket services and retrofits for energy efficiency |
| Key Players | ITT, IDEX, Dover, Flowserve, Sulzer AG, KSB, Xylem, Grundfos, Ebara, SPX Flow and Others. |
Unlock Market Intelligence
Explore the market potential with our data-driven report
Qatar Water Pump Market Segmentation Analysis
By Pump Type
- Centrifugal Pumps
- Positive Displacement Pump
Centrifugal pumps dominate the market capturing 90% share driven by the requirements from oil and gas and desalination related process streams. The technology is preferred for high flow and moderate pressure applications typical in produced water handling and circulation duties in processing plants. Capital procurements for centrifugal pump packages often include drivers controls and skid mounted assemblies valued in the hundreds of thousands to several million USD which consolidates spend with full scope suppliers.
Positive displacement units serve niche needs where precise volumetric control or very high pressure in small flows is required. Demand for these units is comparatively small in Qatar but remains important for specialist chemical dosing and some subsea and well service applications. Given the small share positive displacement suppliers focus on technical differentiation and specialized service support.
By End User
- Oil & Gas
- Power
- Residential
- Agriculture & Irrigation
- Commercial Building
- HVAC
- Chemical
- Water & Wastewater
- Food & Beverage
- Others
Oil and gas is the largest end user segment with 25% of market share. The sector requires robust centrifugal pumps for process handling and field operations. Project pipelines for gas processing and maintaining existing hydrocarbon production support recurring procurement and aftermarket activity. Major buyers favor vendors that provide integrated package solutions and comprehensive maintenance coverage.
Power generation and water and wastewater utilities follow oil and gas in importance offering stable replacement demand and contracts for service. Commercial buildings and industrial segments provide smaller but steady volumes for packaged and submersible pumps. Given the market concentration suppliers tailor proposals to meet stringent qualification criteria demanded by large energy sector procurers.
Top Companies in Qatar Water Pump Market
The top companies operating in the market include ITT, IDEX, Dover, Flowserve, Sulzer AG, KSB, Xylem, Grundfos, Ebara, SPX Flow, etc., are the top players operating in the Qatar Water Pump Market.
Frequently Asked Questions
Related Report
1. Market Segmentation
1.1. Research Scope
1.2. Research Methodology
1.3. Definitions and Assumptions
2. Executive Summary
3. Qatar Water Pump Market Policies, Regulations, and Standards
4. Qatar Water Pump Market Dynamics
4.1. Growth Factors
4.2. Challenges
4.3. Trends
4.4. Opportunities
5. Qatar Water Pump Market Statistics, 2022-2032F
5.1. Market Size & Growth Outlook
5.1.1.By Revenues in US$ Million
5.1.2.By Units Sold in Million Units
5.2. Market Segmentation & Growth Outlook
5.2.1.By Pump Type
5.2.1.1. Centrifugal Pumps- Market Insights and Forecast 2022-2032, USD Million
5.2.1.1.1. Overhung Pumps- Market Insights and Forecast 2022-2032, USD Million
5.2.1.1.1.1. Vertical Line- Market Insights and Forecast 2022-2032, USD Million
5.2.1.1.1.2. Horizontal End Suction- Market Insights and Forecast 2022-2032, USD Million
5.2.1.1.2. Split Case Pumps- Market Insights and Forecast 2022-2032, USD Million
5.2.1.1.2.1. Single/Two Stage- Market Insights and Forecast 2022-2032, USD Million
5.2.1.1.2.2. Multi Stage- Market Insights and Forecast 2022-2032, USD Million
5.2.1.1.3. Vertical Pumps- Market Insights and Forecast 2022-2032, USD Million
5.2.1.1.3.1. Turbine- Market Insights and Forecast 2022-2032, USD Million
5.2.1.1.3.2. Axial- Market Insights and Forecast 2022-2032, USD Million
5.2.1.1.3.3. Mixed Flow- Market Insights and Forecast 2022-2032, USD Million
5.2.1.1.4. Submersible Pumps- Market Insights and Forecast 2022-2032, USD Million
5.2.1.1.4.1. Solid Handling- Market Insights and Forecast 2022-2032, USD Million
5.2.1.1.4.2. Non-Solid Handling- Market Insights and Forecast 2022-2032, USD Million
5.2.1.2. Positive Displacement Pump- Market Insights and Forecast 2022-2032, USD Million
5.2.1.2.1. Diaphragm Pumps- Market Insights and Forecast 2022-2032, USD Million
5.2.1.2.2. Piston Pumps- Market Insights and Forecast 2022-2032, USD Million
5.2.1.2.3. Gear Pumps- Market Insights and Forecast 2022-2032, USD Million
5.2.1.2.4. Lobe Pumps- Market Insights and Forecast 2022-2032, USD Million
5.2.1.2.5. Progressive Cavity Pumps- Market Insights and Forecast 2022-2032, USD Million
5.2.1.2.6. Screw Pumps- Market Insights and Forecast 2022-2032, USD Million
5.2.1.2.7. Vane Pumps- Market Insights and Forecast 2022-2032, USD Million
5.2.1.2.8. Peristaltic Pumps- Market Insights and Forecast 2022-2032, USD Million
5.2.1.2.9. Others- Market Insights and Forecast 2022-2032, USD Million
5.2.2.By End User
5.2.2.1. Oil & Gas- Market Insights and Forecast 2022-2032, USD Million
5.2.2.2. Power- Market Insights and Forecast 2022-2032, USD Million
5.2.2.3. Residential- Market Insights and Forecast 2022-2032, USD Million
5.2.2.4. Agriculture & Irrigation- Market Insights and Forecast 2022-2032, USD Million
5.2.2.5. Commercial Building- Market Insights and Forecast 2022-2032, USD Million
5.2.2.6. HVAC- Market Insights and Forecast 2022-2032, USD Million
5.2.2.7. Chemical- Market Insights and Forecast 2022-2032, USD Million
5.2.2.8. Water & Wastewater- Market Insights and Forecast 2022-2032, USD Million
5.2.2.9. Food & Beverage- Market Insights and Forecast 2022-2032, USD Million
5.2.2.10. Others- Market Insights and Forecast 2022-2032, USD Million
5.2.3.By Competitors
5.2.3.1. Competition Characteristics
5.2.3.2. Market Share & Analysis
6. Qatar Centrifugal Pump Water Pump Market Statistics, 2022-2032F
6.1. Market Size & Growth Outlook
6.1.1.By Revenues in US$ Million
6.1.2.By Units Sold in Million Units
6.2. Market Segmentation & Growth Outlook
6.2.1.By Pump Type- Market Insights and Forecast 2022-2032, USD Million
6.2.2.By End User- Market Insights and Forecast 2022-2032, USD Million
7. Qatar Positive Displacement Pump Water Pump Market Statistics, 2022-2032F
7.1. Market Size & Growth Outlook
7.1.1.By Revenues in US$ Million
7.1.2.By Units Sold in Million Units
7.2. Market Segmentation & Growth Outlook
7.2.1.By Pump Type- Market Insights and Forecast 2022-2032, USD Million
7.2.2.By End User- Market Insights and Forecast 2022-2032, USD Million
8. Competitive Outlook
8.1. Company Profiles
8.1.1.Flowserve
8.1.1.1. Business Description
8.1.1.2. Product Portfolio
8.1.1.3. Collaborations & Alliances
8.1.1.4. Recent Developments
8.1.1.5. Financial Details
8.1.1.6. Others
8.1.2.Sulzer AG
8.1.2.1. Business Description
8.1.2.2. Product Portfolio
8.1.2.3. Collaborations & Alliances
8.1.2.4. Recent Developments
8.1.2.5. Financial Details
8.1.2.6. Others
8.1.3.KSB
8.1.3.1. Business Description
8.1.3.2. Product Portfolio
8.1.3.3. Collaborations & Alliances
8.1.3.4. Recent Developments
8.1.3.5. Financial Details
8.1.3.6. Others
8.1.4.Xylem
8.1.4.1. Business Description
8.1.4.2. Product Portfolio
8.1.4.3. Collaborations & Alliances
8.1.4.4. Recent Developments
8.1.4.5. Financial Details
8.1.4.6. Others
8.1.5.Grundfos
8.1.5.1. Business Description
8.1.5.2. Product Portfolio
8.1.5.3. Collaborations & Alliances
8.1.5.4. Recent Developments
8.1.5.5. Financial Details
8.1.5.6. Others
8.1.6.ITT
8.1.6.1. Business Description
8.1.6.2. Product Portfolio
8.1.6.3. Collaborations & Alliances
8.1.6.4. Recent Developments
8.1.6.5. Financial Details
8.1.6.6. Others
8.1.7.IDEX
8.1.7.1. Business Description
8.1.7.2. Product Portfolio
8.1.7.3. Collaborations & Alliances
8.1.7.4. Recent Developments
8.1.7.5. Financial Details
8.1.7.6. Others
8.1.8.Dover
8.1.8.1. Business Description
8.1.8.2. Product Portfolio
8.1.8.3. Collaborations & Alliances
8.1.8.4. Recent Developments
8.1.8.5. Financial Details
8.1.8.6. Others
8.1.9.Ebara
8.1.9.1. Business Description
8.1.9.2. Product Portfolio
8.1.9.3. Collaborations & Alliances
8.1.9.4. Recent Developments
8.1.9.5. Financial Details
8.1.9.6. Others
8.1.10. SPX Flow
8.1.10.1. Business Description
8.1.10.2. Product Portfolio
8.1.10.3. Collaborations & Alliances
8.1.10.4. Recent Developments
8.1.10.5. Financial Details
8.1.10.6. Others
9. Disclaimer
| Segment | Sub-Segment |
|---|---|
| By Pump Type |
|
| By End User |
|
Research Methodology
This study followed a structured approach comprising four key phases to assess the size and scope of the electro-oxidation market. The process began with thorough secondary research to collect data on the target market, related markets, and broader industry context. These findings, along with preliminary assumptions and estimates, were then validated through extensive primary research involving industry experts from across the value chain. To calculate the overall market size, both top-down and bottom-up methodologies were employed. Finally, market segmentation and data triangulation techniques were applied to refine and validate segment-level estimations.
Secondary Research
The secondary research phase involved gathering data from a wide range of credible and published sources. This step helped in identifying industry trends, defining market segmentation, and understanding the market landscape and value chain.
Sources consulted during this phase included:
- Company annual reports, investor presentations, and press releases
- Industry white papers and certified publications
- Trade directories and market-recognized databases
- Articles from authoritative authors and reputable journals
- Gold and silver standard websites
Secondary research was critical in mapping out the industry's value chain and monetary flow, identifying key market segments, understanding regional variations, and tracking significant industry developments.
Other key sources:
- Financial disclosures
- Industry associations and trade bodies
- News outlets and business magazines
- Academic journals and research studies
- Paid industry databases
Primary Research
To validate secondary data and gain deeper market insights, primary research was conducted with key stakeholders across both the supply and demand sides of the market.
On the demand side, participants included decision-makers and influencers from end-user industries—such as CIOs, CTOs, and CSOs—who provided first-hand perspectives on market needs, product usage, and future expectations.
On the supply side, interviews were conducted with manufacturers, industry associations, and institutional participants to gather insights into current offerings, product pipelines, and market challenges.
Primary interviews provided critical inputs such as:
- Market size and revenue data
- Product and service breakdowns
- Market forecasts
- Regional and application-specific trends
Stakeholders consulted included:
- Leading OEM and solution providers
- Channel and distribution partners
- End users across various applications
- Independent consultants and industry specialists
Market Size Estimation and Data Triangulation
- Identifying Key Market Participants (Secondary Research)
- Goal: To identify the major players or companies in the target market. This typically involves using publicly available data sources such as industry reports, market research publications, and financial statements of companies.
- Tools: Reports from firms like Gartner, Forrester, Euromonitor, Statista, IBISWorld, and others. Public financial statements, news articles, and press releases from top market players.
- Extracting Earnings of Key Market Participants
- Goal: To estimate the earnings generated from the product or service being analyzed. This step helps in understanding the revenue potential of each market player in a specific geography.
- Methods: Earnings data can be gathered from:
- Publicly available financial reports (for listed companies).
- Interviews and primary data sources from professionals, such as Directors, VPs, SVPs, etc. This is especially useful for understanding more nuanced, internal data that isn't publicly disclosed.
- Annual reports and investor presentations of key players.
- Data Collation and Development of a Relevant Data Model
- Goal: To collate inputs from both primary and secondary sources into a structured, data-driven model for market estimation. This model will incorporate key market KPIs and any independent variables relevant to the market.
- Key KPIs: These could include:
- Market size, growth rate, and demand drivers.
- Industry-specific metrics like market share, average revenue per customer (ARPC), or average deal size.
- External variables, such as economic growth rates, inflation rates, or commodity prices, that could affect the market.
- Data Modeling: Based on this data, the market forecasts are developed for the next 5 years. A combination of trend analysis, scenario modeling, and statistical regression might be used to generate projections.
- Scenario Analysis
- Goal: To test different assumptions and validate how sensitive the market is to changes in key variables (e.g., market demand, regulatory changes, technological disruptions).
- Types of Scenarios:
- Base Case: Based on current assumptions and historical data.
- Best-Case Scenario: Assuming favorable market conditions, regulatory environments, and technological advancements.
- Worst-Case Scenario: Accounting for adverse factors, such as economic downturns, stricter regulations, or unexpected disruptions.


