Global Praseodymium Oxide Market Report: Trends, Growth and Forecast (2026-2032)
By Type (Pure Praseodymium Oxide (99%, 99.9%, 99.99%, 99.999%), Mixed Rare Earth Oxides), By Application (Magnets, Glass & Ceramics Coloring, Catalysts, Optical Glass, Others), By Region (North America, South America, Europe, Middle East & Africa, Asia Pacific) ... Read more
|
Major Players
|
Global Praseodymium Oxide Market Statistics and Insights, 2026
- Market Size Statistics
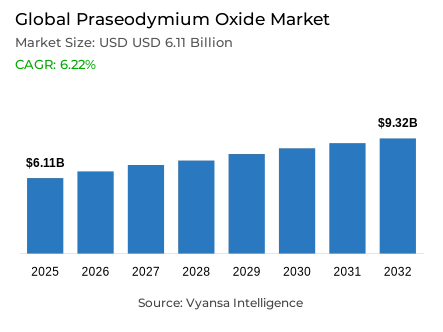
- Global praseodymium oxide market is estimated at USD 6.11 billion in 2025.
- The market size is expected to grow to USD 9.32 billion by 2032.
- Market to register a CAGR of around 6.22% during 2026-32.
- Type Shares
- Mixed rare earth oxides grabbed market share of 50%.
- Competition
- Global praseodymium oxide market is currently being catered to by more than 30 companies.
- Top 5 companies acquired around 70% of the market share.
- Shenghe Resources Holding Co. Ltd.; China Minmetals Rare Earth Co. Ltd.; Baotou Steel Rare Earth Group; China Northern Rare Earth Group; Lynas Corporation etc., are few of the top companies.
- Application
- Magnets grabbed 65% of the market.
- Region
- Asia Pacific leads with a 65% share of the global market.
Global Praseodymium Oxide Market Outlook
The Global praseodymium oxide market is expected to witness a steady growth phase over the years from 2026-2032, mainly driven by the development of the electric vehicle sector at a rapid pace and the increasing application of technologies using permanent magnets. The praseodymium oxide market was valued at $6.11 billion in 2025 and is expected to reach $9.32 billion by the end of the forecasted periods at a growth rate of about 6.22%. The increasing production of electric vehicles and the subsequent use of wind energy is helping the praseodymium neodymium magnets develop rapidly in the global arena.
With a market share of 65%, permanent magnets currently occupy the leading market position in terms of total usage demand. The importance of the material is also underscored by the forecasting efforts of IRENA, identifying a rising reliance on magnet-quality rare earth elements in the face of fast-growing electrification. Wind turbines and EVs are counted among the leading consumers of magnets, thus ensuring a steady market during the forecast period.
The supply side also gets challenged by the dominance of China in the mining and processing of rare earth elements. The dominance of this country in 2024 accounted for over two-thirds of mine supply, besides producing over 95,000 metric tons of praseodymium-neodymium oxide. This indicates that there is dominance in this sector and this has attracted consideration for diversification and formation of strategic stocks.
Rare Earth Oxide Mix accounts for the dominant type of rare earths, with a market capture of 50%. This is largely due to their lower cost of production and the occurrence of praseodymium and neodymium side by side in form of rare earths. The market is also led by the Asia Pacific market, with a market share of 65%. The supportive rare earths refining and magnet manufacturing chain in China is a key reason behind this leading market share.

Global Praseodymium Oxide Market Growth Driver
Expanding Electrification Accelerates Demand Growth
Rapid expansion of electric vehicle manufacturing continues to strengthen demand for praseodymium oxide, with permanent-magnet-based traction motors remaining a core technology across global electrification pathways. The International Energy Agency said rare earth demand used in permanent magnets is projected to rise sharply through 2040, reflecting the centrality of praseodymium-neodymium alloys. China-in its national quota system--produced 270,000 metric tons of rare earth oxide equivalent in 2024, adding to total global mine output of 390,000 metric tons that year. Praseodymium-neodymium oxide accounted for 95,046.5 metric tons in China alone, reinforcing the scale of magnet-grade material that EV manufacturers require as electrification accelerates across markets worldwide.
The permanent magnet category remains the dominant application channel supporting market expansion, with IRENA estimating that it accounted for around 29% of rare earth demand in 2020 and could reach 40% by 2030. Wind turbines combined with electric vehicles represented roughly one-third of permanent magnet consumption in 2020, demonstrating diversified end-use reliance on praseodymium oxide. Each electric vehicle incorporates permanent magnets within its traction motor design, which firmly cements this material as a critical enabler of performance efficiency and compact motor architecture. Rising EV production volumes therefore directly reinforce long-term praseodymium oxide demand strength across the 2026–2032 outlook.
Global Praseodymium Oxide Market Challenge
Supply Concentration and Policy Restrictions Intensify Market Constraints
Dominance by China in mining and processing has amplified the supply vulnerability in structure for the Global praseodymium oxide market. China accounted for 69.2% of global production by rare earth mines alone in 2024, while its processing capacity is even more concentrated. Geopolitical considerations heightened uncertainty further in 2025 as China introduced more export controls on items related to rare earths, underlining priorities for national security. These measures, along with the bottlenecks in processing, bring about persistent fragility in supplies, making both availability and price more vulnerable to policy decisions and operational constraints.
Adding to that would be regulatory and environmental considerations, since China's production standards and site-level restrictions periodically constrict output. International trade disputes have historically generated price volatility, which has stimulated governments-the United States being one-to explore strategic price support mechanisms for neodymium-praseodymium materials. Discussions of floor price frameworks underline growing concerns relative to long-term supply stability. These factors taken together would indicate ongoing uncertainty for market participants through 2026-2032, especially as geopolitical tension interacts with environmental regulation and concentrated processing capacity.
Unlock Market Intelligence
Explore the market potential with our data-driven report
Global Praseodymium Oxide Market Trend
Advancing Recycling Practices Shape New Market Patterns
Increasing focus on circularity is reworking supply approaches in the Global praseodymium oxide market, with recycling now seen as one of the practical paths to supplement conventional mining. According to a McKinsey estimate, magnetic rare earths demand could move from about 59 ktons in 2022 to 176 ktons by 2035, further fuelling interest in recovered materials. Projects like the work at HyProMag have achieved high-efficiency recoveries from end-of-life magnets; similarly, several major technology companies have developed low-emission recycling methods to commercially significant yields. These initiatives reflect building momentum within the industry for environmentally responsible management of rare earth resources.
Investments in new recycling infrastructures support the diversification of supply chains previously dependent on primary mineral extraction. Large-scale magnet recycling and re-manufacturing facilities suggest that confidence in second-life rare earth streams is on the rise. As these technologies improve, the market becomes more inelastic and less exposed to geopolitical disturbances. Ultimately, it aids long-term resilience by minimizing dependencies on virgin praseodymium oxide feedstocks while supporting complex sustainability commitments across global electrification industries.
Global Praseodymium Oxide Market Opportunity
Technological Shifts Enable Future Market Prospects
The innovation sector majorly invoved in motor design and magnet chemistry creating long term growth potential. The partnerships, such as between Stellantis and Niron Magnetics, enabled by the U.S. Department of Energy, mark key progress toward developing rare-earth-free motor concepts. For instance, in some select platforms, automotive leaders such as BMW and Nissan have already integrated induction motors or wound-field synchronous motors, showcasing other workable alternatives that would help reduce dependence on permanent magnets. Research of nitrogen-iron compounds and next-generation magnetic materials continues to gain steam across laboratories and pilot-scale activities.
Despite these developments, permanent magnet technologies prevail due to superior power density and torque delivery, coupled with efficiency. Continuous optimisation seeks to decrease further the reliance on heavy rare earths through the enhancement of praseodymium-neodymium magnet formulations. The longer-term demand trajectory for praseodymium oxide depends on the speed at which alternative motor technologies gain traction in the EV sector relative to continued momentum for magnet-based systems. In balancing supply security against performance needs, market participants face both new opportunities and risks from emerging technologies over the 2026–2032 forecast horizon.
Global Praseodymium Oxide Market Regional Analysis

By Region
- North America
- South America
- Europe
- Middle East & Africa
- Asia Pacific
Asia Pacific leads the Global praseodymium oxide market with a commanding 65% share, supported by China’s extensive mining, separation, and magnet manufacturing capabilities. China accounted for 69.2% of global rare earth mine output in 2024, while also operating the world’s most advanced and concentrated separation capacity. These structural advantages underpin the region’s influence across pricing, supply availability, and downstream permanent magnet production. Strong domestic EV adoption and wind energy deployment further reinforce the region’s dominant market contribution.
Regional supply integration also strengthens Asia Pacific’s leadership position. Myanmar supplied approximately 34% of China’s rare earth imports in 2024, while Australia and other regional producers contribute additional upstream materials. This interconnected supply chain architecture ensures stable material flows into China’s processing ecosystem, which remains central to global praseodymium oxide distribution. As electrification and renewable energy development intensify across Asia Pacific, the region is expected to maintain its leading position throughout the 2026–2032 forecast period.
Unlock Market Intelligence
Explore the market potential with our data-driven report
Global Praseodymium Oxide Market Segmentation Analysis
By Type
- Pure Praseodymium Oxide
- Mixed Rare Earth Oxides
Mixed rare earth oxides remain the leading type category, capturing 50% market share and reflecting the natural co-occurrence of praseodymium with neodymium and related elements. China’s 2024 production illustrates this structural characteristic, with 95,046.5 metric tons of praseodymium-neodymium oxide produced as a major co-product of rare earth separation. Because these elements occur together in primary deposits, extraction economics strongly favor mixed-oxide output, establishing it as the foundation of global praseodymium supply. This reinforces its central role in meeting industry requirements over the forecast horizon.
Separation and refining capabilities significantly influence pure praseodymium oxide availability, with China producing an estimated 254,000 tons of separated oxides in 2024. Processing mixed oxides remains the prevailing industry practice due to cost efficiencies and the technical complexity associated with isolating individual elements. As demand continues expanding in magnet and electrification industries, scaling mixed rare earth oxide production is expected to remain the dominant route for meeting global needs, sustaining its leadership position across the 2026–2032 period.

By Application
- Magnets
- Glass & Ceramics Coloring
- Catalysts
- Optical Glass
- Others
Permanent magnets account for 65% of the application market share, underscoring their critical role within electrification-driven end-use industries. IRENA estimates that permanent magnets represented approximately 29-35% of total rare earth demand in 2020, with potential to reach 40% by 2030 as electric mobility and wind energy sectors expand. Praseodymium-neodymium-based magnet alloys enable high-performance electric motors used in vehicles, industrial machinery, and renewable power equipment, strengthening their position as the most influential demand center for praseodymium oxide.
The wind energy sector serves as the second-largest application for permanent magnets, particularly due to the adoption of direct-drive turbine designs that rely heavily on praseodymium-neodymium magnet materials. These technologies enhance power generation reliability and reduce maintenance needs, reinforcing magnet utilization in the renewables sector. Combined with accelerating EV manufacturing, these applications ensure sustained dominance of praseodymium oxide within the magnet category through 2026–2032, with overall stability dependent on electrification deployment patterns and the global expansion of renewable power infrastructure.
Market Players in Global Praseodymium Oxide Market
These market players maintain a significant presence in the Global praseodymium oxide market sector and contribute to its ongoing evolution.
- Shenghe Resources Holding Co. Ltd.
- China Minmetals Rare Earth Co. Ltd.
- Baotou Steel Rare Earth Group
- China Northern Rare Earth Group
- Lynas Corporation
- Indian Rare Earths Limited (IREL)
- Neo Performance Materials
- Arafura Resources
- Xiamen Tungsten Co. Ltd.
- Ganzhou Qiandong Rare Earth Group
- MP Materials Corp.
- China Southern Rare Earth Group
- Avalon Advanced Materials Inc.
- Great Western Minerals Group
- Iluka Resources Limited
Market News & Updates
- Lynas Corporation, 2025:
Lynas Corporation reached a major operational milestone in mid-2025 by launching commercial-scale production of separated heavy rare earth oxides, including dysprosium and terbium, at its Malaysian facility. The company reported record NdPr oxide output of approximately 1,500 tonnes per quarter, reinforcing Lynas’ position as the world’s only commercial producer of separated heavy rare earth oxides outside China. The facility’s heavy rare earth production line is designed for an annual capacity of around 1,500 tonnes of mixed HREE compounds.
- MP Materials Corp., 2025:
MP Materials entered a landmark public-private partnership with the U.S. Department of Defense in July 2025, receiving $400 million in preferred equity (15% ownership basis) and a $150 million, 12-year loan to expand heavy rare-earth separation. The DoD committed to purchasing 7,000 MT of magnets annually for 10 years from MP’s expanded 10,000 MT/year magnet capacity across the new “10X” facility and the scaled Independence plant. The agreement includes a $110/kg NdPr price-floor Contract for Difference, covering all NdPr-containing products, plus profit-sharing provisions tied to MP’s EBITDA. This partnership significantly de-risks U.S. magnet supply and strengthens domestic resilience against China-dominated rare-earth supply chains.
Frequently Asked Questions
Related Report
1. Market Segmentation
1.1. Research Scope
1.2. Research Methodology
1.3. Definitions and Assumptions
2. Executive Summary
3. Global Praseodymium Oxide Market Policies, Regulations, and Standards
4. Global Praseodymium Oxide Market Dynamics
4.1. Growth Factors
4.2. Challenges
4.3. Trends
4.4. Opportunities
5. Global Praseodymium Oxide Market Statistics, 2022-2032F
5.1. Market Size & Growth Outlook
5.1.1.By Revenues in USD Million
5.2. Market Segmentation & Growth Outlook
5.2.1.By Type
5.2.1.1. Pure Praseodymium Oxide- Market Insights and Forecast 2022-2032, USD Million
5.2.1.1.1. 99%- Market Insights and Forecast 2022-2032, USD Million
5.2.1.1.2. 99.9%- Market Insights and Forecast 2022-2032, USD Million
5.2.1.1.3. 99.99%- Market Insights and Forecast 2022-2032, USD Million
5.2.1.1.4. 99.999%- Market Insights and Forecast 2022-2032, USD Million
5.2.1.2. Mixed Rare Earth Oxides- Market Insights and Forecast 2022-2032, USD Million
5.2.2.By Application
5.2.2.1. Magnets- Market Insights and Forecast 2022-2032, USD Million
5.2.2.2. Glass & Ceramics Coloring- Market Insights and Forecast 2022-2032, USD Million
5.2.2.3. Catalysts- Market Insights and Forecast 2022-2032, USD Million
5.2.2.4. Optical Glass- Market Insights and Forecast 2022-2032, USD Million
5.2.2.5. Others- Market Insights and Forecast 2022-2032, USD Million
5.2.3.By Region
5.2.3.1. North America
5.2.3.2. South America
5.2.3.3. Europe
5.2.3.4. Middle East & Africa
5.2.3.5. Asia Pacific
5.2.4.By Competitors
5.2.4.1. Competition Characteristics
5.2.4.2. Market Share & Analysis
6. North America Praseodymium Oxide Market Statistics, 2022-2032F
6.1. Market Size & Growth Outlook
6.1.1.By Revenues in USD Million
6.2. Market Segmentation & Growth Outlook
6.2.1.By Type- Market Insights and Forecast 2022-2032, USD Million
6.2.2.By Application- Market Insights and Forecast 2022-2032, USD Million
6.2.3.By Country
6.2.3.1. US
6.2.3.2. Canada
6.2.3.3. Mexico
6.2.3.4. Rest of North America
6.3. US Praseodymium Oxide Market Statistics, 2022-2032F
6.3.1.Market Size & Growth Outlook
6.3.1.1. By Revenues in USD Million
6.3.2.Market Segmentation & Growth Outlook
6.3.2.1. By Type- Market Insights and Forecast 2022-2032, USD Million
6.3.2.2. By Application- Market Insights and Forecast 2022-2032, USD Million
6.4. Canada Praseodymium Oxide Market Statistics, 2022-2032F
6.4.1.Market Size & Growth Outlook
6.4.1.1. By Revenues in USD Million
6.4.2.Market Segmentation & Growth Outlook
6.4.2.1. By Type- Market Insights and Forecast 2022-2032, USD Million
6.4.2.2. By Application- Market Insights and Forecast 2022-2032, USD Million
6.5. Mexico Praseodymium Oxide Market Statistics, 2022-2032F
6.5.1.Market Size & Growth Outlook
6.5.1.1. By Revenues in USD Million
6.5.2.Market Segmentation & Growth Outlook
6.5.2.1. By Type- Market Insights and Forecast 2022-2032, USD Million
6.5.2.2. By Application- Market Insights and Forecast 2022-2032, USD Million
7. South America Praseodymium Oxide Market Statistics, 2022-2032F
7.1. Market Size & Growth Outlook
7.1.1.By Revenues in USD Million
7.2. Market Segmentation & Growth Outlook
7.2.1.By Type- Market Insights and Forecast 2022-2032, USD Million
7.2.2.By Application- Market Insights and Forecast 2022-2032, USD Million
7.2.3.By Country
7.2.3.1. Brazil
7.2.3.2. Argentina
7.2.3.3. Rest of South America
7.3. Brazil Praseodymium Oxide Market Statistics, 2022-2032F
7.3.1.Market Size & Growth Outlook
7.3.1.1. By Revenues in USD Million
7.3.2.Market Segmentation & Growth Outlook
7.3.2.1. By Type- Market Insights and Forecast 2022-2032, USD Million
7.3.2.2. By Application- Market Insights and Forecast 2022-2032, USD Million
7.4. Argentina Praseodymium Oxide Market Statistics, 2022-2032F
7.4.1.Market Size & Growth Outlook
7.4.1.1. By Revenues in USD Million
7.4.2.Market Segmentation & Growth Outlook
7.4.2.1. By Type- Market Insights and Forecast 2022-2032, USD Million
7.4.2.2. By Application- Market Insights and Forecast 2022-2032, USD Million
8. Europe Praseodymium Oxide Market Statistics, 2022-2032F
8.1. Market Size & Growth Outlook
8.1.1.By Revenues in USD Million
8.2. Market Segmentation & Growth Outlook
8.2.1.By Type- Market Insights and Forecast 2022-2032, USD Million
8.2.2.By Application- Market Insights and Forecast 2022-2032, USD Million
8.2.3.By Country
8.2.3.1. Germany
8.2.3.2. France
8.2.3.3. UK
8.2.3.4. Italy
8.2.3.5. Netherlands
8.2.3.6. Belgium
8.2.3.7. Poland
8.2.3.8. Russia
8.2.3.9. Rest of Europe
8.3. Germany Praseodymium Oxide Market Statistics, 2022-2032F
8.3.1.Market Size & Growth Outlook
8.3.1.1. By Revenues in USD Million
8.3.2.Market Segmentation & Growth Outlook
8.3.2.1. By Type- Market Insights and Forecast 2022-2032, USD Million
8.3.2.2. By Application- Market Insights and Forecast 2022-2032, USD Million
8.4. France Praseodymium Oxide Market Statistics, 2022-2032F
8.4.1.Market Size & Growth Outlook
8.4.1.1. By Revenues in USD Million
8.4.2.Market Segmentation & Growth Outlook
8.4.2.1. By Type- Market Insights and Forecast 2022-2032, USD Million
8.4.2.2. By Application- Market Insights and Forecast 2022-2032, USD Million
8.5. UK Praseodymium Oxide Market Statistics, 2022-2032F
8.5.1.Market Size & Growth Outlook
8.5.1.1. By Revenues in USD Million
8.5.2.Market Segmentation & Growth Outlook
8.5.2.1. By Type- Market Insights and Forecast 2022-2032, USD Million
8.5.2.2. By Application- Market Insights and Forecast 2022-2032, USD Million
8.6. Italy Praseodymium Oxide Market Statistics, 2022-2032F
8.6.1.Market Size & Growth Outlook
8.6.1.1. By Revenues in USD Million
8.6.2.Market Segmentation & Growth Outlook
8.6.2.1. By Type- Market Insights and Forecast 2022-2032, USD Million
8.6.2.2. By Application- Market Insights and Forecast 2022-2032, USD Million
8.7. Netherlands Praseodymium Oxide Market Statistics, 2022-2032F
8.7.1.Market Size & Growth Outlook
8.7.1.1. By Revenues in USD Million
8.7.2.Market Segmentation & Growth Outlook
8.7.2.1. By Type- Market Insights and Forecast 2022-2032, USD Million
8.7.2.2. By Application- Market Insights and Forecast 2022-2032, USD Million
8.8. Belgium Praseodymium Oxide Market Statistics, 2022-2032F
8.8.1.Market Size & Growth Outlook
8.8.1.1. By Revenues in USD Million
8.8.2.Market Segmentation & Growth Outlook
8.8.2.1. By Type- Market Insights and Forecast 2022-2032, USD Million
8.8.2.2. By Application- Market Insights and Forecast 2022-2032, USD Million
8.9. Poland Praseodymium Oxide Market Statistics, 2022-2032F
8.9.1.Market Size & Growth Outlook
8.9.1.1. By Revenues in USD Million
8.9.2.Market Segmentation & Growth Outlook
8.9.2.1. By Type- Market Insights and Forecast 2022-2032, USD Million
8.9.2.2. By Application- Market Insights and Forecast 2022-2032, USD Million
8.10. Russia Praseodymium Oxide Market Statistics, 2022-2032F
8.10.1. Market Size & Growth Outlook
8.10.1.1. By Revenues in USD Million
8.10.2. Market Segmentation & Growth Outlook
8.10.2.1. By Type- Market Insights and Forecast 2022-2032, USD Million
8.10.2.2. By Application- Market Insights and Forecast 2022-2032, USD Million
9. Middle East & Africa Praseodymium Oxide Market Statistics, 2022-2032F
9.1. Market Size & Growth Outlook
9.1.1.By Revenues in USD Million
9.2. Market Segmentation & Growth Outlook
9.2.1.By Type- Market Insights and Forecast 2022-2032, USD Million
9.2.2.By Application- Market Insights and Forecast 2022-2032, USD Million
9.2.3.By Country
9.2.3.1. UAE
9.2.3.2. Israel
9.2.3.3. South Africa
9.2.3.4. Rest of Middle East & Africa
9.3. UAE Praseodymium Oxide Market Statistics, 2022-2032F
9.3.1.Market Size & Growth Outlook
9.3.1.1. By Revenues in USD Million
9.3.2.Market Segmentation & Growth Outlook
9.3.2.1. By Type- Market Insights and Forecast 2022-2032, USD Million
9.3.2.2. By Application- Market Insights and Forecast 2022-2032, USD Million
9.4. Israel Praseodymium Oxide Market Statistics, 2022-2032F
9.4.1.Market Size & Growth Outlook
9.4.1.1. By Revenues in USD Million
9.4.2.Market Segmentation & Growth Outlook
9.4.2.1. By Type- Market Insights and Forecast 2022-2032, USD Million
9.4.2.2. By Application- Market Insights and Forecast 2022-2032, USD Million
9.5. South Africa Praseodymium Oxide Market Statistics, 2022-2032F
9.5.1.Market Size & Growth Outlook
9.5.1.1. By Revenues in USD Million
9.5.2.Market Segmentation & Growth Outlook
9.5.2.1. By Type- Market Insights and Forecast 2022-2032, USD Million
9.5.2.2. By Application- Market Insights and Forecast 2022-2032, USD Million
10. Asia Pacific Praseodymium Oxide Market Statistics, 2022-2032F
10.1. Market Size & Growth Outlook
10.1.1. By Revenues in USD Million
10.2. Market Segmentation & Growth Outlook
10.2.1. By Type- Market Insights and Forecast 2022-2032, USD Million
10.2.2. By Application- Market Insights and Forecast 2022-2032, USD Million
10.2.3. By Country
10.2.3.1. China
10.2.3.2. Japan
10.2.3.3. South Korea
10.2.3.4. Taiwan
10.2.3.5. India
10.2.3.6. Australia
10.2.3.7. Singapore
10.2.3.8. Rest of Asia Pacific
10.3. China Praseodymium Oxide Market Statistics, 2022-2032F
10.3.1. Market Size & Growth Outlook
10.3.1.1. By Revenues in USD Million
10.3.2. Market Segmentation & Growth Outlook
10.3.2.1. By Type- Market Insights and Forecast 2022-2032, USD Million
10.3.2.2. By Application- Market Insights and Forecast 2022-2032, USD Million
10.4. Japan Praseodymium Oxide Market Statistics, 2022-2032F
10.4.1. Market Size & Growth Outlook
10.4.1.1. By Revenues in USD Million
10.4.2. Market Segmentation & Growth Outlook
10.4.2.1. By Type- Market Insights and Forecast 2022-2032, USD Million
10.4.2.2. By Application- Market Insights and Forecast 2022-2032, USD Million
10.5. South Korea Praseodymium Oxide Market Statistics, 2022-2032F
10.5.1. Market Size & Growth Outlook
10.5.1.1. By Revenues in USD Million
10.5.2. Market Segmentation & Growth Outlook
10.5.2.1. By Type- Market Insights and Forecast 2022-2032, USD Million
10.5.2.2. By Application- Market Insights and Forecast 2022-2032, USD Million
10.6. Taiwan Praseodymium Oxide Market Statistics, 2022-2032F
10.6.1. Market Size & Growth Outlook
10.6.1.1. By Revenues in USD Million
10.6.2. Market Segmentation & Growth Outlook
10.6.2.1. By Type- Market Insights and Forecast 2022-2032, USD Million
10.6.2.2. By Application- Market Insights and Forecast 2022-2032, USD Million
10.7. India Praseodymium Oxide Market Statistics, 2022-2032F
10.7.1. Market Size & Growth Outlook
10.7.1.1. By Revenues in USD Million
10.7.2. Market Segmentation & Growth Outlook
10.7.2.1. By Type- Market Insights and Forecast 2022-2032, USD Million
10.7.2.2. By Application- Market Insights and Forecast 2022-2032, USD Million
10.8. Australia Praseodymium Oxide Market Statistics, 2022-2032F
10.8.1. Market Size & Growth Outlook
10.8.1.1. By Revenues in USD Million
10.8.2. Market Segmentation & Growth Outlook
10.8.2.1. By Type- Market Insights and Forecast 2022-2032, USD Million
10.8.2.2. By Application- Market Insights and Forecast 2022-2032, USD Million
10.9. Singapore Praseodymium Oxide Market Statistics, 2022-2032F
10.9.1. Market Size & Growth Outlook
10.9.1.1. By Revenues in USD Million
10.9.2. Market Segmentation & Growth Outlook
10.9.2.1. By Type- Market Insights and Forecast 2022-2032, USD Million
10.9.2.2. By Application- Market Insights and Forecast 2022-2032, USD Million
11. Competitive Outlook
11.1. Company Profiles
11.1.1. China Northern Rare Earth Group
11.1.1.1. Business Description
11.1.1.2. Product Portfolio
11.1.1.3. Collaborations & Alliances
11.1.1.4. Recent Developments
11.1.1.5. Financial Details
11.1.1.6. Others
11.1.2. Lynas Corporation
11.1.2.1. Business Description
11.1.2.2. Product Portfolio
11.1.2.3. Collaborations & Alliances
11.1.2.4. Recent Developments
11.1.2.5. Financial Details
11.1.2.6. Others
11.1.3. Indian Rare Earths Limited (IREL)
11.1.3.1. Business Description
11.1.3.2. Product Portfolio
11.1.3.3. Collaborations & Alliances
11.1.3.4. Recent Developments
11.1.3.5. Financial Details
11.1.3.6. Others
11.1.4. Neo Performance Materials
11.1.4.1. Business Description
11.1.4.2. Product Portfolio
11.1.4.3. Collaborations & Alliances
11.1.4.4. Recent Developments
11.1.4.5. Financial Details
11.1.4.6. Others
11.1.5. Arafura Resources
11.1.5.1. Business Description
11.1.5.2. Product Portfolio
11.1.5.3. Collaborations & Alliances
11.1.5.4. Recent Developments
11.1.5.5. Financial Details
11.1.5.6. Others
11.1.6. Shenghe Resources Holding Co. Ltd.
11.1.6.1. Business Description
11.1.6.2. Product Portfolio
11.1.6.3. Collaborations & Alliances
11.1.6.4. Recent Developments
11.1.6.5. Financial Details
11.1.6.6. Others
11.1.7. China Minmetals Rare Earth Co. Ltd.
11.1.7.1. Business Description
11.1.7.2. Product Portfolio
11.1.7.3. Collaborations & Alliances
11.1.7.4. Recent Developments
11.1.7.5. Financial Details
11.1.7.6. Others
11.1.8. Baotou Steel Rare Earth Group
11.1.8.1. Business Description
11.1.8.2. Product Portfolio
11.1.8.3. Collaborations & Alliances
11.1.8.4. Recent Developments
11.1.8.5. Financial Details
11.1.8.6. Others
11.1.9. Xiamen Tungsten Co. Ltd.
11.1.9.1. Business Description
11.1.9.2. Product Portfolio
11.1.9.3. Collaborations & Alliances
11.1.9.4. Recent Developments
11.1.9.5. Financial Details
11.1.9.6. Others
11.1.10. Ganzhou Qiandong Rare Earth Group
11.1.10.1.Business Description
11.1.10.2.Product Portfolio
11.1.10.3.Collaborations & Alliances
11.1.10.4.Recent Developments
11.1.10.5.Financial Details
11.1.10.6.Others
11.1.11. MP Materials Corp.
11.1.11.1.Business Description
11.1.11.2.Product Portfolio
11.1.11.3.Collaborations & Alliances
11.1.11.4.Recent Developments
11.1.11.5.Financial Details
11.1.11.6.Others
11.1.12. China Southern Rare Earth Group
11.1.12.1.Business Description
11.1.12.2.Product Portfolio
11.1.12.3.Collaborations & Alliances
11.1.12.4.Recent Developments
11.1.12.5.Financial Details
11.1.12.6.Others
11.1.13. Avalon Advanced Materials Inc.
11.1.13.1.Business Description
11.1.13.2.Product Portfolio
11.1.13.3.Collaborations & Alliances
11.1.13.4.Recent Developments
11.1.13.5.Financial Details
11.1.13.6.Others
11.1.14. Great Western Minerals Group
11.1.14.1.Business Description
11.1.14.2.Product Portfolio
11.1.14.3.Collaborations & Alliances
11.1.14.4.Recent Developments
11.1.14.5.Financial Details
11.1.14.6.Others
11.1.15. Iluka Resources Limited
11.1.15.1.Business Description
11.1.15.2.Product Portfolio
11.1.15.3.Collaborations & Alliances
11.1.15.4.Recent Developments
11.1.15.5.Financial Details
11.1.15.6.Others
12. Disclaimer
| Segment | Sub-Segment |
|---|---|
| By Type |
|
| By Application |
|
| By Region |
|
Research Methodology
This study followed a structured approach comprising four key phases to assess the size and scope of the electro-oxidation market. The process began with thorough secondary research to collect data on the target market, related markets, and broader industry context. These findings, along with preliminary assumptions and estimates, were then validated through extensive primary research involving industry experts from across the value chain. To calculate the overall market size, both top-down and bottom-up methodologies were employed. Finally, market segmentation and data triangulation techniques were applied to refine and validate segment-level estimations.
Secondary Research
The secondary research phase involved gathering data from a wide range of credible and published sources. This step helped in identifying industry trends, defining market segmentation, and understanding the market landscape and value chain.
Sources consulted during this phase included:
- Company annual reports, investor presentations, and press releases
- Industry white papers and certified publications
- Trade directories and market-recognized databases
- Articles from authoritative authors and reputable journals
- Gold and silver standard websites
Secondary research was critical in mapping out the industry's value chain and monetary flow, identifying key market segments, understanding regional variations, and tracking significant industry developments.
Other key sources:
- Financial disclosures
- Industry associations and trade bodies
- News outlets and business magazines
- Academic journals and research studies
- Paid industry databases
Primary Research
To validate secondary data and gain deeper market insights, primary research was conducted with key stakeholders across both the supply and demand sides of the market.
On the demand side, participants included decision-makers and influencers from end-user industries—such as CIOs, CTOs, and CSOs—who provided first-hand perspectives on market needs, product usage, and future expectations.
On the supply side, interviews were conducted with manufacturers, industry associations, and institutional participants to gather insights into current offerings, product pipelines, and market challenges.
Primary interviews provided critical inputs such as:
- Market size and revenue data
- Product and service breakdowns
- Market forecasts
- Regional and application-specific trends
Stakeholders consulted included:
- Leading OEM and solution providers
- Channel and distribution partners
- End users across various applications
- Independent consultants and industry specialists
Market Size Estimation and Data Triangulation
- Identifying Key Market Participants (Secondary Research)
- Goal: To identify the major players or companies in the target market. This typically involves using publicly available data sources such as industry reports, market research publications, and financial statements of companies.
- Tools: Reports from firms like Gartner, Forrester, Euromonitor, Statista, IBISWorld, and others. Public financial statements, news articles, and press releases from top market players.
- Extracting Earnings of Key Market Participants
- Goal: To estimate the earnings generated from the product or service being analyzed. This step helps in understanding the revenue potential of each market player in a specific geography.
- Methods: Earnings data can be gathered from:
- Publicly available financial reports (for listed companies).
- Interviews and primary data sources from professionals, such as Directors, VPs, SVPs, etc. This is especially useful for understanding more nuanced, internal data that isn't publicly disclosed.
- Annual reports and investor presentations of key players.
- Data Collation and Development of a Relevant Data Model
- Goal: To collate inputs from both primary and secondary sources into a structured, data-driven model for market estimation. This model will incorporate key market KPIs and any independent variables relevant to the market.
- Key KPIs: These could include:
- Market size, growth rate, and demand drivers.
- Industry-specific metrics like market share, average revenue per customer (ARPC), or average deal size.
- External variables, such as economic growth rates, inflation rates, or commodity prices, that could affect the market.
- Data Modeling: Based on this data, the market forecasts are developed for the next 5 years. A combination of trend analysis, scenario modeling, and statistical regression might be used to generate projections.
- Scenario Analysis
- Goal: To test different assumptions and validate how sensitive the market is to changes in key variables (e.g., market demand, regulatory changes, technological disruptions).
- Types of Scenarios:
- Base Case: Based on current assumptions and historical data.
- Best-Case Scenario: Assuming favorable market conditions, regulatory environments, and technological advancements.
- Worst-Case Scenario: Accounting for adverse factors, such as economic downturns, stricter regulations, or unexpected disruptions.


