Global Lithium Fluoride Market Report: Trends, Growth and Forecast (2026-2032)
By Grade (Battery Grade, Pharmaceutical Grade, Industrial Grade), By Form (Powder, Granules), By Application (Batteries, Ceramics, Optical Glass, Pharmaceuticals), By End-Use Industry (Battery Manufacturing, Chemical, Pharmaceuticals, Electronics), By Region (North America, Europe, Asia Pacific) ... Read more
|
Major Players
|
Global Lithium Fluoride Market Statistics and Insights, 2026
- Market Size Statistics
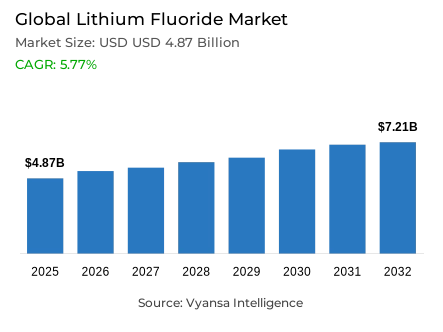
- Global lithium fluoride market is estimated at USD 4.87 billion in 2025.
- The market size is expected to grow to USD 7.21 billion by 2032.
- Market to register a CAGR of around 5.77% during 2026-32.
- Grade Shares
- Battery grade grabbed market share of 60%.
- Competition
- Global lithium fluoride market is currently being catered to by more than 25 companies.
- Top 5 companies acquired around 70% of the market share.
- FMC Corporation; Shenzhen Chengxin Lithium Group; Neo Lithium; Albemarle Corporation; Livent Corporation etc., are few of the top companies.
- Form
- Powder grabbed 65% of the market.
- Region
- Asia Pacific leads with a 50% share of the global market.
Global Lithium Fluoride Market Outlook
The Global lithium fluoride market is projected to grow to 4.87 billion in 2025 and is expected to grow to 7.21 billion in 2032 with a CAGR of approximately 5.77% in 2026-2032. The rapidily increasing global battery production is driving market growth because lithium fluoride is a key raw material in lithium hexafluorophosphate electrolytes found in almost all commercial lithium-ion batteries. In 2024, the global electric-vehicle battery demand was about 950 GWh, and battery cell production capacity was 3.3 TWh, which supports the long-term demand of high-purity lithium fluoride to facilitate performance, safety, and longevity in end-use applications. The growing use of lithium chemicals in transportation and energy storage systems guarantees a steady growth momentum.
The market is dominated by battery-grade lithium fluoride which consumes approximately 60% of the total market. Its purity, which is more than 99%, is essential in ensuring the stability of the electrolyte and improving the safety and cycle life of the battery. This grade has a premium position in the value chain, because end users are concerned with reliability and quality in the production of electrolytes. As China has approximately 82% of the world electrolyte processing capacity and India is becoming a regional producer to serve domestic battery programs, the supply side of the market is still concentrated but strategically aligned with the growing global battery ecosystem.
Powder form has about 65% of the market because it is more soluble and compatible with battery electrolyte production processes. The small size of the particles and the large surface area allow accurate dosing and consistent formulation of electrolytes, which enable high-throughput production and quality control. Other types, such as granules and pellets, serve niche markets in ceramics and specialty glass, but the market structure is dominated by battery-related demand, which supports powder as the industry standard.
Asia Pacific dominates the world market with approximately 50% of the market share due to the dominance of China in the production of lithium compounds and battery production. The region benefits from vertically integrated supply chains, robust domestic demand, and strategic fluorspar sourcing from Mongolia. India’s rapid capacity expansion under government-backed programs further supports regional growth. Collectively, these dynamics position Asia Pacific as the primary growth engine for the Global lithium fluoride market through 2032, ensuring sustained demand and long-term market stability.

Global Lithium Fluoride Market Growth Driver
Accelerating Battery Manufacturing Expansion Supporting Material Demand
Fast growth in the global production of batteries is driving self-reinforcing growth in the Global Lithium Fluoride Industry, as lithium fluoride continues to act as a crucial precursor for lithium hexafluorophosphate electrolytes in almost every lithium-ion battery produced across the world. Global demand for electric vehicle batteries in 2024 was around 950 GWh, reflecting a 25% increase on a year-over-year basis, with electric vehicles comprising more than 85% of overall consumption in the world. According to the International Energy Agency, the growth in the capacity for the production of batteries has already risen by 30% in 2024 to 3.3 TWh and is set to register much stronger use levels in the coming periods, acting as a direct trigger for amplified demand visibility for lithium fluoride market players.
Lithium use grew to nearly 220,000 tons in 2024 globally, a 29% rise from 2023, based on the U.S. Geological Survey’s Mineral Commodity Summaries 2025. The growing need for lithium chemicals, fueled by the rising use of electricity in the transport sector and stationary energy storage systems, propels the demand for lithium. The tendency for lithium-fluoride chemical use to match advancements in the production of batteries, influencing consumers to opt for high-purity lithium-fluoride chemical use, ensures that the demand for lithium is influenced by the growing use of batteries.
Global Lithium Fluoride Market Challenge
Structural Constraints in Fluorspar Availability Affecting Supply Stability
The availability of fluorspar is associated with supply-side restrictions that pose a major limitation to the Global lithium fluoride market since fluorspar is the key upstream feedstock in the production of lithium fluoride. China, the world leader in the supply of fluorspar, has undergone a long-term shrinkage of its mining activities, and currently, the number of active mines has reduced to approximately 650 by the close of 2023 compared to over 1,200 ten years ago. According to the Fluorspar 2025 assessment by the U.S. Geological Survey, the domestic supply was disrupted temporarily in January-August 2024 by nationwide safety inspections and environmental remediation programmes, which restricted feedstock flexibility and limited domestic supply.
The world output of fluorspar was essentially unchanged at about 9.5 million tonnes in 2024, slightly higher than in 2023, even as downstream battery and chemical industries increased their demand. This stagnation highlights structural rigidity in the supply chain, in which geographic concentration and regulatory pressures limit quick capacity growth. To the lithium fluoride manufacturers, limited supply of fluorspar increases the procurement risk, cost volatility, and operational uncertainty. These upstream constraints are independent of the strength of downstream battery demand, and create a long-term bottleneck that tempers the rate of total market growth.
Unlock Market Intelligence
Explore the market potential with our data-driven report
Global Lithium Fluoride Market Trend
Electrolyte Optimization Linked to LFP Chemistry Adoption
The current changes in battery chemistry are transforming the demand trends in the Global lithium fluoride market, especially with the fast uptake of lithium iron phosphate technology. In 2024, LFP batteries represented about half of the world electric-vehicle battery output and almost three-quarters of battery demand in China. This chemistry shift puts increased focus on electrolyte optimisation, with high-purity lithium fluoride additives being employed to improve thermal stability, cycle life, and overall safety performance. Battery producers are also working on the improvement of electrolyte formulations to address the durability and cost-effectiveness demands of large-scale LFP implementation.
This trend is further supported by parallel increases in stationary energy storage, where the global installed capacity is now over 90 GWh, nearly twice the levels of 2022. Storage applications, such as long-duration cycling and thermal resilience, drive the development of new electrolyte architecture based on lithium fluoride-derived compounds. Academic and industrial laboratories are still working on next-generation battery designs that rely on accurate electrolyte chemistry. This continued emphasis on performance optimisation guarantees steady demand of specialty-grade lithium fluoride on the changing battery platforms.
Global Lithium Fluoride Market Opportunity
Recycling Ecosystem Development Enhancing Long-Term Market Resilience
The development of battery recycling facilities is a strategic opportunity to the Global lithium fluoride market as it allows secondary lithium sources in the long term. The existing recycling technologies show the lithium recovery rates between 70% and 95%, depending on the process configuration and efficiency. This trend is being strengthened by regulatory frameworks, such as the Battery Regulation (EU 2023/1542) that requires lithium recovery rates of 50% by 2027 and 80% by 2031. These policies initiate investment in recycling capacity and process innovation in large manufacturing economies.
According to the International Energy Agency, recycling will take about a decade to significantly decrease dependence on primary mineral mining, which means that primary lithium fluoride production will continue to prevail during the 2026-2032 period. Nevertheless, recycling may eventually provide a significant portion of lithium demand, potentially up to 60% by mid-century in high-recovery conditions. This progressive incorporation of secondary supply improves the stability of the market in the long run, reduces the risk of raw materials, and promotes sustainable growth patterns.
Global Lithium Fluoride Market Regional Analysis

By Region
- North America
- Europe
- Asia Pacific
Asia Pacific accounts for about 50% of global production and consumption in the Global lithium fluoride market, underpinned by China’s comprehensive control over lithium compound value chains. The U.S. Energy Information Administration reports that China processed roughly 82% of global electrolytes in 2023 and dominates battery manufacturing, holding close to 80% of global cell production capacity. The country also represents nearly 59% of global electric vehicle battery demand, directly anchoring regional lithium fluoride consumption growth.
Within the region, India stands out as the fastest-growing market, supported by government-backed Production Linked Incentive programs targeting 50 GWh of domestic battery capacity. Mongolia’s emergence as China’s leading fluorspar supplier, capturing over half of import volumes in 2024, highlights ongoing regional supply chain realignment. Limited LiPF₆ production capabilities outside China further underscore Asia-Pacific’s strategic centrality. Collectively, these dynamics position the region as the primary growth engine for lithium fluoride globally.
Unlock Market Intelligence
Explore the market potential with our data-driven report
Global Lithium Fluoride Market Segmentation Analysis
By Grade
- Battery Grade
- Pharmaceutical Grade
- Industrial Grade
Battery-grade material represents the largest share of the Global lithium fluoride market, accounting for approximately 60% of total consumption, reflecting the dominance of battery electrolyte applications. This grade requires purity levels above 99.0% to meet stringent performance and safety standards in lithium-ion battery systems. Such specifications significantly exceed those of industrial-grade material, positioning battery-grade lithium fluoride as a premium input within the overall value chain. Higher pricing and qualification requirements further reinforce its leading share, as end users prioritize reliability and consistency in electrolyte production.
China maintains leadership in battery-grade lithium fluoride production through vertically integrated supply chains linking fluorspar sourcing, chemical synthesis, and direct battery manufacturer engagement. The International Energy Agency highlights that China controls about 82% of global electrolyte processing capacity. While emerging producers in India are expanding regional output to support domestic battery manufacturing, global supply remains heavily concentrated. The sustained growth of electric mobility and energy storage ensures that battery-grade lithium fluoride continues to anchor overall market structure.

By Form
- Powder
- Granules
Powder form holds a dominant 65% share within the Global lithium fluoride market, driven by its superior compatibility with battery electrolyte manufacturing processes. Fine particle size and high surface area enable rapid dissolution in organic carbonate solvents, supporting precise dosing and consistent electrolyte composition. These characteristics enhance quality control, improve production yields, and align with standardized processing requirements across large-scale battery manufacturing facilities. As battery output scales, powder specifications increasingly represent the default choice for electrolyte producers.
Other physical forms such as granules and pellets retain niche usage in ceramics and specialty glass applications, where alternative handling or flow properties are preferred. However, battery-related demand overwhelmingly dictates market structure, reinforcing powder form dominance. Standardization among leading electrolyte producers, particularly in China, further entrenches powder lithium fluoride as the industry benchmark. This form factor’s alignment with high-throughput, precision-driven manufacturing environments ensures its continued leadership as battery production volumes expand.
Market Players in Global Lithium Fluoride Market
These market players maintain a significant presence in the Global lithium fluoride market sector and contribute to its ongoing evolution.
- FMC Corporation
- Shenzhen Chengxin Lithium Group
- Neo Lithium
- Albemarle Corporation
- Livent Corporation
- Ganfeng Lithium
- Tianqi Lithium
- SQM
- Posco
- Jiangxi Ganfeng Lithium Co. Ltd.
- Lithium Americas Corp.
- Sichuan Yahua Industrial Group
- China Lithium Battery Materials Co.Ltd.
- Sichuan Tianqi Lithium Industries
- Lithium Energy Japan
Market News & Updates
- Posco, 2025:
Posco announced in November 2025 a transformational strategic partnership investing KRW 1.1 trillion (approximately $817 million USD) to acquire a 30% equity stake in Mineral Resources Limited's Australian lithium operations, encompassing the Wodgina and Mt. Marion spodumene mines. The partnership provides Posco immediate access to approximately 270,000 tonnes of spodumene concentrate annually, equivalent to approximately 37,000 tonnes of lithium hydroxide equivalent production capacity through downstream processing facilities, sufficient to support battery manufacturing for approximately 860,000 electric vehicles annually. Transaction completion is expected in H1 2026 subject to Foreign Investment Review Board regulatory approval, enabling Posco to produce premium battery-grade lithium hydroxide and lithium fluoride products for high-nickel EV battery applications across Asian markets while reducing exposure to volatile spot market pricing for critical battery materials through vertical integration and long-term supply security.
- Albemarle Corporation, 2025:
Albemarle Corporation entered a landmark offtake and prepayment agreement with Power Metals Corp. in December 2025, securing cesium concentrate supply from the Case Lake Cesium Project in Ontario, Canada, with production targeted for late 2026. The agreement provides Power Metals with up to C$5 million in staged prepayments tied to permitting milestones, supporting the development of one of the first new cesium operations to enter production in decades. Albemarle committed to purchasing cesium carbonate output from the simplified ore processing operation, with Case Lake's grade and location supporting integrated North American supply chain development. Additionally, Albemarle completed the sale of a controlling stake in its Ketjen Corp. refining catalyst solutions business to KPS Capital Partners LP in October 2025, generating approximately $660 million in proceeds to reduce debt and support reinvestment in its core lithium and specialty chemicals portfolio, further streamlining the company's focus on lithium fluoride, hydroxide, and advanced battery material production.
Frequently Asked Questions
Related Report
1. Market Segmentation
1.1. Research Scope
1.2. Research Methodology
1.3. Definitions and Assumptions
2. Executive Summary
3. Global Lithium Fluoride Market Policies, Regulations, and Standards
4. Global Lithium Fluoride Market Dynamics
4.1. Growth Factors
4.2. Challenges
4.3. Trends
4.4. Opportunities
5. Global Lithium Fluoride Market Statistics, 2022-2032F
5.1. Market Size & Growth Outlook
5.1.1. By Revenues in USD Million
5.2. Market Segmentation & Growth Outlook
5.2.1. By Grade
5.2.1.1. Battery Grade- Market Insights and Forecast 2022-2032, USD Million
5.2.1.2. Pharmaceutical Grade- Market Insights and Forecast 2022-2032, USD Million
5.2.1.3. Industrial Grade- Market Insights and Forecast 2022-2032, USD Million
5.2.2. By Form
5.2.2.1. Powder- Market Insights and Forecast 2022-2032, USD Million
5.2.2.2. Granules- Market Insights and Forecast 2022-2032, USD Million
5.2.3. By Application
5.2.3.1. Batteries- Market Insights and Forecast 2022-2032, USD Million
5.2.3.2. Ceramics- Market Insights and Forecast 2022-2032, USD Million
5.2.3.3. Optical Glass- Market Insights and Forecast 2022-2032, USD Million
5.2.3.4. Pharmaceuticals- Market Insights and Forecast 2022-2032, USD Million
5.2.4. By End-Use Industry
5.2.4.1. Battery Manufacturing- Market Insights and Forecast 2022-2032, USD Million
5.2.4.2. Chemical- Market Insights and Forecast 2022-2032, USD Million
5.2.4.3. Pharmaceuticals- Market Insights and Forecast 2022-2032, USD Million
5.2.4.4. Electronics- Market Insights and Forecast 2022-2032, USD Million
5.2.5. By Region
5.2.5.1. North America
5.2.5.2. Europe
5.2.5.3. Asia Pacific
5.2.6. By Competitors
5.2.6.1. Competition Characteristics
5.2.6.2. Market Share & Analysis
6. North America Lithium Fluoride Market Statistics, 2022-2032F
6.1. Market Size & Growth Outlook
6.1.1. By Revenues in USD Million
6.2. Market Segmentation & Growth Outlook
6.2.1. By Grade- Market Insights and Forecast 2022-2032, USD Million
6.2.2. By Form- Market Insights and Forecast 2022-2032, USD Million
6.2.3. By Application- Market Insights and Forecast 2022-2032, USD Million
6.2.4. By End-Use Industry- Market Insights and Forecast 2022-2032, USD Million
6.2.5. By Country
6.2.5.1. North America: US
6.2.5.2. Canada
6.2.5.3. Mexico
6.2.5.4. Rest of North America
6.3. North America: US Lithium Fluoride Market Statistics, 2022-2032F
6.3.1. Market Size & Growth Outlook
6.3.1.1. By Revenues in USD Million
6.3.2. Market Segmentation & Growth Outlook
6.3.2.1. By Grade- Market Insights and Forecast 2022-2032, USD Million
6.3.2.2. By Form- Market Insights and Forecast 2022-2032, USD Million
6.4. Canada Lithium Fluoride Market Statistics, 2022-2032F
6.4.1. Market Size & Growth Outlook
6.4.1.1. By Revenues in USD Million
6.4.2. Market Segmentation & Growth Outlook
6.4.2.1. By Grade- Market Insights and Forecast 2022-2032, USD Million
6.4.2.2. By Form- Market Insights and Forecast 2022-2032, USD Million
6.5. Mexico Lithium Fluoride Market Statistics, 2022-2032F
6.5.1. Market Size & Growth Outlook
6.5.1.1. By Revenues in USD Million
6.5.2. Market Segmentation & Growth Outlook
6.5.2.1. By Grade- Market Insights and Forecast 2022-2032, USD Million
6.5.2.2. By Form- Market Insights and Forecast 2022-2032, USD Million
7. Europe Lithium Fluoride Market Statistics, 2022-2032F
7.1. Market Size & Growth Outlook
7.1.1. By Revenues in USD Million
7.2. Market Segmentation & Growth Outlook
7.2.1. By Grade- Market Insights and Forecast 2022-2032, USD Million
7.2.2. By Form- Market Insights and Forecast 2022-2032, USD Million
7.2.3. By Application- Market Insights and Forecast 2022-2032, USD Million
7.2.4. By End-Use Industry- Market Insights and Forecast 2022-2032, USD Million
7.2.5. By Country
7.2.5.1. Europe: Germany
7.2.5.2. France
7.2.5.3. UK
7.2.5.4. Italy
7.2.5.5. Spain
7.2.5.6. Netherlands
7.2.5.7. Belgium
7.2.5.8. Russia
7.2.5.9. Poland
7.2.5.10. Turkey
7.2.5.11. Rest of Europe
7.3. Europe: Germany Lithium Fluoride Market Statistics, 2022-2032F
7.3.1. Market Size & Growth Outlook
7.3.1.1. By Revenues in USD Million
7.3.2. Market Segmentation & Growth Outlook
7.3.2.1. By Grade- Market Insights and Forecast 2022-2032, USD Million
7.3.2.2. By Form- Market Insights and Forecast 2022-2032, USD Million
7.4. France Lithium Fluoride Market Statistics, 2022-2032F
7.4.1. Market Size & Growth Outlook
7.4.1.1. By Revenues in USD Million
7.4.2. Market Segmentation & Growth Outlook
7.4.2.1. By Grade- Market Insights and Forecast 2022-2032, USD Million
7.4.2.2. By Form- Market Insights and Forecast 2022-2032, USD Million
7.5. UK Lithium Fluoride Market Statistics, 2022-2032F
7.5.1. Market Size & Growth Outlook
7.5.1.1. By Revenues in USD Million
7.5.2. Market Segmentation & Growth Outlook
7.5.2.1. By Grade- Market Insights and Forecast 2022-2032, USD Million
7.5.2.2. By Form- Market Insights and Forecast 2022-2032, USD Million
7.6. Italy Lithium Fluoride Market Statistics, 2022-2032F
7.6.1. Market Size & Growth Outlook
7.6.1.1. By Revenues in USD Million
7.6.2. Market Segmentation & Growth Outlook
7.6.2.1. By Grade- Market Insights and Forecast 2022-2032, USD Million
7.6.2.2. By Form- Market Insights and Forecast 2022-2032, USD Million
7.7. Spain Lithium Fluoride Market Statistics, 2022-2032F
7.7.1. Market Size & Growth Outlook
7.7.1.1. By Revenues in USD Million
7.7.2. Market Segmentation & Growth Outlook
7.7.2.1. By Grade- Market Insights and Forecast 2022-2032, USD Million
7.7.2.2. By Form- Market Insights and Forecast 2022-2032, USD Million
7.8. Netherlands Lithium Fluoride Market Statistics, 2022-2032F
7.8.1. Market Size & Growth Outlook
7.8.1.1. By Revenues in USD Million
7.8.2. Market Segmentation & Growth Outlook
7.8.2.1. By Grade- Market Insights and Forecast 2022-2032, USD Million
7.8.2.2. By Form- Market Insights and Forecast 2022-2032, USD Million
7.9. Belgium Lithium Fluoride Market Statistics, 2022-2032F
7.9.1. Market Size & Growth Outlook
7.9.1.1. By Revenues in USD Million
7.9.2. Market Segmentation & Growth Outlook
7.9.2.1. By Grade- Market Insights and Forecast 2022-2032, USD Million
7.9.2.2. By Form- Market Insights and Forecast 2022-2032, USD Million
7.10.Russia Lithium Fluoride Market Statistics, 2022-2032F
7.10.1. Market Size & Growth Outlook
7.10.1.1. By Revenues in USD Million
7.10.2. Market Segmentation & Growth Outlook
7.10.2.1. By Grade- Market Insights and Forecast 2022-2032, USD Million
7.10.2.2. By Form- Market Insights and Forecast 2022-2032, USD Million
7.11.Poland Lithium Fluoride Market Statistics, 2022-2032F
7.11.1. Market Size & Growth Outlook
7.11.1.1. By Revenues in USD Million
7.11.2. Market Segmentation & Growth Outlook
7.11.2.1. By Grade- Market Insights and Forecast 2022-2032, USD Million
7.11.2.2. By Form- Market Insights and Forecast 2022-2032, USD Million
7.12.Turkey Lithium Fluoride Market Statistics, 2022-2032F
7.12.1. Market Size & Growth Outlook
7.12.1.1. By Revenues in USD Million
7.12.2. Market Segmentation & Growth Outlook
7.12.2.1. By Grade- Market Insights and Forecast 2022-2032, USD Million
7.12.2.2. By Form- Market Insights and Forecast 2022-2032, USD Million
8. Asia Pacific Lithium Fluoride Market Statistics, 2022-2032F
8.1. Market Size & Growth Outlook
8.1.1. By Revenues in USD Million
8.2. Market Segmentation & Growth Outlook
8.2.1. By Grade- Market Insights and Forecast 2022-2032, USD Million
8.2.2. By Form- Market Insights and Forecast 2022-2032, USD Million
8.2.3. By Application- Market Insights and Forecast 2022-2032, USD Million
8.2.4. By End-Use Industry- Market Insights and Forecast 2022-2032, USD Million
8.2.5. By Country
8.2.5.1. Asia Pacific: China
8.2.5.2. India
8.2.5.3. Japan
8.2.5.4. South Korea
8.2.5.5. Australia
8.2.5.6. Thailand
8.2.5.7. Rest of Asia Pacific
8.3. Asia Pacific: China Lithium Fluoride Market Statistics, 2022-2032F
8.3.1. Market Size & Growth Outlook
8.3.1.1. By Revenues in USD Million
8.3.2. Market Segmentation & Growth Outlook
8.3.2.1. By Grade- Market Insights and Forecast 2022-2032, USD Million
8.3.2.2. By Form- Market Insights and Forecast 2022-2032, USD Million
8.4. India Lithium Fluoride Market Statistics, 2022-2032F
8.4.1. Market Size & Growth Outlook
8.4.1.1. By Revenues in USD Million
8.4.2. Market Segmentation & Growth Outlook
8.4.2.1. By Grade- Market Insights and Forecast 2022-2032, USD Million
8.4.2.2. By Form- Market Insights and Forecast 2022-2032, USD Million
8.5. Japan Lithium Fluoride Market Statistics, 2022-2032F
8.5.1. Market Size & Growth Outlook
8.5.1.1. By Revenues in USD Million
8.5.2. Market Segmentation & Growth Outlook
8.5.2.1. By Grade- Market Insights and Forecast 2022-2032, USD Million
8.5.2.2. By Form- Market Insights and Forecast 2022-2032, USD Million
8.6. South Korea Lithium Fluoride Market Statistics, 2022-2032F
8.6.1. Market Size & Growth Outlook
8.6.1.1. By Revenues in USD Million
8.6.2. Market Segmentation & Growth Outlook
8.6.2.1. By Grade- Market Insights and Forecast 2022-2032, USD Million
8.6.2.2. By Form- Market Insights and Forecast 2022-2032, USD Million
8.7. Australia Lithium Fluoride Market Statistics, 2022-2032F
8.7.1. Market Size & Growth Outlook
8.7.1.1. By Revenues in USD Million
8.7.2. Market Segmentation & Growth Outlook
8.7.2.1. By Grade- Market Insights and Forecast 2022-2032, USD Million
8.7.2.2. By Form- Market Insights and Forecast 2022-2032, USD Million
8.8. Thailand Lithium Fluoride Market Statistics, 2022-2032F
8.8.1. Market Size & Growth Outlook
8.8.1.1. By Revenues in USD Million
8.8.2. Market Segmentation & Growth Outlook
8.8.2.1. By Grade- Market Insights and Forecast 2022-2032, USD Million
8.8.2.2. By Form- Market Insights and Forecast 2022-2032, USD Million
9. Competitive Outlook
9.1. Company Profiles
9.1.1. Albemarle Corporation
9.1.1.1. Business Description
9.1.1.2. Product Portfolio
9.1.1.3. Collaborations & Alliances
9.1.1.4. Recent Developments
9.1.1.5. Financial Details
9.1.1.6. Others
9.1.2. Livent Corporation
9.1.2.1. Business Description
9.1.2.2. Product Portfolio
9.1.2.3. Collaborations & Alliances
9.1.2.4. Recent Developments
9.1.2.5. Financial Details
9.1.2.6. Others
9.1.3. Ganfeng Lithium
9.1.3.1. Business Description
9.1.3.2. Product Portfolio
9.1.3.3. Collaborations & Alliances
9.1.3.4. Recent Developments
9.1.3.5. Financial Details
9.1.3.6. Others
9.1.4. Tianqi Lithium
9.1.4.1. Business Description
9.1.4.2. Product Portfolio
9.1.4.3. Collaborations & Alliances
9.1.4.4. Recent Developments
9.1.4.5. Financial Details
9.1.4.6. Others
9.1.5. SQM
9.1.5.1. Business Description
9.1.5.2. Product Portfolio
9.1.5.3. Collaborations & Alliances
9.1.5.4. Recent Developments
9.1.5.5. Financial Details
9.1.5.6. Others
9.1.6. FMC Corporation
9.1.6.1. Business Description
9.1.6.2. Product Portfolio
9.1.6.3. Collaborations & Alliances
9.1.6.4. Recent Developments
9.1.6.5. Financial Details
9.1.6.6. Others
9.1.7. Shenzhen Chengxin Lithium Group
9.1.7.1. Business Description
9.1.7.2. Product Portfolio
9.1.7.3. Collaborations & Alliances
9.1.7.4. Recent Developments
9.1.7.5. Financial Details
9.1.7.6. Others
9.1.8. Neo Lithium
9.1.8.1. Business Description
9.1.8.2. Product Portfolio
9.1.8.3. Collaborations & Alliances
9.1.8.4. Recent Developments
9.1.8.5. Financial Details
9.1.8.6. Others
9.1.9. Posco
9.1.9.1. Business Description
9.1.9.2. Product Portfolio
9.1.9.3. Collaborations & Alliances
9.1.9.4. Recent Developments
9.1.9.5. Financial Details
9.1.9.6. Others
9.1.10. Jiangxi Ganfeng Lithium Co. Ltd.
9.1.10.1. Business Description
9.1.10.2. Product Portfolio
9.1.10.3. Collaborations & Alliances
9.1.10.4. Recent Developments
9.1.10.5. Financial Details
9.1.10.6. Others
9.1.11. Lithium Americas Corp.
9.1.11.1. Business Description
9.1.11.2. Product Portfolio
9.1.11.3. Collaborations & Alliances
9.1.11.4. Recent Developments
9.1.11.5. Financial Details
9.1.11.6. Others
9.1.12. Sichuan Yahua Industrial Group
9.1.12.1. Business Description
9.1.12.2. Product Portfolio
9.1.12.3. Collaborations & Alliances
9.1.12.4. Recent Developments
9.1.12.5. Financial Details
9.1.12.6. Others
9.1.13. China Lithium Battery Materials Co. Ltd.
9.1.13.1. Business Description
9.1.13.2. Product Portfolio
9.1.13.3. Collaborations & Alliances
9.1.13.4. Recent Developments
9.1.13.5. Financial Details
9.1.13.6. Others
9.1.14. Sichuan Tianqi Lithium Industries
9.1.14.1. Business Description
9.1.14.2. Product Portfolio
9.1.14.3. Collaborations & Alliances
9.1.14.4. Recent Developments
9.1.14.5. Financial Details
9.1.14.6. Others
9.1.15. Lithium Energy Japan
9.1.15.1. Business Description
9.1.15.2. Product Portfolio
9.1.15.3. Collaborations & Alliances
9.1.15.4. Recent Developments
9.1.15.5. Financial Details
9.1.15.6. Others
10. Disclaimer
| Segment | Sub-Segment |
|---|---|
| By Grade |
|
| By Form |
|
| By Application |
|
| By End-Use Industry |
|
| By Region |
|
Research Methodology
This study followed a structured approach comprising four key phases to assess the size and scope of the electro-oxidation market. The process began with thorough secondary research to collect data on the target market, related markets, and broader industry context. These findings, along with preliminary assumptions and estimates, were then validated through extensive primary research involving industry experts from across the value chain. To calculate the overall market size, both top-down and bottom-up methodologies were employed. Finally, market segmentation and data triangulation techniques were applied to refine and validate segment-level estimations.
Secondary Research
The secondary research phase involved gathering data from a wide range of credible and published sources. This step helped in identifying industry trends, defining market segmentation, and understanding the market landscape and value chain.
Sources consulted during this phase included:
- Company annual reports, investor presentations, and press releases
- Industry white papers and certified publications
- Trade directories and market-recognized databases
- Articles from authoritative authors and reputable journals
- Gold and silver standard websites
Secondary research was critical in mapping out the industry's value chain and monetary flow, identifying key market segments, understanding regional variations, and tracking significant industry developments.
Other key sources:
- Financial disclosures
- Industry associations and trade bodies
- News outlets and business magazines
- Academic journals and research studies
- Paid industry databases
Primary Research
To validate secondary data and gain deeper market insights, primary research was conducted with key stakeholders across both the supply and demand sides of the market.
On the demand side, participants included decision-makers and influencers from end-user industries—such as CIOs, CTOs, and CSOs—who provided first-hand perspectives on market needs, product usage, and future expectations.
On the supply side, interviews were conducted with manufacturers, industry associations, and institutional participants to gather insights into current offerings, product pipelines, and market challenges.
Primary interviews provided critical inputs such as:
- Market size and revenue data
- Product and service breakdowns
- Market forecasts
- Regional and application-specific trends
Stakeholders consulted included:
- Leading OEM and solution providers
- Channel and distribution partners
- End users across various applications
- Independent consultants and industry specialists
Market Size Estimation and Data Triangulation
- Identifying Key Market Participants (Secondary Research)
- Goal: To identify the major players or companies in the target market. This typically involves using publicly available data sources such as industry reports, market research publications, and financial statements of companies.
- Tools: Reports from firms like Gartner, Forrester, Euromonitor, Statista, IBISWorld, and others. Public financial statements, news articles, and press releases from top market players.
- Extracting Earnings of Key Market Participants
- Goal: To estimate the earnings generated from the product or service being analyzed. This step helps in understanding the revenue potential of each market player in a specific geography.
- Methods: Earnings data can be gathered from:
- Publicly available financial reports (for listed companies).
- Interviews and primary data sources from professionals, such as Directors, VPs, SVPs, etc. This is especially useful for understanding more nuanced, internal data that isn't publicly disclosed.
- Annual reports and investor presentations of key players.
- Data Collation and Development of a Relevant Data Model
- Goal: To collate inputs from both primary and secondary sources into a structured, data-driven model for market estimation. This model will incorporate key market KPIs and any independent variables relevant to the market.
- Key KPIs: These could include:
- Market size, growth rate, and demand drivers.
- Industry-specific metrics like market share, average revenue per customer (ARPC), or average deal size.
- External variables, such as economic growth rates, inflation rates, or commodity prices, that could affect the market.
- Data Modeling: Based on this data, the market forecasts are developed for the next 5 years. A combination of trend analysis, scenario modeling, and statistical regression might be used to generate projections.
- Scenario Analysis
- Goal: To test different assumptions and validate how sensitive the market is to changes in key variables (e.g., market demand, regulatory changes, technological disruptions).
- Types of Scenarios:
- Base Case: Based on current assumptions and historical data.
- Best-Case Scenario: Assuming favorable market conditions, regulatory environments, and technological advancements.
- Worst-Case Scenario: Accounting for adverse factors, such as economic downturns, stricter regulations, or unexpected disruptions.


