Global Lithium Aluminum Hydride Market Report: Trends, Growth and Forecast (2026-2032)
By Grade (Industrial Grade, Battery Grade), By Application (Pharmaceuticals, Battery Materials, Organic Synthesis), By End-Use Industry (Pharmaceuticals, Battery Manufacturing, Chemical Synthesis), By Region (North America, Europe, Asia Pacific) ... Read more
|
Major Players
|
Global Lithium Aluminum Hydride Market Statistics and Insights, 2026
- Market Size Statistics
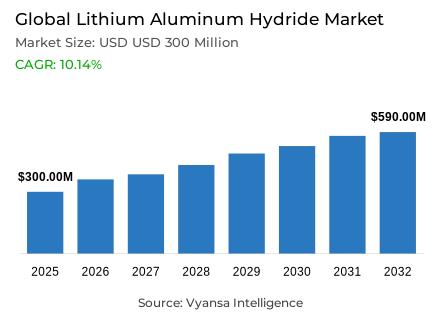
- Global lithium aluminum hydride market is estimated at USD 300 million in 2025.
- The market size is expected to grow to USD 590 million by 2032.
- Market to register a CAGR of around 10.14% during 2026-32.
- Grade Shares
- Industrial grade grabbed market share of 60%.
- Competition
- Global lithium aluminum hydride market is currently being catered to by more than 30 companies.
- Top 5 companies acquired around 70% of the market share.
- Gelest Inc.; Evonik Industries; Johnson Matthey; Sigma-Aldrich (Merck); Albemarle Corporation etc., are few of the top companies.
- Application
- Organic synthesis grabbed 55% of the market.
- Region
- Asia Pacific leads with a 50% share of the global market.
Global Lithium Aluminum Hydride Market Outlook
The Global Lithium Aluminum Hydride Market 2026–2032 is estimated to be USD 300 million in 2025 and is expected to grow to about USD 590 million by 2032 with a compound annual growth rate of about 10.14% over the forecast period. Concentration of demand is still apparent in grades, applications, and regions. The industrial-grade products occupy 60% of the total market share, as they are widely used in large-scale pharmaceutical and specialty chemical production where reliability and cost-effectiveness are the most important factors. The Asia Pacific region is the regional leader with 50% of the world demand, which is backed by the strong pharmaceutical manufacturing base and growing clean-energy infrastructure.
The growth of the market is closely connected with the increasing implementation of hydrogen on the global level. In 2024, the global hydrogen demand was estimated at 100 million tonnes, with low-emission hydrogen production rising by 10% per year and clean hydrogen investment rising by 60%. Projects and public funding structures that have finalized investment decisions are transforming policy promises into physical infrastructure. This shift solidifies the long-term demand confidence of advanced hydrogen-handling and reaction materials, making lithium aluminum hydride a key element in the production, storage, and downstream processing systems.
Market conditions are still influenced by supply-side dynamics. The rapid development of clean-energy technologies has led to a sudden increase in the demand of lithium, and the development of mining and refining capacity is limited. Lithium supply and processing concentration increases chemical producers exposure to price volatility and procurement risk. These structural forces have a direct impact on the production economics of lithium aluminum hydride producers, particularly as the demand rises simultaneously in batteries, hydrogen systems, and industrial decarbonization pathways.
The applications are still needed in the pharmaceutical chemistry field where organic synthesis is 55% of the total market share. Multi-step drug production relies on controlled reduction reactions, which maintain a steady supply of high-reliability reagents. The continued investment in pharmaceutical capacity in the Asia Pacific region, and the growing hydrogen-based industrial uses, offers a diversified and resilient demand base. This healthcare-clean-energy end-user balance helps to achieve stable long-term growth up to 2032.

Global Lithium Aluminum Hydride Market Growth Driver
Expanding Hydrogen Infrastructure Creating Structural Demand Pull
The use of hydrogen is gaining momentum across the globe with governments and industry building up low-emission energy systems, which in turn is boosting the need to develop high-quality hydrogen-handling materials. According to the International Energy Agency, the world hydrogen demand was estimated at 100 million tonnes in 2024, and the low-emission hydrogen production increased by 10% per year and clean-hydrogen investment increased by 60% per year. Policy intentions are being converted into physical infrastructure through public funding frameworks and projects that have progressed to final investment decision status and support long-term demand certainty of hydrogen-related chemical systems utilized in production, storage, and downstream processing.
The IEA Global Hydrogen Review 2025 also suggests that by 2030 the potential of low-emission hydrogen produced by committed projects alone will be 4.2 million tonnes per year, compared to the announced potential of much higher amounts. This scale-up requires chemically stable and high-efficiency materials that enable safe hydrogen transport, controlled reactions, and efficient synthesis. With the growth in the number of electrolyser installations, end users in the energy and industrial sectors are increasingly relying on specialised hydride compounds to facilitate hydrogen logistics and integration, and thus lithium aluminum hydride is embedded in the overall clean-energy infrastructure development.
Global Lithium Aluminum Hydride Market Challenge
Lithium Feedstock Concentration Limiting Supply Chain Flexibility
Lithium supply remains a structural limitation to the lithium aluminum hydride manufacturers, with the clean-energy demand increasing faster than the mining capacity. According to the International Energy Agency, the world is consuming 30% more lithium in 2023, and announced mining and refining projects only meet about half of the estimated global demand. World Bank estimates that the demand of lithium will increase by approximately 15% each year until 2035 in energy-transition conditions, continuing to place consistent pressure on lithium-dependent chemical producers and increasing the procurement risk.
This imbalance is aggravated by supply concentration. According to the IEA, the three major producing nations dominate the increase in refined lithium supply, and nearly 95% of battery-grade synthetic graphite refining is controlled by China. This geographic concentration subjects chemical producers to pricing volatility, geopolitical risk, and logistic disruption. In the case of lithium aluminum hydride producers, limited access to feedstock has a direct impact on the economics of production and reliability of delivery, particularly with the increased demand of lithium in batteries, hydrogen infrastructure, and industrial decarbonization routes around the world.
Unlock Market Intelligence
Explore the market potential with our data-driven report
Global Lithium Aluminum Hydride Market Trend
Sustainability Regulation Reshaping Specialty Chemical Manufacturing
The issue of environmental regulation has emerged as a decisive operational variable to specialty chemical manufacturers as the sustainability compliance becomes mandatory rather than voluntary. The Eco Design of Sustainable Products Regulation of the European Union, which will be fully enforced in 2024–2025, demands lifecycle assessment, traceability, and sustainable material sourcing of chemical products. Complementary to this, the EU Chemicals Strategy of Sustainability establishes long-term goals of decreasing the number of hazardous substances, forcing manufacturers to restructure processes and documentation systems to match the ever-tighter regulatory standards.
Hydrogen policy support also increases regulatory oversight. The IEA notes that hydrogen projects are still very policy-sensitive, requiring environmental certification and emissions verification to be eligible to receive funding. The extension of the Carbon Border Adjustment Mechanism to include chemicals by 2026 creates further cost exposure to producers of carbon-intensive goods. These converging frameworks prefer manufacturers who invest early in low-emission processes and open supply chains, and increase compliance costs on traditional manufacturers who supply lithium aluminum hydride to regulated markets.
Global Lithium Aluminum Hydride Market Opportunity
Pharmaceutical Expansion Supporting Long Term Synthesis Demand
The pharmaceutical production remains a structurally appealing growth opportunity to lithium aluminum hydride suppliers, as it involves the use of precision organic synthesis. WHO good manufacturing practice requirements require strict quality assurance of chemical reagents used in drug development, which supports the ongoing need of high-purity reducing agents. Governments across the Asia Pacific region are still encouraging local pharmaceutical manufacturing capacity, enhancing institutional demand on synthesis-grade materials used in multi-step drug manufacturing and intermediate processing.
According to the World Bank, clean-energy development and healthcare development demand sophisticated chemical inputs, which in turn contribute to diversified end-user demand. Pharmaceutical firms are augmenting their investment in R&D and are outsourcing synthesis operations to cost-effective areas, which continue to maintain long-term reagent usage. At the same time, new industrial applications of hydrogen are expanding the range of uses beyond pharmaceuticals, allowing lithium aluminum hydride suppliers to access a wider industrial base. This two-fold demand foundation strengthens market resilience and aligns growth opportunities with global healthcare and energy-transition priorities.
Global Lithium Aluminum Hydride Market Regional Analysis

By Region
- North America
- Europe
- Asia Pacific
Asia Pacific holds 50% of global market share, reflecting its dominance in pharmaceutical manufacturing and emerging hydrogen infrastructure deployment. India and China host extensive drug production ecosystems that generate consistent demand for synthesis grade chemical inputs. Government support for pharmaceutical self sufficiency and chemical industry development further reinforces regional consumption, positioning Asia Pacific as both a production and demand hub for lithium aluminum hydride.
The International Energy Agency reports China accounts for nearly two thirds of global electrolyser capacity installed or under final investment decision, alongside approximately 60% of global electrolyser manufacturing capacity. This hydrogen infrastructure scale creates complementary demand for chemical materials supporting hydrogen processing and industrial integration. Combined with India’s expanding pharmaceutical output and policy backed manufacturing initiatives, Asia Pacific maintains structural leadership, supported by diversified end users across healthcare and clean energy value chains.
Unlock Market Intelligence
Explore the market potential with our data-driven report
Global Lithium Aluminum Hydride Market Segmentation Analysis
By Grade
- Industrial Grade
- Battery Grade
Industrial Grade products account for 60% of total market share, confirming their dominance within lithium aluminum hydride demand structures. This grade is widely used by pharmaceutical intermediate producers and specialty chemical manufacturers that require consistent performance at optimized cost levels. Large volume procurement and standardized specifications allow end users to achieve economies of scale while maintaining compliance with international quality benchmarks, reinforcing industrial grade preference across established manufacturing hubs.
WHO pharmaceutical manufacturing guidelines support the use of standardized reagent grades that meet defined purity and safety thresholds, enabling industrial grade materials to satisfy regulatory requirements without the cost burden of ultra high purity alternatives. The concentration of demand in this segment reflects the maturity of pharmaceutical synthesis operations globally, where reliability, availability, and cost efficiency drive purchasing decisions. As pharmaceutical output expands in developing economies, industrial grade lithium aluminum hydride continues to anchor overall market volumes.

By Application
- Pharmaceuticals
- Battery Materials
- Organic Synthesis
Organic synthesis applications represent 55% of total market share, establishing this segment as the leading end use category. Pharmaceutical manufacturing relies heavily on controlled reduction reactions to construct complex molecular structures, positioning lithium aluminum hydride as a critical reagent within multi stage synthesis workflows. The scale and consistency of pharmaceutical production underpin sustained demand, as organic synthesis remains fundamental to drug development and commercial manufacturing processes.
WHO quality standards reinforce strict reagent performance requirements, ensuring pharmaceutical synthesis operations depend on reliable, high consistency materials. Continued investment in drug discovery, biologics, and treatment expansion sustains organic synthesis activity across global manufacturing networks. As pharmaceutical end users expand capacity in Asia Pacific and other emerging regions, demand for synthesis focused applications remains structurally strong. This application leadership highlights lithium aluminum hydride’s irreplaceable role in pharmaceutical chemistry and long term market stability.
Market Players in Global Lithium Aluminum Hydride Market
These market players maintain a significant presence in the Global lithium aluminum hydride market sector and contribute to its ongoing evolution.
- Gelest Inc.
- Evonik Industries
- Johnson Matthey
- Sigma-Aldrich (Merck)
- Albemarle Corporation
- BASF SE
- Strem Chemicals
- Tokyo Chemical Industry Co. Ltd.
- Acros Organics
- Hangzhou Dayangchem Co. Ltd.
- Beijing Hualu-Hengsheng Chemical Co. Ltd.
- Hangzhou Tiger Chemical Co. Ltd.
- DoFluoride Chemicals
- Evonik
- TCI Chemicals
Market News & Updates
- Evonik Industries, 2025:
Evonik Industries launched its new Smart Effects company on January 1, 2025, merging its silica and silane business lines into a specialized advanced technology platform employing 3,500 individuals globally. The new entity specializes in high-purity silica, metal oxides, and silanes essential for lithium-ion batteries, semiconductors, and electronics applications, supporting customers across over 100 countries through localized sales teams and regional technical centers. While not exclusively focused on lithium aluminum hydride, Smart Effects' portfolio includes support for battery chemistry innovations and specialty chemical applications integral to the broader lithium compound ecosystem. Additionally, Evonik established a joint venture, Evonik Fuhua New Materials (Sichuan) Co., Ltd., (51% Evonik ownership) in January 2025 to produce specialty hydrogen peroxide for solar panels, semiconductors, and food packaging with product availability expected in H1 2026, addressing complementary materials needs in the renewable energy and battery technology sectors that utilize advanced chemical compounds.
- Tokyo Chemical Industry Co. Ltd., 2025:
Tokyo Chemical Industry Co., Ltd. (TCI) introduced advanced perovskite solar cell materials in 2025, including passivation layer materials featuring lithium fluoride (LiF)-rich surface structures with the launch of PDINN (Passivation Dielectric-Integrated Neural Network material). The product features a fluorinated cyclic acetal structure providing high redox stability and the ability to form LiF-rich protective surfaces on perovskite materials, expanding TCI's portfolio of specialty chemicals for next-generation solar and energy storage applications. As a globally recognized manufacturer of specialty chemical reagents for research and development across chemistry, life science, and materials science sectors, TCI's PDINN product addresses emerging renewable energy material needs and supports advancement of alternative battery chemistry research requiring complex hydride and fluorine-containing compounds.
Frequently Asked Questions
Related Report
1. Market Segmentation
1.1. Research Scope
1.2. Research Methodology
1.3. Definitions and Assumptions
2. Executive Summary
3. Global Lithium Aluminum Hydride Market Policies, Regulations, and Standards
4. Global Lithium Aluminum Hydride Market Dynamics
4.1. Growth Factors
4.2. Challenges
4.3. Trends
4.4. Opportunities
5. Global Lithium Aluminum Hydride Market Statistics, 2022-2032F
5.1. Market Size & Growth Outlook
5.1.1. By Revenues in USD Million
5.2. Market Segmentation & Growth Outlook
5.2.1. By Grade
5.2.1.1. Industrial Grade- Market Insights and Forecast 2022-2032, USD Million
5.2.1.2. Battery Grade- Market Insights and Forecast 2022-2032, USD Million
5.2.2. By Application
5.2.2.1. Pharmaceuticals- Market Insights and Forecast 2022-2032, USD Million
5.2.2.2. Battery Materials- Market Insights and Forecast 2022-2032, USD Million
5.2.2.3. Organic Synthesis- Market Insights and Forecast 2022-2032, USD Million
5.2.3. By End-Use Industry
5.2.3.1. Pharmaceuticals- Market Insights and Forecast 2022-2032, USD Million
5.2.3.2. Battery Manufacturing- Market Insights and Forecast 2022-2032, USD Million
5.2.3.3. Chemical Synthesis- Market Insights and Forecast 2022-2032, USD Million
5.2.4. By Region
5.2.4.1. North America
5.2.4.2. Europe
5.2.4.3. Asia Pacific
5.2.5. By Competitors
5.2.5.1. Competition Characteristics
5.2.5.2. Market Share & Analysis
6. North America Lithium Aluminum Hydride Market Statistics, 2022-2032F
6.1. Market Size & Growth Outlook
6.1.1. By Revenues in USD Million
6.2. Market Segmentation & Growth Outlook
6.2.1. By Grade- Market Insights and Forecast 2022-2032, USD Million
6.2.2. By Application- Market Insights and Forecast 2022-2032, USD Million
6.2.3. By End-Use Industry- Market Insights and Forecast 2022-2032, USD Million
6.2.4. By Country
6.2.4.1. North America: US
6.2.4.2. Canada
6.2.4.3. Mexico
6.2.4.4. Rest of North America
6.3. North America: US Lithium Aluminum Hydride Market Statistics, 2022-2032F
6.3.1. Market Size & Growth Outlook
6.3.1.1. By Revenues in USD Million
6.3.2. Market Segmentation & Growth Outlook
6.3.2.1. By Grade- Market Insights and Forecast 2022-2032, USD Million
6.3.2.2. By Application- Market Insights and Forecast 2022-2032, USD Million
6.4. Canada Lithium Aluminum Hydride Market Statistics, 2022-2032F
6.4.1. Market Size & Growth Outlook
6.4.1.1. By Revenues in USD Million
6.4.2. Market Segmentation & Growth Outlook
6.4.2.1. By Grade- Market Insights and Forecast 2022-2032, USD Million
6.4.2.2. By Application- Market Insights and Forecast 2022-2032, USD Million
6.5. Mexico Lithium Aluminum Hydride Market Statistics, 2022-2032F
6.5.1. Market Size & Growth Outlook
6.5.1.1. By Revenues in USD Million
6.5.2. Market Segmentation & Growth Outlook
6.5.2.1. By Grade- Market Insights and Forecast 2022-2032, USD Million
6.5.2.2. By Application- Market Insights and Forecast 2022-2032, USD Million
7. Europe Lithium Aluminum Hydride Market Statistics, 2022-2032F
7.1. Market Size & Growth Outlook
7.1.1. By Revenues in USD Million
7.2. Market Segmentation & Growth Outlook
7.2.1. By Grade- Market Insights and Forecast 2022-2032, USD Million
7.2.2. By Application- Market Insights and Forecast 2022-2032, USD Million
7.2.3. By End-Use Industry- Market Insights and Forecast 2022-2032, USD Million
7.2.4. By Country
7.2.4.1. Europe: Germany
7.2.4.2. France
7.2.4.3. UK
7.2.4.4. Italy
7.2.4.5. Spain
7.2.4.6. Netherlands
7.2.4.7. Belgium
7.2.4.8. Russia
7.2.4.9. Poland
7.2.4.10. Turkey
7.2.4.11. Rest of Europe
7.3. Europe: Germany Lithium Aluminum Hydride Market Statistics, 2022-2032F
7.3.1. Market Size & Growth Outlook
7.3.1.1. By Revenues in USD Million
7.3.2. Market Segmentation & Growth Outlook
7.3.2.1. By Grade- Market Insights and Forecast 2022-2032, USD Million
7.3.2.2. By Application- Market Insights and Forecast 2022-2032, USD Million
7.4. France Lithium Aluminum Hydride Market Statistics, 2022-2032F
7.4.1. Market Size & Growth Outlook
7.4.1.1. By Revenues in USD Million
7.4.2. Market Segmentation & Growth Outlook
7.4.2.1. By Grade- Market Insights and Forecast 2022-2032, USD Million
7.4.2.2. By Application- Market Insights and Forecast 2022-2032, USD Million
7.5. UK Lithium Aluminum Hydride Market Statistics, 2022-2032F
7.5.1. Market Size & Growth Outlook
7.5.1.1. By Revenues in USD Million
7.5.2. Market Segmentation & Growth Outlook
7.5.2.1. By Grade- Market Insights and Forecast 2022-2032, USD Million
7.5.2.2. By Application- Market Insights and Forecast 2022-2032, USD Million
7.6. Italy Lithium Aluminum Hydride Market Statistics, 2022-2032F
7.6.1. Market Size & Growth Outlook
7.6.1.1. By Revenues in USD Million
7.6.2. Market Segmentation & Growth Outlook
7.6.2.1. By Grade- Market Insights and Forecast 2022-2032, USD Million
7.6.2.2. By Application- Market Insights and Forecast 2022-2032, USD Million
7.7. Spain Lithium Aluminum Hydride Market Statistics, 2022-2032F
7.7.1. Market Size & Growth Outlook
7.7.1.1. By Revenues in USD Million
7.7.2. Market Segmentation & Growth Outlook
7.7.2.1. By Grade- Market Insights and Forecast 2022-2032, USD Million
7.7.2.2. By Application- Market Insights and Forecast 2022-2032, USD Million
7.8. Netherlands Lithium Aluminum Hydride Market Statistics, 2022-2032F
7.8.1. Market Size & Growth Outlook
7.8.1.1. By Revenues in USD Million
7.8.2. Market Segmentation & Growth Outlook
7.8.2.1. By Grade- Market Insights and Forecast 2022-2032, USD Million
7.8.2.2. By Application- Market Insights and Forecast 2022-2032, USD Million
7.9. Belgium Lithium Aluminum Hydride Market Statistics, 2022-2032F
7.9.1. Market Size & Growth Outlook
7.9.1.1. By Revenues in USD Million
7.9.2. Market Segmentation & Growth Outlook
7.9.2.1. By Grade- Market Insights and Forecast 2022-2032, USD Million
7.9.2.2. By Application- Market Insights and Forecast 2022-2032, USD Million
7.10.Russia Lithium Aluminum Hydride Market Statistics, 2022-2032F
7.10.1. Market Size & Growth Outlook
7.10.1.1. By Revenues in USD Million
7.10.2. Market Segmentation & Growth Outlook
7.10.2.1. By Grade- Market Insights and Forecast 2022-2032, USD Million
7.10.2.2. By Application- Market Insights and Forecast 2022-2032, USD Million
7.11.Poland Lithium Aluminum Hydride Market Statistics, 2022-2032F
7.11.1. Market Size & Growth Outlook
7.11.1.1. By Revenues in USD Million
7.11.2. Market Segmentation & Growth Outlook
7.11.2.1. By Grade- Market Insights and Forecast 2022-2032, USD Million
7.11.2.2. By Application- Market Insights and Forecast 2022-2032, USD Million
7.12.Turkey Lithium Aluminum Hydride Market Statistics, 2022-2032F
7.12.1. Market Size & Growth Outlook
7.12.1.1. By Revenues in USD Million
7.12.2. Market Segmentation & Growth Outlook
7.12.2.1. By Grade- Market Insights and Forecast 2022-2032, USD Million
7.12.2.2. By Application- Market Insights and Forecast 2022-2032, USD Million
8. Asia Pacific Lithium Aluminum Hydride Market Statistics, 2022-2032F
8.1. Market Size & Growth Outlook
8.1.1. By Revenues in USD Million
8.2. Market Segmentation & Growth Outlook
8.2.1. By Grade- Market Insights and Forecast 2022-2032, USD Million
8.2.2. By Application- Market Insights and Forecast 2022-2032, USD Million
8.2.3. By End-Use Industry- Market Insights and Forecast 2022-2032, USD Million
8.2.4. By Country
8.2.4.1. Asia Pacific: China
8.2.4.2. India
8.2.4.3. Japan
8.2.4.4. South Korea
8.2.4.5. Australia
8.2.4.6. Thailand
8.2.4.7. Rest of Asia Pacific
8.3. Asia Pacific: China Lithium Aluminum Hydride Market Statistics, 2022-2032F
8.3.1. Market Size & Growth Outlook
8.3.1.1. By Revenues in USD Million
8.3.2. Market Segmentation & Growth Outlook
8.3.2.1. By Grade- Market Insights and Forecast 2022-2032, USD Million
8.3.2.2. By Application- Market Insights and Forecast 2022-2032, USD Million
8.4. India Lithium Aluminum Hydride Market Statistics, 2022-2032F
8.4.1. Market Size & Growth Outlook
8.4.1.1. By Revenues in USD Million
8.4.2. Market Segmentation & Growth Outlook
8.4.2.1. By Grade- Market Insights and Forecast 2022-2032, USD Million
8.4.2.2. By Application- Market Insights and Forecast 2022-2032, USD Million
8.5. Japan Lithium Aluminum Hydride Market Statistics, 2022-2032F
8.5.1. Market Size & Growth Outlook
8.5.1.1. By Revenues in USD Million
8.5.2. Market Segmentation & Growth Outlook
8.5.2.1. By Grade- Market Insights and Forecast 2022-2032, USD Million
8.5.2.2. By Application- Market Insights and Forecast 2022-2032, USD Million
8.6. South Korea Lithium Aluminum Hydride Market Statistics, 2022-2032F
8.6.1. Market Size & Growth Outlook
8.6.1.1. By Revenues in USD Million
8.6.2. Market Segmentation & Growth Outlook
8.6.2.1. By Grade- Market Insights and Forecast 2022-2032, USD Million
8.6.2.2. By Application- Market Insights and Forecast 2022-2032, USD Million
8.7. Australia Lithium Aluminum Hydride Market Statistics, 2022-2032F
8.7.1. Market Size & Growth Outlook
8.7.1.1. By Revenues in USD Million
8.7.2. Market Segmentation & Growth Outlook
8.7.2.1. By Grade- Market Insights and Forecast 2022-2032, USD Million
8.7.2.2. By Application- Market Insights and Forecast 2022-2032, USD Million
8.8. Thailand Lithium Aluminum Hydride Market Statistics, 2022-2032F
8.8.1. Market Size & Growth Outlook
8.8.1.1. By Revenues in USD Million
8.8.2. Market Segmentation & Growth Outlook
8.8.2.1. By Grade- Market Insights and Forecast 2022-2032, USD Million
8.8.2.2. By Application- Market Insights and Forecast 2022-2032, USD Million
9. Competitive Outlook
9.1. Company Profiles
9.1.1. Sigma-Aldrich (Merck)
9.1.1.1. Business Description
9.1.1.2. Product Portfolio
9.1.1.3. Collaborations & Alliances
9.1.1.4. Recent Developments
9.1.1.5. Financial Details
9.1.1.6. Others
9.1.2. Albemarle Corporation
9.1.2.1. Business Description
9.1.2.2. Product Portfolio
9.1.2.3. Collaborations & Alliances
9.1.2.4. Recent Developments
9.1.2.5. Financial Details
9.1.2.6. Others
9.1.3. BASF SE
9.1.3.1. Business Description
9.1.3.2. Product Portfolio
9.1.3.3. Collaborations & Alliances
9.1.3.4. Recent Developments
9.1.3.5. Financial Details
9.1.3.6. Others
9.1.4. Strem Chemicals
9.1.4.1. Business Description
9.1.4.2. Product Portfolio
9.1.4.3. Collaborations & Alliances
9.1.4.4. Recent Developments
9.1.4.5. Financial Details
9.1.4.6. Others
9.1.5. Tokyo Chemical Industry Co. Ltd.
9.1.5.1. Business Description
9.1.5.2. Product Portfolio
9.1.5.3. Collaborations & Alliances
9.1.5.4. Recent Developments
9.1.5.5. Financial Details
9.1.5.6. Others
9.1.6. Gelest Inc.
9.1.6.1. Business Description
9.1.6.2. Product Portfolio
9.1.6.3. Collaborations & Alliances
9.1.6.4. Recent Developments
9.1.6.5. Financial Details
9.1.6.6. Others
9.1.7. Evonik Industries
9.1.7.1. Business Description
9.1.7.2. Product Portfolio
9.1.7.3. Collaborations & Alliances
9.1.7.4. Recent Developments
9.1.7.5. Financial Details
9.1.7.6. Others
9.1.8. Johnson Matthey
9.1.8.1. Business Description
9.1.8.2. Product Portfolio
9.1.8.3. Collaborations & Alliances
9.1.8.4. Recent Developments
9.1.8.5. Financial Details
9.1.8.6. Others
9.1.9. Acros Organics
9.1.9.1. Business Description
9.1.9.2. Product Portfolio
9.1.9.3. Collaborations & Alliances
9.1.9.4. Recent Developments
9.1.9.5. Financial Details
9.1.9.6. Others
9.1.10. Hangzhou Dayangchem Co. Ltd.
9.1.10.1. Business Description
9.1.10.2. Product Portfolio
9.1.10.3. Collaborations & Alliances
9.1.10.4. Recent Developments
9.1.10.5. Financial Details
9.1.10.6. Others
9.1.11. Beijing Hualu-Hengsheng Chemical Co. Ltd.
9.1.11.1. Business Description
9.1.11.2. Product Portfolio
9.1.11.3. Collaborations & Alliances
9.1.11.4. Recent Developments
9.1.11.5. Financial Details
9.1.11.6. Others
9.1.12. Hangzhou Tiger Chemical Co. Ltd.
9.1.12.1. Business Description
9.1.12.2. Product Portfolio
9.1.12.3. Collaborations & Alliances
9.1.12.4. Recent Developments
9.1.12.5. Financial Details
9.1.12.6. Others
9.1.13. DoFluoride Chemicals
9.1.13.1. Business Description
9.1.13.2. Product Portfolio
9.1.13.3. Collaborations & Alliances
9.1.13.4. Recent Developments
9.1.13.5. Financial Details
9.1.13.6. Others
9.1.14. Evonik
9.1.14.1. Business Description
9.1.14.2. Product Portfolio
9.1.14.3. Collaborations & Alliances
9.1.14.4. Recent Developments
9.1.14.5. Financial Details
9.1.14.6. Others
9.1.15. TCI Chemicals
9.1.15.1. Business Description
9.1.15.2. Product Portfolio
9.1.15.3. Collaborations & Alliances
9.1.15.4. Recent Developments
9.1.15.5. Financial Details
9.1.15.6. Others
10. Disclaimer
| Segment | Sub-Segment |
|---|---|
| By Grade |
|
| By Application |
|
| By End-Use Industry |
|
| By Region |
|
Research Methodology
This study followed a structured approach comprising four key phases to assess the size and scope of the electro-oxidation market. The process began with thorough secondary research to collect data on the target market, related markets, and broader industry context. These findings, along with preliminary assumptions and estimates, were then validated through extensive primary research involving industry experts from across the value chain. To calculate the overall market size, both top-down and bottom-up methodologies were employed. Finally, market segmentation and data triangulation techniques were applied to refine and validate segment-level estimations.
Secondary Research
The secondary research phase involved gathering data from a wide range of credible and published sources. This step helped in identifying industry trends, defining market segmentation, and understanding the market landscape and value chain.
Sources consulted during this phase included:
- Company annual reports, investor presentations, and press releases
- Industry white papers and certified publications
- Trade directories and market-recognized databases
- Articles from authoritative authors and reputable journals
- Gold and silver standard websites
Secondary research was critical in mapping out the industry's value chain and monetary flow, identifying key market segments, understanding regional variations, and tracking significant industry developments.
Other key sources:
- Financial disclosures
- Industry associations and trade bodies
- News outlets and business magazines
- Academic journals and research studies
- Paid industry databases
Primary Research
To validate secondary data and gain deeper market insights, primary research was conducted with key stakeholders across both the supply and demand sides of the market.
On the demand side, participants included decision-makers and influencers from end-user industries—such as CIOs, CTOs, and CSOs—who provided first-hand perspectives on market needs, product usage, and future expectations.
On the supply side, interviews were conducted with manufacturers, industry associations, and institutional participants to gather insights into current offerings, product pipelines, and market challenges.
Primary interviews provided critical inputs such as:
- Market size and revenue data
- Product and service breakdowns
- Market forecasts
- Regional and application-specific trends
Stakeholders consulted included:
- Leading OEM and solution providers
- Channel and distribution partners
- End users across various applications
- Independent consultants and industry specialists
Market Size Estimation and Data Triangulation
- Identifying Key Market Participants (Secondary Research)
- Goal: To identify the major players or companies in the target market. This typically involves using publicly available data sources such as industry reports, market research publications, and financial statements of companies.
- Tools: Reports from firms like Gartner, Forrester, Euromonitor, Statista, IBISWorld, and others. Public financial statements, news articles, and press releases from top market players.
- Extracting Earnings of Key Market Participants
- Goal: To estimate the earnings generated from the product or service being analyzed. This step helps in understanding the revenue potential of each market player in a specific geography.
- Methods: Earnings data can be gathered from:
- Publicly available financial reports (for listed companies).
- Interviews and primary data sources from professionals, such as Directors, VPs, SVPs, etc. This is especially useful for understanding more nuanced, internal data that isn't publicly disclosed.
- Annual reports and investor presentations of key players.
- Data Collation and Development of a Relevant Data Model
- Goal: To collate inputs from both primary and secondary sources into a structured, data-driven model for market estimation. This model will incorporate key market KPIs and any independent variables relevant to the market.
- Key KPIs: These could include:
- Market size, growth rate, and demand drivers.
- Industry-specific metrics like market share, average revenue per customer (ARPC), or average deal size.
- External variables, such as economic growth rates, inflation rates, or commodity prices, that could affect the market.
- Data Modeling: Based on this data, the market forecasts are developed for the next 5 years. A combination of trend analysis, scenario modeling, and statistical regression might be used to generate projections.
- Scenario Analysis
- Goal: To test different assumptions and validate how sensitive the market is to changes in key variables (e.g., market demand, regulatory changes, technological disruptions).
- Types of Scenarios:
- Base Case: Based on current assumptions and historical data.
- Best-Case Scenario: Assuming favorable market conditions, regulatory environments, and technological advancements.
- Worst-Case Scenario: Accounting for adverse factors, such as economic downturns, stricter regulations, or unexpected disruptions.


