Poland Main Battle Tanks Market Report: Trends, Growth and Forecast (2026-2032)
By Weight Category (Light Weight Tanks, Medium Weight Tanks, Heavy Weight Tanks), By Solution Type (Line Fit, Retrofit), By Component (Weaponry Systems, Situational Awareness Systems, Turret Systems, Internal Combustion Engines, Wheel and Track Systems, Others), By Procurement Status (New-Build, Upgrade/Retrofit), By Mobility Type (Tracked, Wheeled), By Armament (Smoothbore Gun (120mm), Rifled Gun, Autoloader-equipped Platforms, Manual-loaded Platforms), By Electronics (Networked Battle Management Systems, Active Protection Systems, Advanced Fire Control Systems), By Application (Offensive Operations, Defensive Operations) ... Read more
|
Major Players
|
Poland Main Battle Tanks Market Statistics and Insights, 2026
- Market Size Statistics
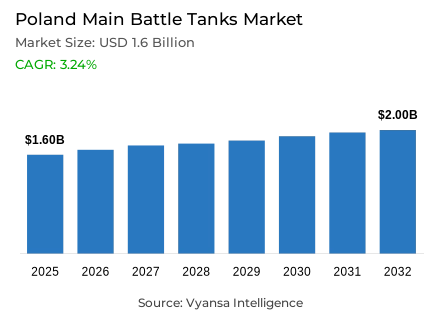
- Main battle tanks in Poland is estimated at USD 1.6 billion in 2025.
- The market size is expected to grow to USD 2 billion by 2032.
- Market to register a cagr of around 3.24% during 2026-32.
- Weight Category Shares
- Heavy weight tanks grabbed market share of 60%.
- Competition
- More than 10 companies are actively engaged in producing main battle tanks in Poland.
- Top 5 companies acquired around 80% of the market share.
- WB Electronics; Elbit Systems; Honeywell Defense & Space; Hyundai Rotem; General Dynamics Land Systems etc., are few of the top companies.
- Solution Type
- Line fit grabbed 70% of the market.
Poland Main Battle Tanks Market Outlook
Poland's Main Battle Tanks Market is approximately USD 1.6 billion in 2025 and projected to reach close to USD 2 billion by 2032, registering a CAGR of about 3.24% during the period of 2026-2032. This is because of Poland's strong commitment to developing and improving the strength of defense. As Poland is spending on defense at USD 38.0 billion in 2024, accounting for 4.2% of GDP, leading Central and Western Europe, the plan of spending nearly 4.8% of GDP by 2026 emphasizes improved readiness of the defense systems.
The purchase of nearly 1,000 main battle tanks by the government reflects its goal of having "one of the strongest NATO member states' armored capabilities." The purchase is also part of the overall upgrade processes that are dominated by the production of heavy tanks. The heavy tanks lead the market in terms of share of about 60%, including models such as the M1A2 SEPv3 Abrams, K2 Black Panther, and the Leopard 2PL. These tanks have enhanced armor systems and 120mm smoothbore guns. They form the mainstay of the Polish armor capabilities until 2032.
In line with the aforementioned importation, it is also important to understand that Poland is cultivating its innovation expertise within its borders by incorporating the design and development of its own systems, for instance, the Borsuk Infantry Fighting Vehicle. This could be interpreted as it is leaning more towards becoming self-reliant while also cultivating international collaboration, for instance, from nations like South Korea and the United States.
From a solutions viewpoint, line fit contracts lead by a considerable margin of around 70%, with a focus on custodied solutions that feature integrated platforms delivered from the factory with embedded digital networks and protection. Retrofit solutions currently lead with a further 30%, which seeks to improve existing armored offerings, including Leopard 2 variants. This set of solutions aims to reflect Poland's intentions to improve its own armored posture and its position as a regional center for innovative weapons development.

Poland Main Battle Tanks Market Growth DriverStrengthening Defense Investment and Strategic Military Expansion
Poland’s growing military outlays demonstrate an unrivaled dedication to national security. Poland’s military expenditures reached USD 38.0 billion in 2024, a 31% increase over 2023, accounting for 4.2% of GDP, the largest percentage out of Central/Western Europe. This escalated due to a perceived level of threats due to the Russian invasion of Ukraine in 2022, making Poland a frontrunner in military outlays within NATO.Poland has dedicated 54.4% of military expenditures to equipment purchases in 2025, projecting a clear focus on readiness through 2026-2032.
The long-term target of increasing spending to almost 4.8% of its GDP by 2026 indicates Poland’s continued efforts in enhancing its military strength. The proposed procurement of 1,000 main battle tanks, which would exceed the total number of tanks possessed by major members in Western Europe, indicate Warsaw’s intentions of possessing the best armor forces. The 45 billion dollars proposed spending in 2025 solidifies Poland as the prime force behind the growth of the defense sector in Europe.
Poland Main Battle Tanks Market ChallengeIndustrial Limitations and Persistent Supply Chain Disruptions
Despite the rapid modernization process, it is observed that the Polish defence industry is challenged by their production capabilities. Currently, the native Polish manufacturers can produce 30,000-40,000 shells per year, while the production count for Russia is 250,000 shells in one month, which is quite distinct from the Polish production capabilities. Moreover, it is also important to acknowledge that the Polish defence industry depends on imported materials for assembly purposes, which hampers their growth.
Current shortages of key raw materials like TNT and gunpowder are already adding to the lack of readiness of the defense of Europe, and the production of such weaponry within Europe is made more expensive by the complexity of supply chains, the use of Chinese materials imports, very tight environmental regulations, and high energy prices. While companies like Rheinmetall are expanding production capacity, the effects are likely to take years to bear fruit. Poland’s strategy of increasing 155mm shells’ production to 100,000 units per year by 2028 is dependent on building new production facilities and accessing raw material supplies.
Unlock Market Intelligence
Explore the market potential with our data-driven report
Poland Main Battle Tanks Market TrendRising Indigenous Manufacturing and Technological Collaboration
A trend of increasing indigenization of the defense modernization program in Poland is emerging, at least in the area of designing the actual platforms. The Borsuk infantry fighting vehicle, a completely Polish-designed amphibious vehicle, represents a significant breakthrough in indigenous innovation. The framework agreement on the supply of 1,000 units in 2023, and the scaling up of production in 2024, demonstrates its determination to enhance its own defense industry. Its versatility in accommodating a crew of three and a further six troops, fully equipped, provides flexible mobility capabilities to the ever-changing armored force structure of Poland.
To complement this local effort, Poland is also moving forward with a two-track approach to cooperating with foreign makers of defense hardware. This is manifested in the USD 6.7 billion agreement with South Korea regarding the importation of 180 units of the K2 tanks, whose local version, the K2PL, is being locally coproduced. This partnership is expected to integrate enhanced protection, communication, and anti-drone systems and deliver the remaining tanks needed to realize modernization goals until the end of the 2026 to 2032 period through the overall contribution of a total of 820 units above mentioned tanks.
Poland Main Battle Tanks Market OpportunityStrengthening NATO Integration and Interoperability Framework
Compliance with the dynamically changing NATO standards covers an essential area for Polish military procurement policy. The decision to procure various platforms M1A2 SEPv3 Abrams, K2 Black Panther, and Leopard 2PL indicates that the Polish military values the concept of interoperability. The acquired tanks are equipped with digital command links to facilitate the easy flow of command during joint missions. Use of digital command link systems also improves the working efficiency of the respective platforms during missions.
The 2035 guideline set by NATO to allocate 3.5% of GDP to spending on defense ensures a constant demand for modern armored vehicles. The location of Poland at the edge of NATO’s Eastern border increases the country’s importance to Western defense companies that wish to enter the booming Polish market. Collaboration with South Korean and American companies is expected to create a platform for the production of components and integration of systems in Poland, making it the central hub for all matters related to defense.
Unlock Market Intelligence
Explore the market potential with our data-driven report
Poland Main Battle Tanks Market Segmentation Analysis
By Weight Category
- Light Weight Tanks
- Medium Weight Tanks
- Heavy Weight Tanks
Heavy weight tanks dominate Poland’s main battle tank market, capturing approximately 60% market share. The fleet, including M1A2 SEPv3 Abrams exceeding 73 tons, K2 Black Panther variants between 56-58 tons, and 62-ton Leopard 2PL/PLM1 units, underscores a strategic emphasis on high-capacity firepower and robust armor protection. These platforms incorporate advanced 120mm smoothbore guns, composite armor, and active defense systems designed to counter modern armored threats effectively.
Light and medium-weight categories maintain supporting roles, including reconnaissance and infantry transport. The 25-ton Borsuk IFV exemplifies this segment’s operational utility in providing mobility and tactical flexibility. Poland’s prioritization of heavy platforms reflects a defensive doctrine centered on survivability and deterrence, supported by rising defense expenditure exceeding 4% of GDP. The continued focus on heavy tanks through 2035 ensures the segment’s sustained 60% share within the national modernization framework.

By Solution Type
- Line Fit
- Retrofit
Line fit solutions account for approximately 70% market share in Poland’s main battle tank acquisitions, emphasizing procurement of fully integrated platforms directly from manufacturers. Large-scale orders such as 250 M1A2 SEPv3 Abrams tanks and 1,000 K2 Black Panther units highlight this preference for factory-assembled systems with pre-installed digital networks, fire control, and protection systems. This strategy ensures immediate readiness, operational efficiency, and seamless alignment with NATO interoperability standards.
Retrofit programs, comprising roughly 30% of the market, focus on extending the operational life of existing fleets. Poland’s modernization of 142 Leopard 2A4 tanks to Leopard 2PL/PLM1 configurations-76 completed by 2024-demonstrates this approach. Upgrades include enhanced turret armor, new optics, improved hydraulics, and digital command enhancements. However, the dominance of line fit acquisitions underscores Poland’s intent to prioritize cutting-edge platforms and next-generation technologies essential for its defense modernization objectives throughout 2026-2032.
List of Companies Covered in Poland Main Battle Tanks Market
The companies listed below are highly influential in the Poland main battle tanks market, with a significant market share and a strong impact on industry developments.
- WB Electronics
- Elbit Systems
- Honeywell Defense & Space
- Hyundai Rotem
- General Dynamics Land Systems
- Rheinmetall AG
- Polska Grupa Zbrojeniowa (PGZ)
- Systematic A/S
- MTU Friedrichshafen
- Northrop Grumman
Market News & Updates
- Hyundai Rotem, 2025:
Signed a technology transfer agreement with Polska Grupa Zbrojeniowa and Bumar-Łabędy for domestic production of 61 K2PL main battle tanks and support vehicles in Poland from 2028 to 2030.
- General Dynamics Land Systems, 2025:
Signed 52 contracts with Polish suppliers at MSPO 2025 to support Poland's Abrams tank fleet and expanded the Regional Sustainment Center for maintenance and overhaul in Poznań.
Frequently Asked Questions
Related Report
1. Market Segmentation
1.1. Research Scope
1.2. Research Methodology
1.3. Definitions and Assumptions
2. Executive Summary
3. Poland Main Battle Tanks Market Policies, Regulations, and Standards
4. Poland Main Battle Tanks Market Dynamics
4.1. Growth Factors
4.2. Challenges
4.3. Trends
4.4. Opportunities
5. Poland Main Battle Tanks Market Statistics, 2022-2032F
5.1. Market Size & Growth Outlook
5.1.1.By Revenues in USD Million
5.2. Market Segmentation & Growth Outlook
5.2.1.By Weight Category
5.2.1.1. Light Weight Tanks- Market Insights and Forecast 2022-2032, USD Million
5.2.1.2. Medium Weight Tanks- Market Insights and Forecast 2022-2032, USD Million
5.2.1.3. Heavy Weight Tanks- Market Insights and Forecast 2022-2032, USD Million
5.2.2.By Solution Type
5.2.2.1. Line Fit- Market Insights and Forecast 2022-2032, USD Million
5.2.2.2. Retrofit- Market Insights and Forecast 2022-2032, USD Million
5.2.3.By Component
5.2.3.1. Weaponry Systems- Market Insights and Forecast 2022-2032, USD Million
5.2.3.2. Situational Awareness Systems- Market Insights and Forecast 2022-2032, USD Million
5.2.3.3. Turret Systems- Market Insights and Forecast 2022-2032, USD Million
5.2.3.4. Internal Combustion Engines- Market Insights and Forecast 2022-2032, USD Million
5.2.3.5. Wheel and Track Systems- Market Insights and Forecast 2022-2032, USD Million
5.2.3.6. Others- Market Insights and Forecast 2022-2032, USD Million
5.2.4.By Procurement Status
5.2.4.1. New-Build- Market Insights and Forecast 2022-2032, USD Million
5.2.4.2. Upgrade/Retrofit- Market Insights and Forecast 2022-2032, USD Million
5.2.5.By Mobility Type
5.2.5.1. Tracked- Market Insights and Forecast 2022-2032, USD Million
5.2.5.2. Wheeled- Market Insights and Forecast 2022-2032, USD Million
5.2.6.By Armament
5.2.6.1. Smoothbore Gun (120mm)- Market Insights and Forecast 2022-2032, USD Million
5.2.6.2. Rifled Gun- Market Insights and Forecast 2022-2032, USD Million
5.2.6.3. Autoloader-equipped Platforms- Market Insights and Forecast 2022-2032, USD Million
5.2.6.4. Manual-loaded Platforms- Market Insights and Forecast 2022-2032, USD Million
5.2.7.By Electronics
5.2.7.1. Networked Battle Management Systems- Market Insights and Forecast 2022-2032, USD Million
5.2.7.2. Active Protection Systems- Market Insights and Forecast 2022-2032, USD Million
5.2.7.3. Advanced Fire Control Systems- Market Insights and Forecast 2022-2032, USD Million
5.2.8.By Application
5.2.8.1. Offensive Operations- Market Insights and Forecast 2022-2032, USD Million
5.2.8.2. Defensive Operations- Market Insights and Forecast 2022-2032, USD Million
5.2.9.By Competitors
5.2.9.1. Competition Characteristics
5.2.9.2. Market Share & Analysis
6. Poland Light Weight Tanks Market Statistics, 2022-2032
6.1. Market Size & Growth Outlook
6.1.1.By Revenues in USD Million
6.2. Market Segmentation & Growth Outlook
6.2.1.By Solution Type- Market Insights and Forecast 2022-2032, USD Million
6.2.2.By Component- Market Insights and Forecast 2022-2032, USD Million
6.2.3.By Procurement Status- Market Insights and Forecast 2022-2032, USD Million
6.2.4.By Mobility Type- Market Insights and Forecast 2022-2032, USD Million
6.2.5.By Armament- Market Insights and Forecast 2022-2032, USD Million
6.2.6.By Electronics- Market Insights and Forecast 2022-2032, USD Million
6.2.7.By Application- Market Insights and Forecast 2022-2032, USD Million
7. Poland Medium Weight Tanks Market Statistics, 2022-2032
7.1. Market Size & Growth Outlook
7.1.1.By Revenues in USD Million
7.2. Market Segmentation & Growth Outlook
7.2.1.By Solution Type- Market Insights and Forecast 2022-2032, USD Million
7.2.2.By Component- Market Insights and Forecast 2022-2032, USD Million
7.2.3.By Procurement Status- Market Insights and Forecast 2022-2032, USD Million
7.2.4.By Mobility Type- Market Insights and Forecast 2022-2032, USD Million
7.2.5.By Armament- Market Insights and Forecast 2022-2032, USD Million
7.2.6.By Electronics- Market Insights and Forecast 2022-2032, USD Million
7.2.7.By Application- Market Insights and Forecast 2022-2032, USD Million
8. Poland Heavy Weight Tanks Market Statistics, 2022-2032
8.1. Market Size & Growth Outlook
8.1.1.By Revenues in USD Million
8.2. Market Segmentation & Growth Outlook
8.2.1.By Solution Type- Market Insights and Forecast 2022-2032, USD Million
8.2.2.By Component- Market Insights and Forecast 2022-2032, USD Million
8.2.3.By Procurement Status- Market Insights and Forecast 2022-2032, USD Million
8.2.4.By Mobility Type- Market Insights and Forecast 2022-2032, USD Million
8.2.5.By Armament- Market Insights and Forecast 2022-2032, USD Million
8.2.6.By Electronics- Market Insights and Forecast 2022-2032, USD Million
8.2.7.By Application- Market Insights and Forecast 2022-2032, USD Million
9. Competitive Outlook
9.1. Company Profiles
9.1.1.Hyundai Rotem
9.1.1.1. Business Description
9.1.1.2. Product Portfolio
9.1.1.3. Collaborations & Alliances
9.1.1.4. Recent Developments
9.1.1.5. Financial Details
9.1.1.6. Others
9.1.2.General Dynamics Land Systems
9.1.2.1. Business Description
9.1.2.2. Product Portfolio
9.1.2.3. Collaborations & Alliances
9.1.2.4. Recent Developments
9.1.2.5. Financial Details
9.1.2.6. Others
9.1.3.Rheinmetall AG
9.1.3.1. Business Description
9.1.3.2. Product Portfolio
9.1.3.3. Collaborations & Alliances
9.1.3.4. Recent Developments
9.1.3.5. Financial Details
9.1.3.6. Others
9.1.4.Polska Grupa Zbrojeniowa (PGZ)
9.1.4.1. Business Description
9.1.4.2. Product Portfolio
9.1.4.3. Collaborations & Alliances
9.1.4.4. Recent Developments
9.1.4.5. Financial Details
9.1.4.6. Others
9.1.5.Systematic A/S
9.1.5.1. Business Description
9.1.5.2. Product Portfolio
9.1.5.3. Collaborations & Alliances
9.1.5.4. Recent Developments
9.1.5.5. Financial Details
9.1.5.6. Others
9.1.6.WB Electronics
9.1.6.1. Business Description
9.1.6.2. Product Portfolio
9.1.6.3. Collaborations & Alliances
9.1.6.4. Recent Developments
9.1.6.5. Financial Details
9.1.6.6. Others
9.1.7.Elbit Systems
9.1.7.1. Business Description
9.1.7.2. Product Portfolio
9.1.7.3. Collaborations & Alliances
9.1.7.4. Recent Developments
9.1.7.5. Financial Details
9.1.7.6. Others
9.1.8.Honeywell Defense & Space
9.1.8.1. Business Description
9.1.8.2. Product Portfolio
9.1.8.3. Collaborations & Alliances
9.1.8.4. Recent Developments
9.1.8.5. Financial Details
9.1.8.6. Others
9.1.9.MTU Friedrichshafen
9.1.9.1. Business Description
9.1.9.2. Product Portfolio
9.1.9.3. Collaborations & Alliances
9.1.9.4. Recent Developments
9.1.9.5. Financial Details
9.1.9.6. Others
9.1.10. Northrop Grumman
9.1.10.1. Business Description
9.1.10.2. Product Portfolio
9.1.10.3. Collaborations & Alliances
9.1.10.4. Recent Developments
9.1.10.5. Financial Details
9.1.10.6. Others
10. Disclaimer
| Segment | Sub-Segment |
|---|---|
| By Weight Category |
|
| By Solution Type |
|
| By Component |
|
| By Procurement Status |
|
| By Mobility Type |
|
| By Armament |
|
| By Electronics |
|
| By Application |
|
Research Methodology
This study followed a structured approach comprising four key phases to assess the size and scope of the electro-oxidation market. The process began with thorough secondary research to collect data on the target market, related markets, and broader industry context. These findings, along with preliminary assumptions and estimates, were then validated through extensive primary research involving industry experts from across the value chain. To calculate the overall market size, both top-down and bottom-up methodologies were employed. Finally, market segmentation and data triangulation techniques were applied to refine and validate segment-level estimations.
Secondary Research
The secondary research phase involved gathering data from a wide range of credible and published sources. This step helped in identifying industry trends, defining market segmentation, and understanding the market landscape and value chain.
Sources consulted during this phase included:
- Company annual reports, investor presentations, and press releases
- Industry white papers and certified publications
- Trade directories and market-recognized databases
- Articles from authoritative authors and reputable journals
- Gold and silver standard websites
Secondary research was critical in mapping out the industry's value chain and monetary flow, identifying key market segments, understanding regional variations, and tracking significant industry developments.
Other key sources:
- Financial disclosures
- Industry associations and trade bodies
- News outlets and business magazines
- Academic journals and research studies
- Paid industry databases
Primary Research
To validate secondary data and gain deeper market insights, primary research was conducted with key stakeholders across both the supply and demand sides of the market.
On the demand side, participants included decision-makers and influencers from end-user industries—such as CIOs, CTOs, and CSOs—who provided first-hand perspectives on market needs, product usage, and future expectations.
On the supply side, interviews were conducted with manufacturers, industry associations, and institutional participants to gather insights into current offerings, product pipelines, and market challenges.
Primary interviews provided critical inputs such as:
- Market size and revenue data
- Product and service breakdowns
- Market forecasts
- Regional and application-specific trends
Stakeholders consulted included:
- Leading OEM and solution providers
- Channel and distribution partners
- End users across various applications
- Independent consultants and industry specialists
Market Size Estimation and Data Triangulation
- Identifying Key Market Participants (Secondary Research)
- Goal: To identify the major players or companies in the target market. This typically involves using publicly available data sources such as industry reports, market research publications, and financial statements of companies.
- Tools: Reports from firms like Gartner, Forrester, Euromonitor, Statista, IBISWorld, and others. Public financial statements, news articles, and press releases from top market players.
- Extracting Earnings of Key Market Participants
- Goal: To estimate the earnings generated from the product or service being analyzed. This step helps in understanding the revenue potential of each market player in a specific geography.
- Methods: Earnings data can be gathered from:
- Publicly available financial reports (for listed companies).
- Interviews and primary data sources from professionals, such as Directors, VPs, SVPs, etc. This is especially useful for understanding more nuanced, internal data that isn't publicly disclosed.
- Annual reports and investor presentations of key players.
- Data Collation and Development of a Relevant Data Model
- Goal: To collate inputs from both primary and secondary sources into a structured, data-driven model for market estimation. This model will incorporate key market KPIs and any independent variables relevant to the market.
- Key KPIs: These could include:
- Market size, growth rate, and demand drivers.
- Industry-specific metrics like market share, average revenue per customer (ARPC), or average deal size.
- External variables, such as economic growth rates, inflation rates, or commodity prices, that could affect the market.
- Data Modeling: Based on this data, the market forecasts are developed for the next 5 years. A combination of trend analysis, scenario modeling, and statistical regression might be used to generate projections.
- Scenario Analysis
- Goal: To test different assumptions and validate how sensitive the market is to changes in key variables (e.g., market demand, regulatory changes, technological disruptions).
- Types of Scenarios:
- Base Case: Based on current assumptions and historical data.
- Best-Case Scenario: Assuming favorable market conditions, regulatory environments, and technological advancements.
- Worst-Case Scenario: Accounting for adverse factors, such as economic downturns, stricter regulations, or unexpected disruptions.


