Poland Beer Market Report: Trends, Growth and Forecast (2026-2032)
Product Type (Dark Beer (Ale, Sorghum Beer, Weissbier/Weizen/Wheat Beer), Lager (Flavoured/Mixed Lager, Standard Lager (Premium Lager (Domestic Premium Lager, Imported Premium Lager), Mid-Priced Lager (Domestic Mid-Priced Lager, Imported Mid-Priced Lager), Economy Lager (Domestic Economy Lager, Imported Economy Lager))), Non/Low Alcohol Beer (Low Alcohol Beer, Non Alcoholic Beer), Stout, Others (Porter, Malt etc.)), Production (Macro Brewery, Micro Brewery, Craft Brewery), Packaging Type (Bottles, Cans, Others), Sales Channel (On-Trade, Off-Trade) ... Read more
|
Major Players
|
Poland Beer Market Statistics and Insights, 2026
- Market Size Statistics
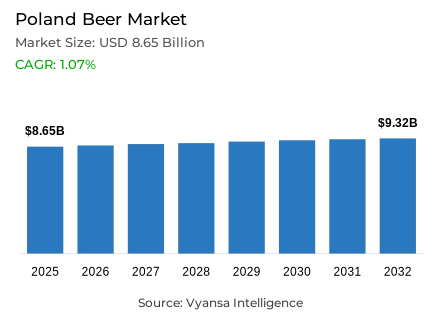
- Beer in Poland is estimated at USD 8.65 billion.
- The market size is expected to grow to USD 9.32 billion by 2032.
- Market to register a cagr of around 1.07% during 2026-32.
- Product Type Shares
- Lager grabbed market share of 80%.
- Competition
- More than 10 companies are actively engaged in producing beer in Poland.
- Top 5 companies acquired around 90% of the market share.
- Perla Browary Lubelskie SA; Lidl Polska Sklepy Spozywcze Sp zoo Sp k; Browar Amber Sp zoo; Kompania Piwowarska SA; Grupa Zywiec Sp zoo etc., are few of the top companies.
- Sales Channel
- Off-trade grabbed 75% of the market.
Poland Beer Market Outlook
The Poland beer Market is worth $8.65 billion in 2025 and is forecasted to reach $9.32 billion by 2032, with a CAGR of around 1.07% for the period 2026–2032. Total consumption of beer will be subject to moderate reduction pressures due to continuing economic limitations, higher production costs, and diminishing population. Off-trade channels, accounting for 75% of the market, will remain the key distribution channel, dominated by supermarkets, discounters, and convenience stores through competitive prices and high-frequency promotions evoking impulse purchases. On-trade consumption is forecast to remain at relatively low levels due to high prices and limited end user foot traffic constraining growth.
Lager, with almost 80% market share, will continue to be the largest sector in beer overall sales, while mid-range lager will continue to be the most successful category. Private label brands will sustain economy lager, with premium and super-premium lagers likely to benefit from the smaller number of end users seeking more superior products and more complex flavour profiles. Flavoured and mixed lagers and seasonals and specialties will provide additional scope for product innovation and differentiation.
Low-alcohol and non-alcoholic beer will be the most dynamic segment in the forecast period. Increasing health consciousness and requirement for lower-calorie products will drive its consumption, led by urban and young end users. The breweries will have to expand their portfolios with next-generation tastes, lower-sugar variants, and products aimed at specific dietary or wellness requirements, thereby driving category growth.
Innovation and premiumisation will shape the future of the market. Leading breweries will emphasize local and natural ingredients, introduce new tastes, and develop innovative products towards women and health-focused end users. All these, coupled with strategic promotion and marketing, will keep the category in the interest and sustain steady, but modest, growth in Poland beer market.

Poland Beer Market Growth DriverHealth awareness lifts beer value growth
End users in Poland are becoming more health-aware, driving demand for low- and non-alcoholic beers. End users continue to seek fewer calories, lower alcohol, and less sugar without compromising taste. This trend drives breweries to broaden their portfolios, offering a wider range of innovative, health-oriented beers that appeal to both younger and older end users.
Companies are launching low-calorie and flavor versions while promoting their health benefits via promotions. The strategy not only appeals to new shoppers but also increases brand loyalty among existing end users. With rising wellness awareness, breweries are seeing consistent value expansion when overall volumes of beer remain flat.
Poland Beer Market ChallengeEconomic Pressures and Demographic Shifts Curb Growth
Growing cost of production, excises, and inflation are squeezing prices for beer upwards, limiting affordability for the majority of end users. Price-sensitive end users might reduce consumption or opt for lower-cost alternatives, posing challenges to breweries to maintain sales and profitability atfloat.
Additionally, Poland's declining and aging population is constraining the overall size of the beer market. Decreasing numbers and older people with lower consumption of alcohol are increasing the impact of economic pressures. Breweries must handle price, new product development, and promotions delicately to navigate these structural constraints without losing brand loyalty and growth.
Unlock Market Intelligence
Explore the market potential with our data-driven report
Poland Beer Market TrendGrowing Demand for New Taste
Poland end users are exploring new experience and taste with beer, which is leading to growing demand for novelty flavors. Flavored beers, infused beers, and craft-sy beers are becoming increasingly popular as end users seek novelty and sophistication in beverages. This is a reflection of a larger shift in end user trends, wherein experimentation through taste and quality means more than conventional alternatives.
Breweries are addressing this with creative products, including fruit-flavored beers, reduced-sugar offerings, and specialty beers with intense flavor profiles. Brands that take on this phenomenon are better equipped to attract adventurous end users and remain relevant in a saturated marketplace. The focus on flavor innovation is gradually reshaping customer expectations, encouraging breweries to invest in creativity and product differentiation.
Unlock Market Intelligence
Explore the market potential with our data-driven report
Poland Beer Market Segmentation Analysis
By Product Type
- Dark Beer
- Lager
- Non/Low Alcohol Beer
- Stout
The segment with highest market share under Product Type is Lager at around 80% market share. Mid-range lager is the leading consumption in Poland due to its widespread availability in outlets, low price point, and balanced distribution in foodservice and retail channels. Brands like Tyskie, Lech, and Zubr retain end users through effective marketing, appealing packaging, and promotional support, reinforcing the role of lager as the everyday beer to drink.
Lager is expected to maintain its leading position during the forecasting period, while overall modestly declining beer sales. Growth in the segment will be fueled by flavoured and mixed lager development and increasing popularity of non/low alcohol types. Lager's quality, value, and versatility balance ensures that its leading share of the Poland beer market will endure.

By Sales Channel
- On-Trade
- Off-Trade
The segment with highest market share under Sales Channel is Off-Trade, with around 75% market share. Off-Trade includes discounters, convenience stores, and supermarkets, and they are the prime media for buying beer in Poland. Competitive prices, ongoing promotions, and convenience stimulate high volumes, with discounter players like Biedronka and Lidl being significant drivers of attracting price-conscious buyers.
Off-Trade is expected to continue to dominate the forecast period because most end users prefer buying beer for home consumption. The channel serves mainstream and premium beers as well as non/low alcohol ones, and therefore it is a core driver of the entire beer market. Convenience, wide product range, and value positioning are the bedrock of its dominance in Poland.
List of Companies Covered in Poland Beer Market
The companies listed below are highly influential in the Poland beer market, with a significant market share and a strong impact on industry developments.
- Perla Browary Lubelskie SA
- Lidl Polska Sklepy Spozywcze Sp zoo Sp k
- Browar Amber Sp zoo
- Kompania Piwowarska SA
- Grupa Zywiec Sp zoo
- Carlsberg Supply Co Polska SA
- Van Pur SA
- Jeronimo Martins Polska SA
- United Beverages SA
- Coca-Cola HBC Polska Sp zoo
Frequently Asked Questions
Related Report
1. Market Segmentation
1.1. Research Scope
1.2. Research Methodology
1.3. Definitions and Assumptions
2. Executive Summary
3. Poland Beer Market Policies, Regulations, and Standards
4. Poland Beer Market Dynamics
4.1. Growth Factors
4.2. Challenges
4.3. Trends
4.4. Opportunities
5. Poland Beer Market Statistics, 2022-2032F
5.1. Market Size & Growth Outlook
5.1.1.By Revenues in US$ Million
5.1.2.By Quantity Sold in Million Litres
5.2. Market Segmentation & Growth Outlook
5.2.1.By Product Type
5.2.1.1. Dark Beer- Market Insights and Forecast 2022-2032, USD Million
5.2.1.1.1. Ale- Market Insights and Forecast 2022-2032, USD Million
5.2.1.1.2. Sorghum Beer- Market Insights and Forecast 2022-2032, USD Million
5.2.1.1.3. Weissbier/Weizen/Wheat Beer- Market Insights and Forecast 2022-2032, USD Million
5.2.1.2. Lager- Market Insights and Forecast 2022-2032, USD Million
5.2.1.2.1. Flavoured/Mixed Lager- Market Insights and Forecast 2022-2032, USD Million
5.2.1.2.2. Standard Lager- Market Insights and Forecast 2022-2032, USD Million
5.2.1.2.2.1. Premium Lager- Market Insights and Forecast 2022-2032, USD Million
5.2.1.2.2.1.1. Domestic Premium Lager- Market Insights and Forecast 2022-2032, USD Million
5.2.1.2.2.1.2. Imported Premium Lager- Market Insights and Forecast 2022-2032, USD Million
5.2.1.2.2.2. Mid-Priced Lager- Market Insights and Forecast 2022-2032, USD Million
5.2.1.2.2.2.1. Domestic Mid-Priced Lager- Market Insights and Forecast 2022-2032, USD Million
5.2.1.2.2.2.2. Imported Mid-Priced Lager- Market Insights and Forecast 2022-2032, USD Million
5.2.1.2.2.3. Economy Lager- Market Insights and Forecast 2022-2032, USD Million
5.2.1.2.2.3.1. Domestic Economy Lager- Market Insights and Forecast 2022-2032, USD Million
5.2.1.2.2.3.2. Imported Economy Lager- Market Insights and Forecast 2022-2032, USD Million
5.2.1.3. Non/Low Alcohol Beer- Market Insights and Forecast 2022-2032, USD Million
5.2.1.3.1. Low Alcohol Beer- Market Insights and Forecast 2022-2032, USD Million
5.2.1.3.2. Non Alcoholic Beer- Market Insights and Forecast 2022-2032, USD Million
5.2.1.4. Stout- Market Insights and Forecast 2022-2032, USD Million
5.2.1.5. Others (Porter, Malt etc.) - Market Insights and Forecast 2022-2032, USD Million
5.2.2.By Production
5.2.2.1. Macro Brewery- Market Insights and Forecast 2022-2032, USD Million
5.2.2.2. Micro Brewery- Market Insights and Forecast 2022-2032, USD Million
5.2.2.3. Craft Brewery- Market Insights and Forecast 2022-2032, USD Million
5.2.3.By Packaging Type
5.2.3.1. Bottles- Market Insights and Forecast 2022-2032, USD Million
5.2.3.2. Cans- Market Insights and Forecast 2022-2032, USD Million
5.2.3.3. Others- Market Insights and Forecast 2022-2032, USD Million
5.2.4.By Sales Channel
5.2.4.1. On-Trade- Market Insights and Forecast 2022-2032, USD Million
5.2.4.2. Off-Trade- Market Insights and Forecast 2022-2032, USD Million
5.2.5.By Competitors
5.2.5.1. Competition Characteristics
5.2.5.2. Market Share & Analysis
6. Poland Dark Beer Market Statistics, 2022-2032F
6.1. Market Size & Growth Outlook
6.1.1.By Revenues in US$ Million
6.1.2.By Quantity Sold in Million Litres
6.2. Market Segmentation & Growth Outlook
6.2.1.By Product Type- Market Insights and Forecast 2022-2032, USD Million
6.2.2.By Production- Market Insights and Forecast 2022-2032, USD Million
6.2.3.By Packaging Type- Market Insights and Forecast 2022-2032, USD Million
6.2.4.By Sales Channel- Market Insights and Forecast 2022-2032, USD Million
7. Poland Lager Beer Market Statistics, 2022-2032F
7.1. Market Size & Growth Outlook
7.1.1.By Revenues in US$ Million
7.1.2.By Quantity Sold in Million Litres
7.2. Market Segmentation & Growth Outlook
7.2.1.By Product Type- Market Insights and Forecast 2022-2032, USD Million
7.2.2.By Production- Market Insights and Forecast 2022-2032, USD Million
7.2.3.By Packaging Type- Market Insights and Forecast 2022-2032, USD Million
7.2.4.By Sales Channel- Market Insights and Forecast 2022-2032, USD Million
8. Poland Non/Low Alcohol Beer Market Statistics, 2022-2032F
8.1. Market Size & Growth Outlook
8.1.1.By Revenues in US$ Million
8.1.2.By Quantity Sold in Million Litres
8.2. Market Segmentation & Growth Outlook
8.2.1.By Production- Market Insights and Forecast 2022-2032, USD Million
8.2.2.By Packaging Type- Market Insights and Forecast 2022-2032, USD Million
8.2.3.By Sales Channel- Market Insights and Forecast 2022-2032, USD Million
9. Poland Stout Beer Market Statistics, 2022-2032F
9.1. Market Size & Growth Outlook
9.1.1.By Revenues in US$ Million
9.1.2.By Quantity Sold in Million Litres
9.2. Market Segmentation & Growth Outlook
9.2.1.By Production- Market Insights and Forecast 2022-2032, USD Million
9.2.2.By Packaging Type- Market Insights and Forecast 2022-2032, USD Million
9.2.3.By Sales Channel- Market Insights and Forecast 2022-2032, USD Million
10. Competitive Outlook
10.1. Company Profiles
10.1.1. Kompania Piwowarska SA
10.1.1.1. Business Description
10.1.1.2. Product Portfolio
10.1.1.3. Collaborations & Alliances
10.1.1.4. Recent Developments
10.1.1.5. Financial Details
10.1.1.6. Others
10.1.2. Grupa Zywiec Sp zoo
10.1.2.1. Business Description
10.1.2.2. Product Portfolio
10.1.2.3. Collaborations & Alliances
10.1.2.4. Recent Developments
10.1.2.5. Financial Details
10.1.2.6. Others
10.1.3. Carlsberg Supply Co Polska SA
10.1.3.1. Business Description
10.1.3.2. Product Portfolio
10.1.3.3. Collaborations & Alliances
10.1.3.4. Recent Developments
10.1.3.5. Financial Details
10.1.3.6. Others
10.1.4. Van Pur SA
10.1.4.1. Business Description
10.1.4.2. Product Portfolio
10.1.4.3. Collaborations & Alliances
10.1.4.4. Recent Developments
10.1.4.5. Financial Details
10.1.4.6. Others
10.1.5. Jeronimo Martins Polska SA
10.1.5.1. Business Description
10.1.5.2. Product Portfolio
10.1.5.3. Collaborations & Alliances
10.1.5.4. Recent Developments
10.1.5.5. Financial Details
10.1.5.6. Others
10.1.6. Perla Browary Lubelskie SA
10.1.6.1. Business Description
10.1.6.2. Product Portfolio
10.1.6.3. Collaborations & Alliances
10.1.6.4. Recent Developments
10.1.6.5. Financial Details
10.1.6.6. Others
10.1.7. Lidl Polska Sklepy Spozywcze Sp zoo Sp k
10.1.7.1. Business Description
10.1.7.2. Product Portfolio
10.1.7.3. Collaborations & Alliances
10.1.7.4. Recent Developments
10.1.7.5. Financial Details
10.1.7.6. Others
10.1.8. Browar Amber Sp zoo
10.1.8.1. Business Description
10.1.8.2. Product Portfolio
10.1.8.3. Collaborations & Alliances
10.1.8.4. Recent Developments
10.1.8.5. Financial Details
10.1.8.6. Others
10.1.9. United Beverages SA
10.1.9.1. Business Description
10.1.9.2. Product Portfolio
10.1.9.3. Collaborations & Alliances
10.1.9.4. Recent Developments
10.1.9.5. Financial Details
10.1.9.6. Others
10.1.10. Coca-Cola HBC Polska Sp zoo
10.1.10.1.Business Description
10.1.10.2.Product Portfolio
10.1.10.3.Collaborations & Alliances
10.1.10.4.Recent Developments
10.1.10.5.Financial Details
10.1.10.6.Others
11. Disclaimer
| Segment | Sub-Segment |
|---|---|
| By Product Type |
|
| By Production |
|
| By Packaging Type |
|
| By Sales Channel |
|
Research Methodology
This study followed a structured approach comprising four key phases to assess the size and scope of the electro-oxidation market. The process began with thorough secondary research to collect data on the target market, related markets, and broader industry context. These findings, along with preliminary assumptions and estimates, were then validated through extensive primary research involving industry experts from across the value chain. To calculate the overall market size, both top-down and bottom-up methodologies were employed. Finally, market segmentation and data triangulation techniques were applied to refine and validate segment-level estimations.
Secondary Research
The secondary research phase involved gathering data from a wide range of credible and published sources. This step helped in identifying industry trends, defining market segmentation, and understanding the market landscape and value chain.
Sources consulted during this phase included:
- Company annual reports, investor presentations, and press releases
- Industry white papers and certified publications
- Trade directories and market-recognized databases
- Articles from authoritative authors and reputable journals
- Gold and silver standard websites
Secondary research was critical in mapping out the industry's value chain and monetary flow, identifying key market segments, understanding regional variations, and tracking significant industry developments.
Other key sources:
- Financial disclosures
- Industry associations and trade bodies
- News outlets and business magazines
- Academic journals and research studies
- Paid industry databases
Primary Research
To validate secondary data and gain deeper market insights, primary research was conducted with key stakeholders across both the supply and demand sides of the market.
On the demand side, participants included decision-makers and influencers from end-user industries—such as CIOs, CTOs, and CSOs—who provided first-hand perspectives on market needs, product usage, and future expectations.
On the supply side, interviews were conducted with manufacturers, industry associations, and institutional participants to gather insights into current offerings, product pipelines, and market challenges.
Primary interviews provided critical inputs such as:
- Market size and revenue data
- Product and service breakdowns
- Market forecasts
- Regional and application-specific trends
Stakeholders consulted included:
- Leading OEM and solution providers
- Channel and distribution partners
- End users across various applications
- Independent consultants and industry specialists
Market Size Estimation and Data Triangulation
- Identifying Key Market Participants (Secondary Research)
- Goal: To identify the major players or companies in the target market. This typically involves using publicly available data sources such as industry reports, market research publications, and financial statements of companies.
- Tools: Reports from firms like Gartner, Forrester, Euromonitor, Statista, IBISWorld, and others. Public financial statements, news articles, and press releases from top market players.
- Extracting Earnings of Key Market Participants
- Goal: To estimate the earnings generated from the product or service being analyzed. This step helps in understanding the revenue potential of each market player in a specific geography.
- Methods: Earnings data can be gathered from:
- Publicly available financial reports (for listed companies).
- Interviews and primary data sources from professionals, such as Directors, VPs, SVPs, etc. This is especially useful for understanding more nuanced, internal data that isn't publicly disclosed.
- Annual reports and investor presentations of key players.
- Data Collation and Development of a Relevant Data Model
- Goal: To collate inputs from both primary and secondary sources into a structured, data-driven model for market estimation. This model will incorporate key market KPIs and any independent variables relevant to the market.
- Key KPIs: These could include:
- Market size, growth rate, and demand drivers.
- Industry-specific metrics like market share, average revenue per customer (ARPC), or average deal size.
- External variables, such as economic growth rates, inflation rates, or commodity prices, that could affect the market.
- Data Modeling: Based on this data, the market forecasts are developed for the next 5 years. A combination of trend analysis, scenario modeling, and statistical regression might be used to generate projections.
- Scenario Analysis
- Goal: To test different assumptions and validate how sensitive the market is to changes in key variables (e.g., market demand, regulatory changes, technological disruptions).
- Types of Scenarios:
- Base Case: Based on current assumptions and historical data.
- Best-Case Scenario: Assuming favorable market conditions, regulatory environments, and technological advancements.
- Worst-Case Scenario: Accounting for adverse factors, such as economic downturns, stricter regulations, or unexpected disruptions.


