Global Plant-Based Dairy Market Report: Trends, Growth and Forecast (2025-2030)
By Product Type (Plant-Based Milk, Plant-Based Cheese, Plant-Based Yoghurt), By Nature (Organic, Natural, Conventional), By End User (Individual Consumption, Food Processing Industries, Bakery & Confectionery, Snacks & Savouries, Ready Meals, HoReCa, Others), By Sales Channel (Offline, Ecommerce), By Region (North America, South America, Europe, The Middle East & Africa, Asia-Pacific) ... Read more
|
Major Players
|
Global Plant-Based Dairy Market Statistics and Insights, 2025
- Market Size Statistics
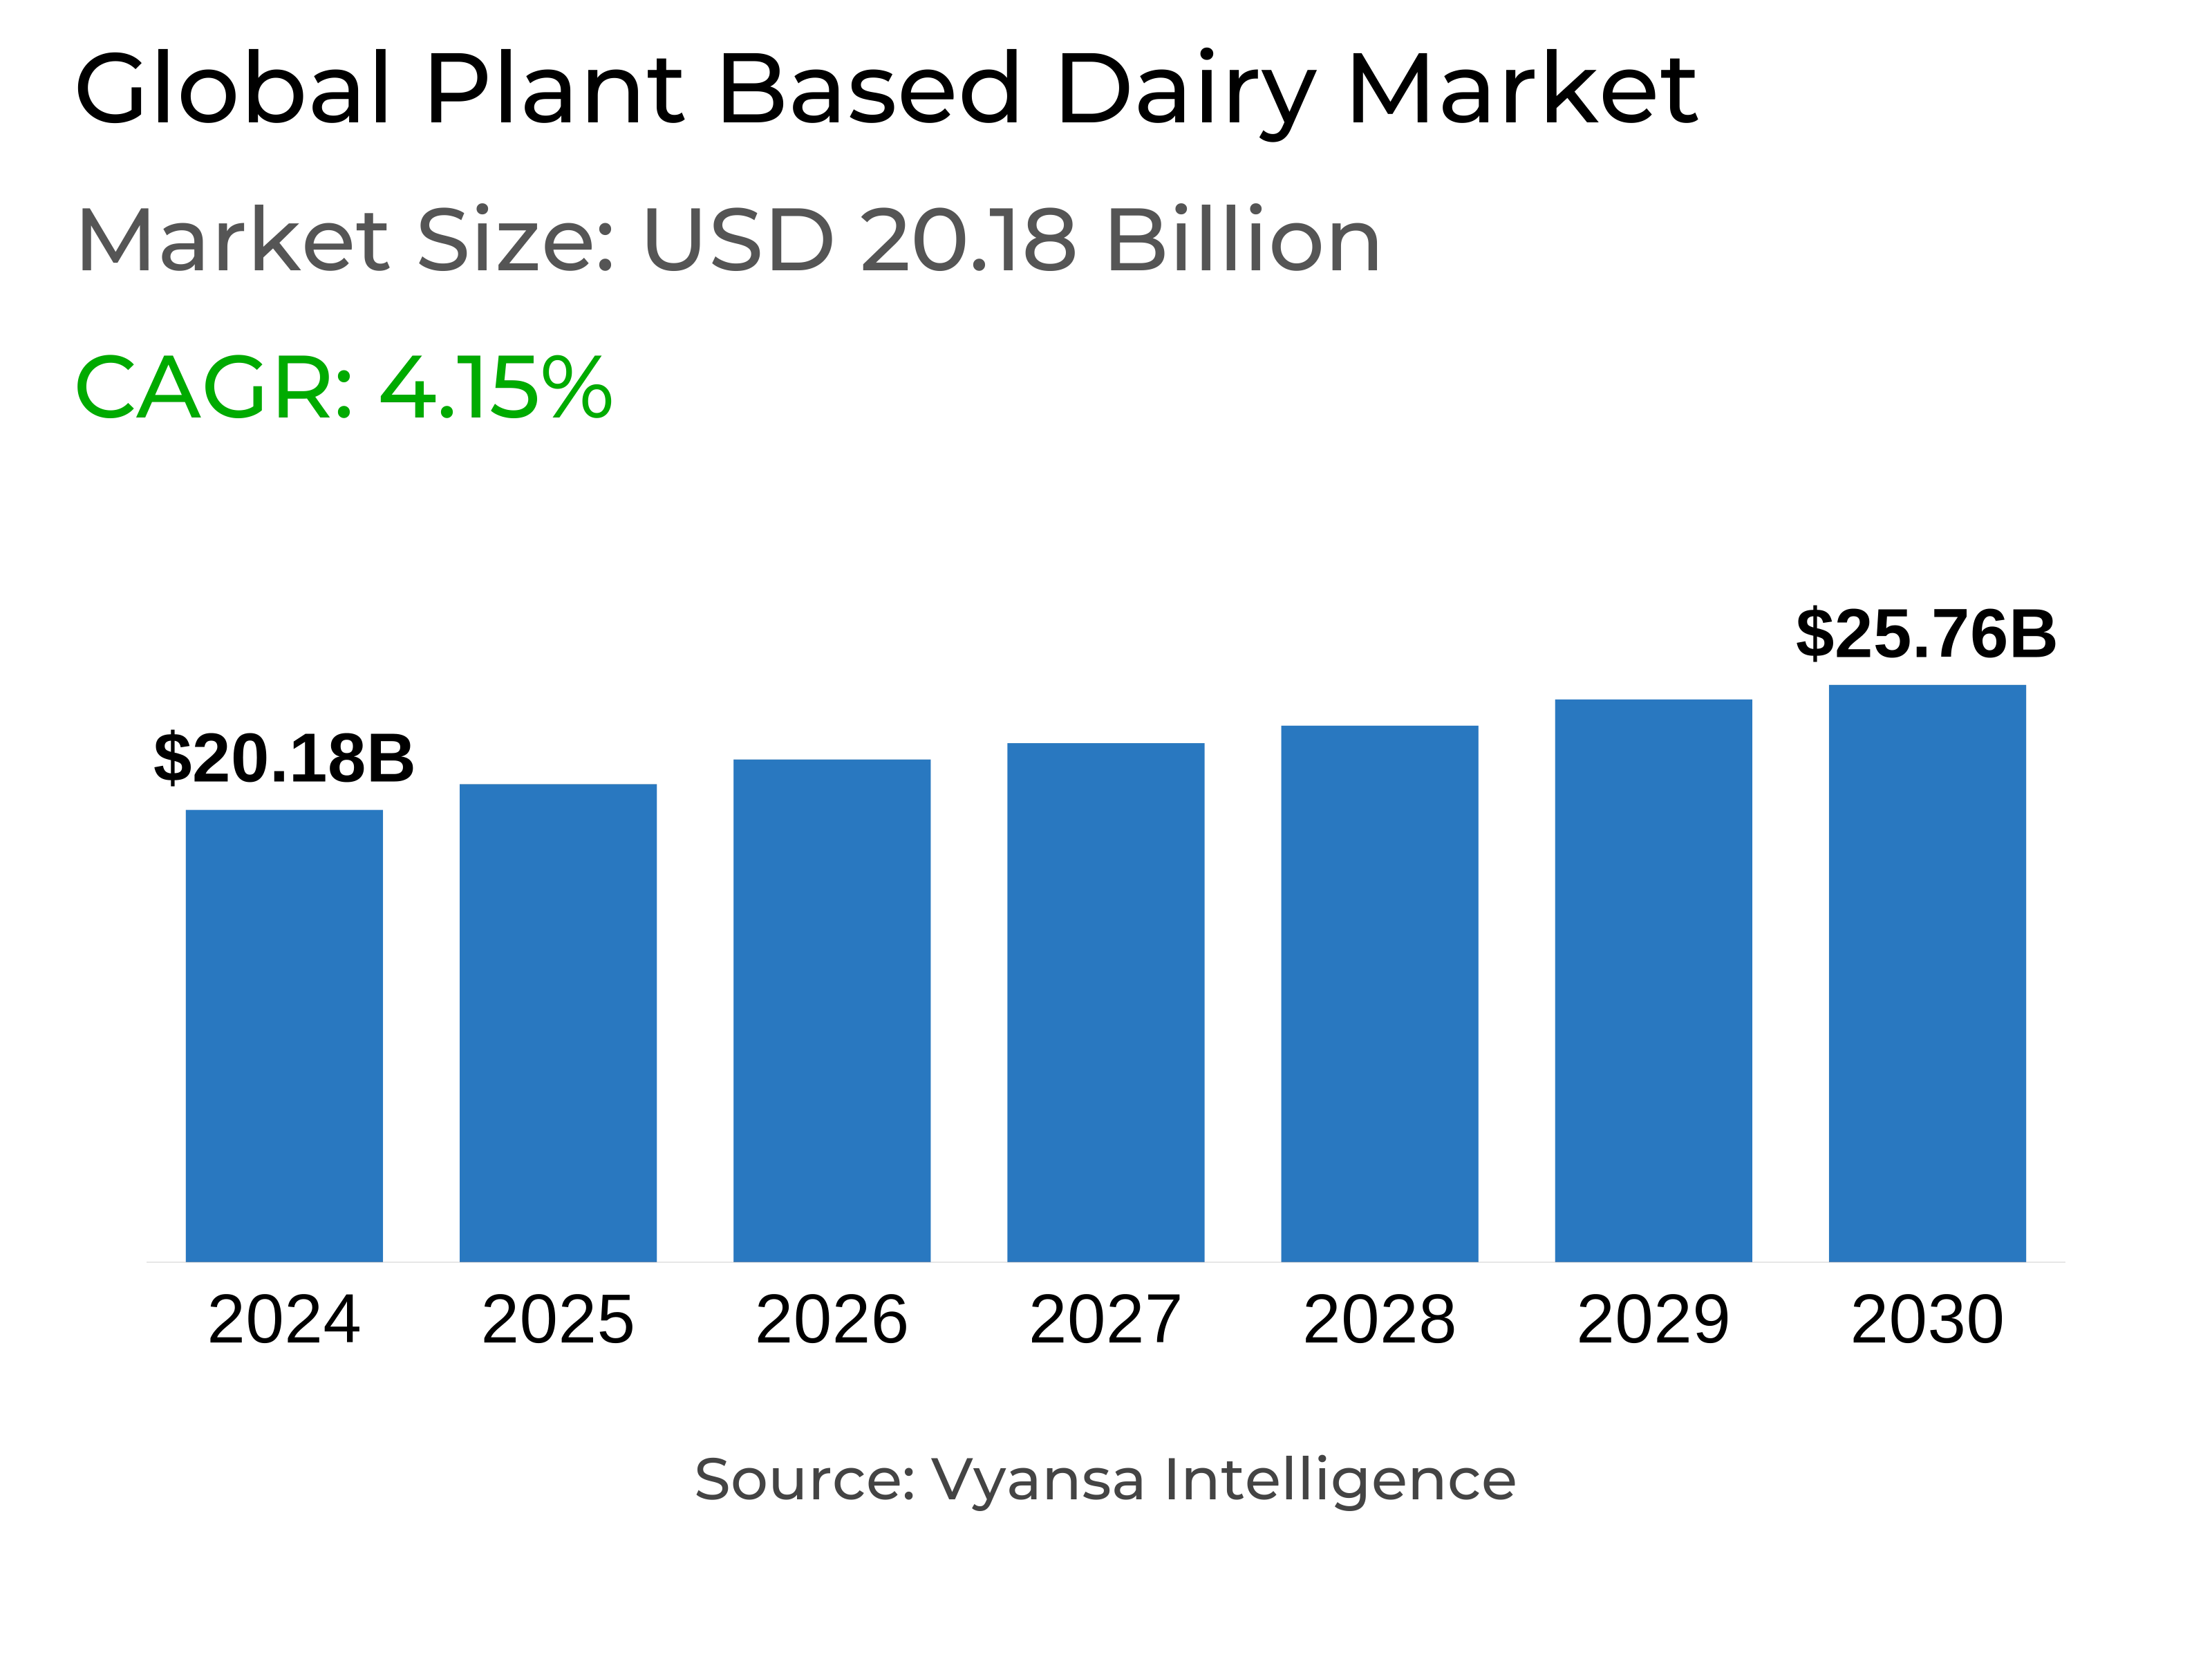
- Global Plant-Based Dairy Market is estimated at $ 20.18 Billion.
- The market size is expected to grow to $ 25.76 Billion by 2030.
- Market to register a CAGR of around 4.15% during 2025-30.
- Product Type Shares
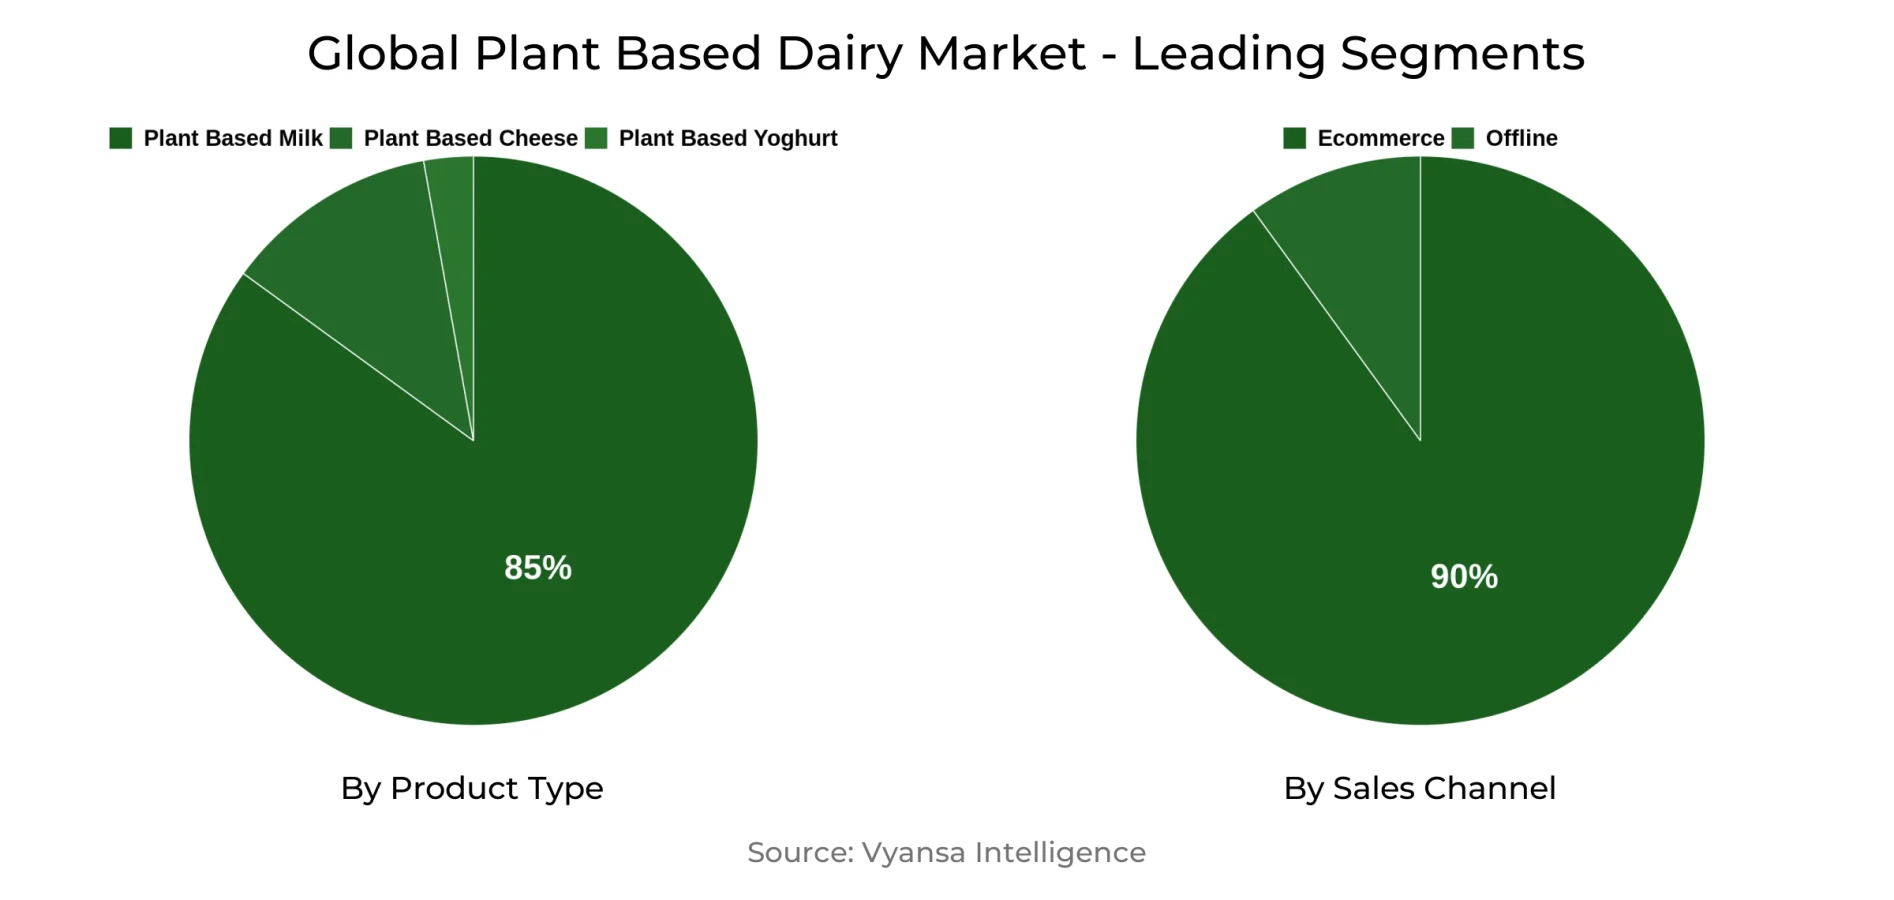
- Plant-Based Milk grabbed market share of 85%.
- Competition
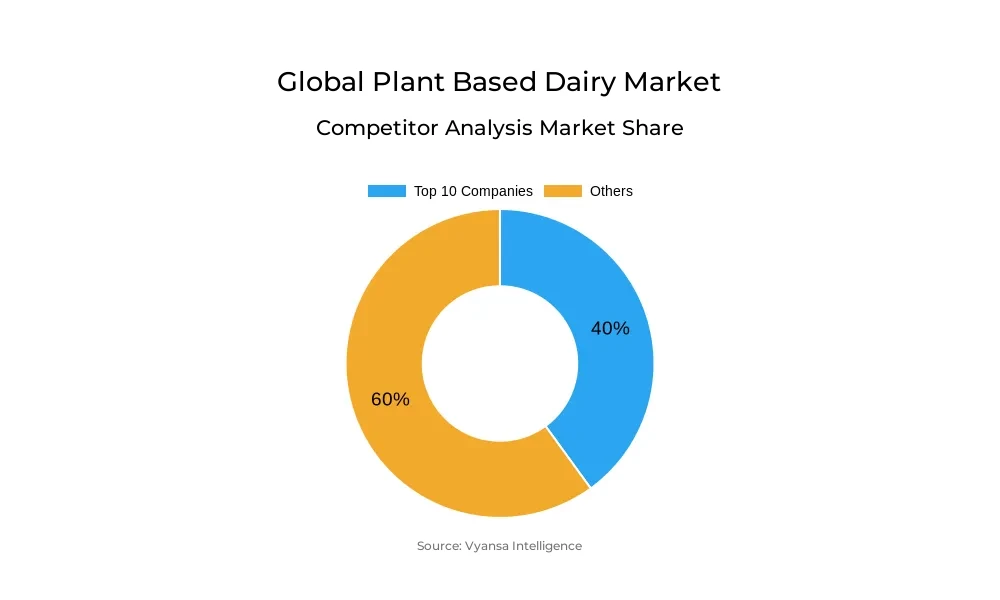
- More than 150 companies are actively engaged in producing Plant-Based Dairy in Global.
- Top 10 companies acquired 40% share of the market.
- Hebei Yangyuan Zhihui Beverage, Oatly Group, Coconut Palm, Blue Diamond Growers, Lactasoy Co etc., are few of the top companies.
- Sales Channel
- Online grabbed 90% of the market.
- Region
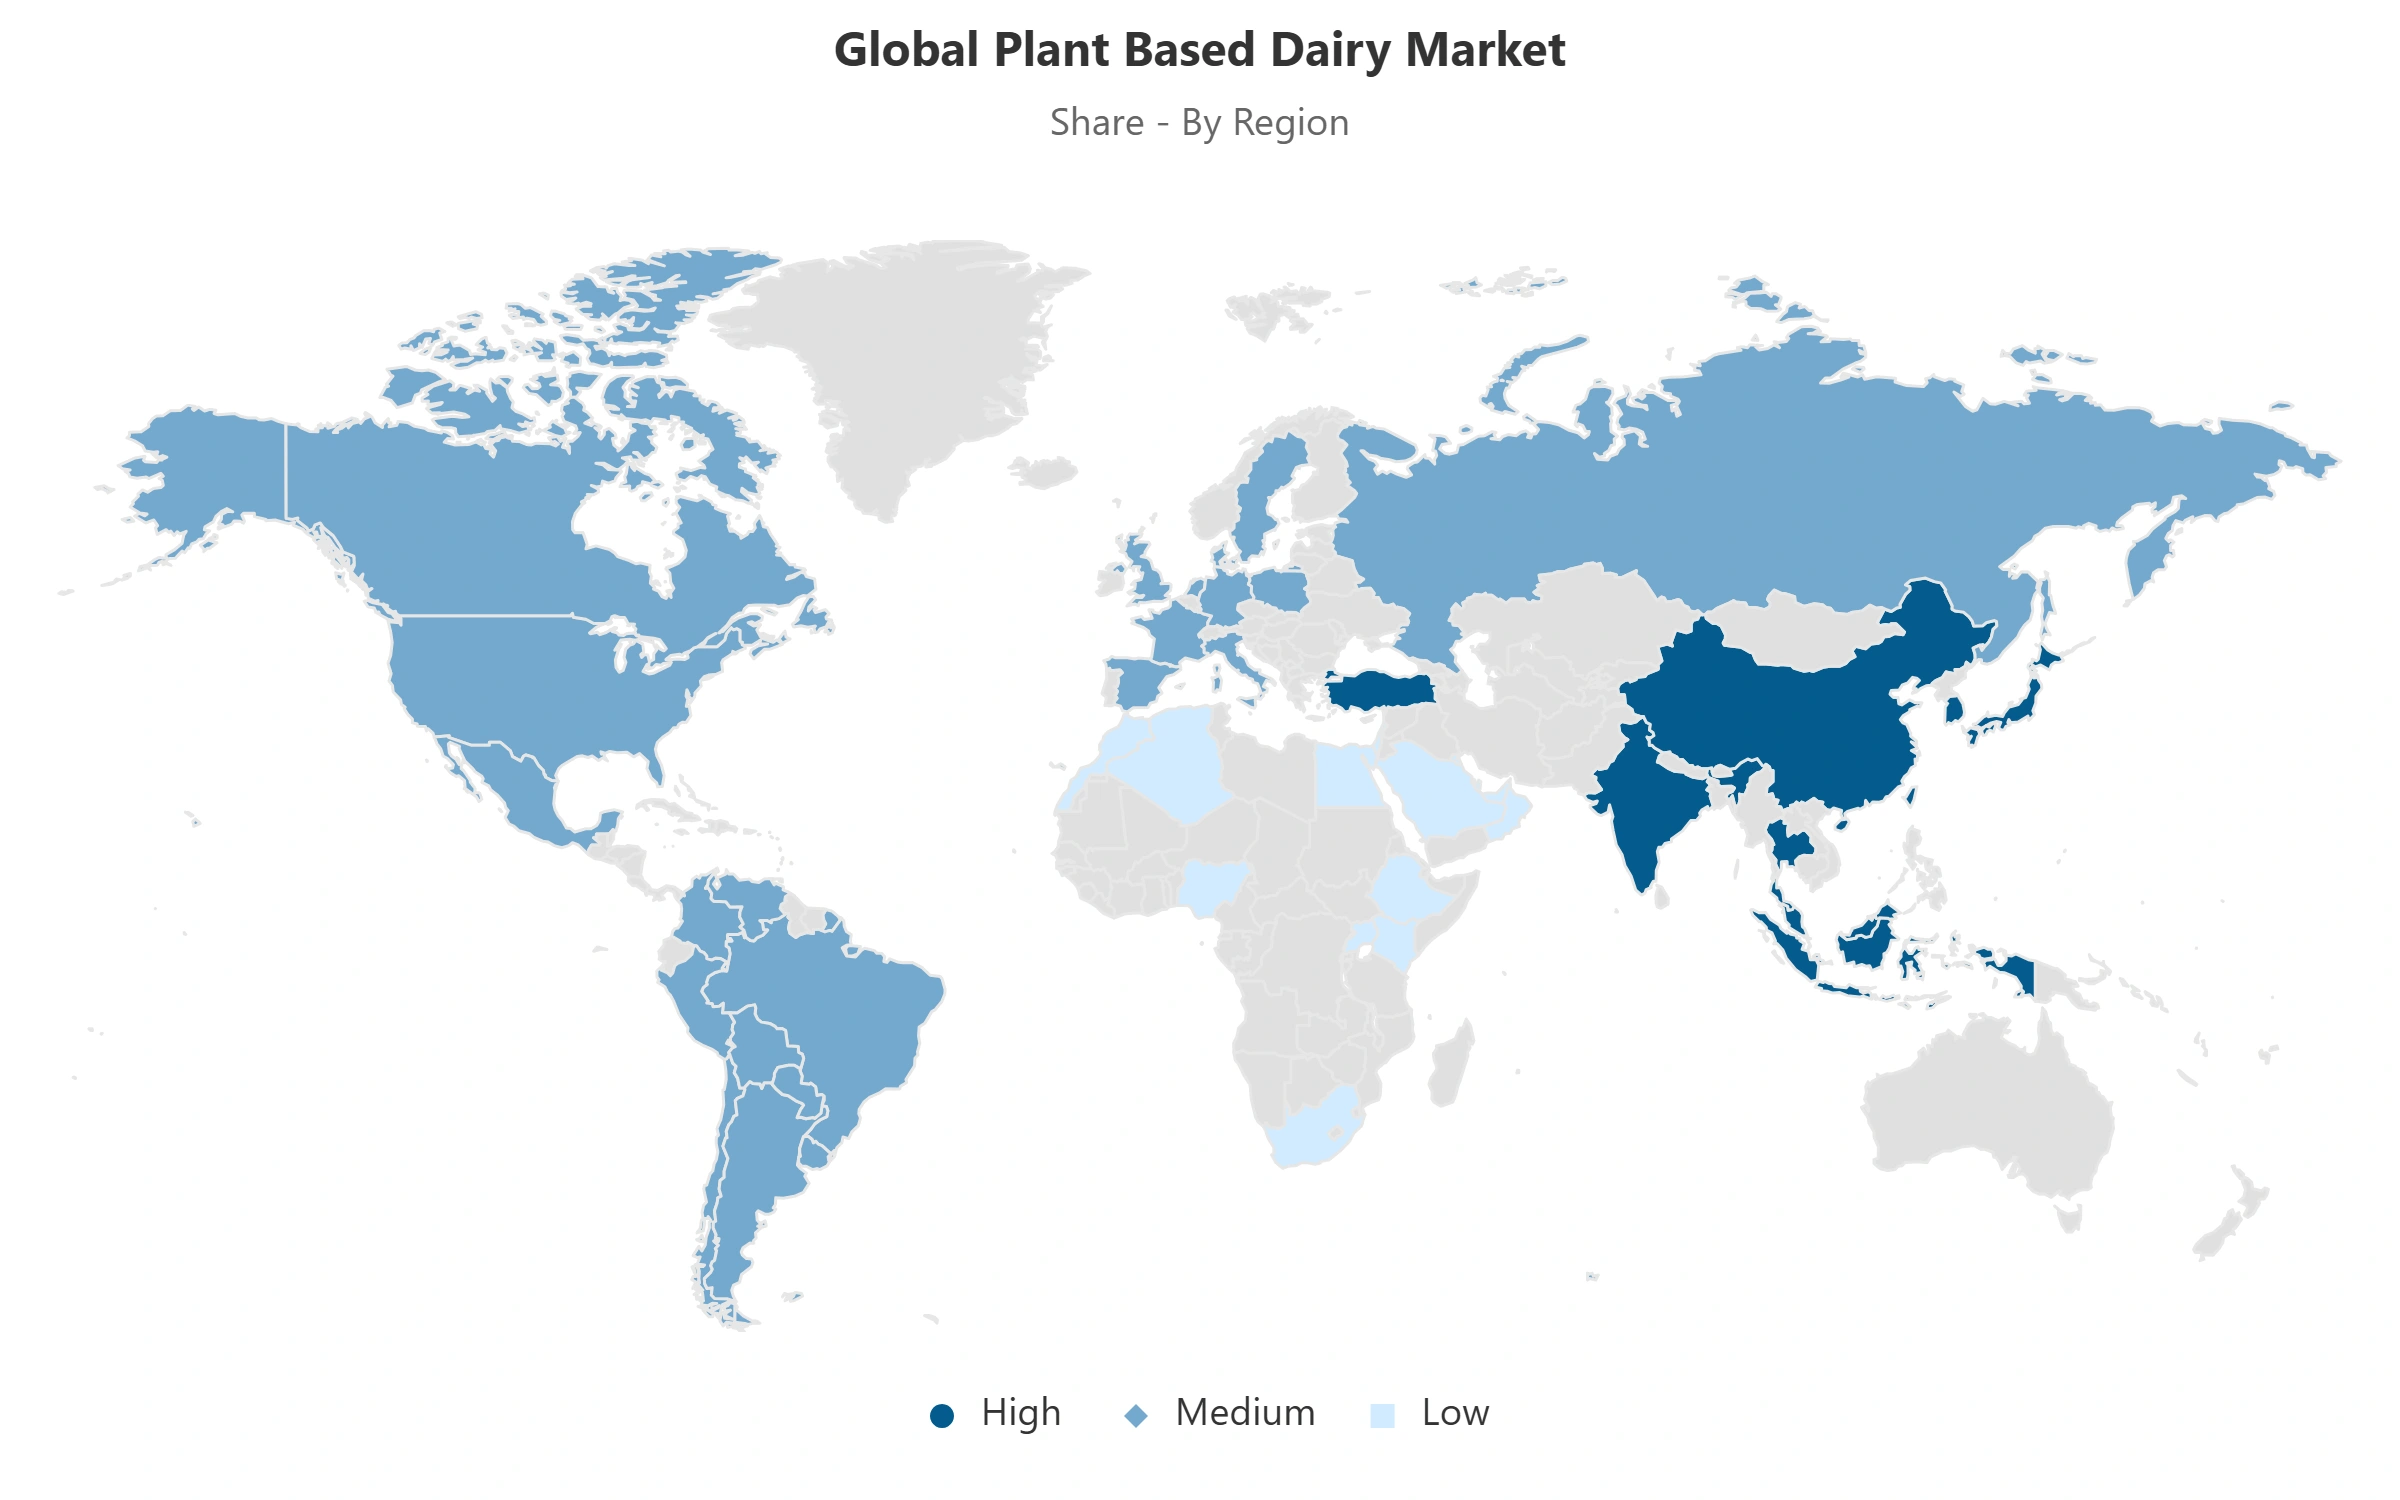
- Asia-Pacific leads with ~40% of the global market.
- Europe is the fastest growing region with a CAGR of approximately 6.96% for 2025-30.
- China and the US are the largest markets across the globe with a cumulative market share of around 40%.
- China is set to grow at CAGR of around 2.03%, while the US will register yoy growth of 1.88% during 2025-30.
Global Plant-Based Dairy Market Outlook
The Global Plant-Based Dairy Market is projected to expand from USD 20.18 billion in 2024 to USD 25.76 billion by 2030, reflecting a 5% CAGR. The major factors contributing to the growth in lactose intolerant population, health consciousness among individuals, growth in venture capital funding, evolving consumer preferences especially gen Z population inclined towards Flexitarianism. Moreover, growing concern towards animal cruelty is also pushing the end users towards adoption of plant based dairy products.
According to US National Institute of Health, the prevalence of lactose intolerance affects nearly 65% of the global adult population, equivalent to more than 5 billion worldwide. This condition, which causes digestive discomfort upon consuming traditional dairy, continues to generate a substantial and consistent addressable consumer base for plant-based alternatives, thereby reinforcing market expansion. The regional lactose intolerance distribution patterns directly correlate with plant based dairy market penetration and growth rates. In North America, around 15% of white Americans, 53% of Mexican-Americans and 80% of African-Americans are lactose intolerant. While, European prevalence averages 28% in western, southern, and northern regions.
The venture capital funding is one the major growth factor catalzying the market growth. With over 100 investment transactions deploying USD 550+ million during 2020-2025, the institutional confidence category’s potential is unrelenting. The concentration of 65% funding toward United States based companies has accelerated domestic innovation capabilities while enabling technology transfer across global markets. Moreover, the countries like Singapore, India, South Korea and Western Europe are also emerging as hotspots for venture investments in plant based dairy market. Major investors including Prelude Ventures, S2G Ventures, Google Ventures, and Khosla Ventures are few of the top vibrant investors supporting this market.
Health consciousness among millennials and GenZ, especially towards cardiovascular benefits associated with plant based dairy is soaring. As plant based dairy products demonstrate lower risks of incident cardiovascular disease and all-cause mortality among middle aged adults, institutional adoption across healthcare facilities and corporate wellness programs is also surging.
Global Plant-Based Dairy Market Growth Driver
A major driver behind the expansion of the plant-based dairy market is the global shift toward flexitarianism, particularly among younger generations. According to ADM’s 2025 Alternative Protein Landscape Report, 46% of global consumers now identify as flexitarian—individuals who consciously reduce their intake of animal products while incorporating plant-based alternatives (Green Queen, 2025). The same report highlights that 75% of consumers worldwide are interested in plant-based meat and dairy options, reflecting growing mainstream acceptance.
This shift is even more pronounced among younger demographics. A consumer survey cited by Supermarket News (2022) found that 65% of Gen Z respondents said they want to follow a more plant-forward diet, 79% reported going meatless at least once per week, and 87% stated they could be convinced to purchase plant-based alternatives. These findings are supported by additional research published by Xtalks in 2022, confirming Gen Z’s strong alignment with health, sustainability, and ethical food values. As flexitarianism continues to gain momentum, particularly among Gen Z and Millennials, it is reshaping consumer behavior and driving sustained growth in the plant-based dairy sector, pushing it from niche to mainstream.
Global Plant-Based Dairy Market Challenge
A critical challenge threatening the stability and scalability of the global plant-based dairy market lies in raw material procurement complexities and cost volatility. Core ingredients such as almonds, oats, coconut, and peas are highly susceptible to climatic variability and regional yield fluctuations. For example, almond production in California, which supplies approximately 80% of the world’s almonds, is increasingly vulnerable to drought and extreme weather events, causing price spikes of up to 30% year-over-year during adverse seasons (USDA, 2024). Similarly, oat yields in major producing regions like Canada and Europe have fluctuated by 10-15% in recent years due to changing weather patterns, as reported by Food and Agriculture Organization (FAO).
These agricultural input uncertainties, combined with global supply chain disruptions and rising international logistics costs including freight rates surged over 50% during 2021-2024, according to the World Bank. These events contributed to volatile raw material costs for plant-based dairy manufacturers. This cost unpredictability compresses operational margins, forcing some companies to increase retail prices, which threatens price parity with conventional dairy products. Price sensitivity remains a major factor, with surveys showing that over 60% of consumers in key markets (US, UK, EU) consider price a primary barrier to adopting plant-based dairy alternatives.
Unlock Market Intelligence
Explore the market potential with our data-driven report
Global Plant-Based Dairy Market Trend
The plant-based dairy market is rapidly shifting toward oat-based products, which have seen sales growth exceeding 37% globally over recent years. In Germany, oat milk dominates the plant-based dairy category, capturing more than 56% of consumer preference, driven by strong sustainability concerns and excellent compatibility with coffee culture. Meanwhile, France is experiencing a significant cannibalization of almond-based milk as consumers increasingly shift toward oat milk, which is growing at an annual rate of approximately 28%, supported by improvements in taste and texture. Nutritional fortification has become widespread, with over 60% of new plant-based dairy products now fortified with calcium, vitamin D, and protein to closely match or exceed traditional dairy nutrition. High-protein varieties, favored by fitness-focused consumers, contribute to a 25% increase in fortified product sales globally.
Packaging innovations further drive growth, with more than 70% of plant-based dairy products using recyclable materials and prominently featuring nutrition and sustainability information on packaging. These developments have broadened plant-based dairy usage occasions beyond beverages to cooking, fitness nutrition, and family meals, leading to higher repeat purchase rates. Together, these trends improve price realization and market resilience, supporting the category’s expansion beyond early adopters to mass-market acceptance, with strong growth expected to continue in coming years. Companies focusing on oat-based innovation, advanced fortification, and sustainable packaging are best positioned to capitalize on this expanding market.
Global Plant-Based Dairy Market Opportunity
Globally, consumers are increasingly demanding transparency, sustainability, and ethical practices from the brands they support, especially in the plant-based dairy sector. Based on Vyansa survey 24% of consumers worldwide are willing to pay a premium for products that demonstrate strong commitments to animal welfare, environmental sustainability, and ethical sourcing. This shift presents a compelling opportunity for plant-based dairy companies to differentiate themselves in a rapidly expanding market by integrating ethical values at the core of their branding and product development. Internationally recognized brands are leading the way by highlighting sustainability initiatives such as carbon-neutral manufacturing, regenerative agriculture partnerships, and clean-label formulations. This approach perfectly resonates with diverse consumer segments, from environmentally conscious Millennials and Gen Z in North America, China and Europe to emerging middle-class consumers in Asia-Pacific who prioritize health and social responsibility.
Oatly emphasizes its climate-positive practices and transparent communication on sustainability impacts, which has helped it become a top-selling plant-based milk brand in Europe, North America, and parts of Asia Pacific. While, Califia Farms, with distribution across North America, Europe, and Australia, Califia Farms highlights ethical ingredient sourcing and eco-friendly packaging as pillars of its premium positioning. Moreover, Miyoko’s Creamery is known globally for its artisanal vegan cheeses. It combines ethical values with gourmet product innovation to command premium pricing. By embedding ethical branding and premium positioning into their global strategies, plant-based dairy companies can capture growing consumer willingness to pay for sustainability, foster brand loyalty across markets, and secure a competitive edge in the estimated USD 25+ billion plant-based dairy market projected by 2030.
| Report Coverage | Details |
|---|---|
| Market Forecast | 2025-30 |
| USD Value 2024 | $ 20.18 Billion |
| USD Value 2030 | $ 25.76 Billion |
| CAGR 2025-2030 | 4.15% |
| Largest Category | Plant-Based Milk segment leads with 85% market share |
| Top Drivers | Changing Consumer Preferences Are Accelerating Plant-Based Dairy Growth |
| Top Challenges | Ethical Branding and Premium Positioning of Plant-Based Dairy Products |
| Top Trends | Raw Material Supply Volatility and Cost Pressures Impacting Plant-Based Dairy Growth |
| Top Opportunities | Oat-Based Products and Nutritional Fortification Drive Market Evolution |
| Key Players | Hebei Yangyuan Zhihui Beverage, Oatly Group, Coconut Palm, Blue Diamond Growers, Lactasoy Co, Vitasoy International Holdings, Wanxiang Sannong, Danone, Coca-Cola, Kikkoman, Fujian Dali Food, Green Spot Co, Califia Farms, Flora Food Group, Marusanai and Others. |
Global Plant-Based Dairy Market Regional Analysis
By Region
- North America
- South America
- Europe
- The Middle East & Africa
- Asia-Pacific
Asia-Pacific dominates the global plant based dairy landscape with USD 8.64 billion in 2025 expanding to USD 10.35 billion by 2030, representing 43% of total global market value and demonstrating steady 3.68% CAGR. China anchors regional leadership as the single largest national market worldwide, supported by exceptional beverage integration in daily consumption routines and comprehensive modern trade penetration across urban population centers exceeding 900 million consumers. China dominated the regional sales with more than 55% of the regional market share. Chinese market dynamics exhibit steady CAGR of 2.03%, signaling category maturity in beverage segments while gradual improvement patterns emerge in spoonable categories including yogurt and cheese alternatives. This measured growth trajectory reflects established consumer acceptance and market saturation in primary urban markets, while expansion opportunities concentrate in tier 2 and tier 3 cities where modern retail infrastructure continues developing and disposable income growth supports premium food category adoption. Southeast Asian markets demonstrate exceptional dynamism shaped by coconut milk leadership, extensive culinary acceptance spanning generations, and rapid urbanization processes that create expanding middle class consumer segments. Indonesia emerges among the fastest growing economies at 18% CAGR through 2030, supported by rising household incomes, expanding modern retail footprint, and government initiatives promoting food security through domestic food processing capability development. The Indonesian government's USD 125 million sustainable agriculture program specifically supports alternative protein manufacturing infrastructure that benefits plant based dairy production capacity.
India showcases remarkable double digit growth at 12% CAGR driven by health conscious urban consumers, expanding foodservice channel acceptance, and active food technology startup ecosystem that extends online availability across metropolitan markets. Traditional vegetarian consumption patterns create natural consumer affinity for plant based alternatives, while government nutrition security initiatives allocate USD 89 million toward food processing innovation that includes plant based dairy manufacturing support. Supply chain advantages stem from geographic proximity to key ingredient production zones including coconut cultivation areas and expanding oat and pea processing capabilities across select markets that reduce logistics costs and improve supply chain reliability. Modern retail infrastructure development supported by international development bank funding creates improved distribution reach while online grocery platform advancement enhances metropolitan area accessibility. The combination of massive consumer base in China, accelerating growth in India and Indonesia, and stable expansion across Southeast Asian economies positions Asia-Pacific to sustain largest regional market share through 2030.
Unlock Market Intelligence
Explore the market potential with our data-driven report
Global Plant-Based Dairy Market Segmentation Analysis
By Product Type
- Plant-Based Milk
- Plant-Based Cheese
- Plant-Based Yoghurt
Plant-based milk has firmly established itself as the dominant segment, capturing approximately 85% market share of the plant-based dairy market globally. This commanding position is supported by a household penetration rate exceeding 50% in North America and Western Europe, driven by frequent daily consumption occasions and widespread availability across both chilled and ambient retail channels. The segment’s natural fit within established consumer routines such as coffee and tea preparation, cereal accompaniment, and cooking requires minimal behavioral change, facilitating smooth adoption from traditional dairy.In the US, health and wellness concerns, including lactose intolerance and demand for lower-calorie, cholesterol-free options, play a major role, with over 65% of consumers citing health benefits as a key motivator. Environmental awareness also influences nearly 50% of the American buyers, while innovation in flavors and formulations. Moreover, broad availability across retail and foodservice channels, further accelerates adoption, especially among Millennials and Gen Z. In China, high lactose intolerance rates affecting up to 90% of the population, combined with a growing health-conscious middle class, fuel demand for digestible, fortified plant-based alternatives. Rapid urbanization and expanding modern retail formats enhance accessibility, while government support for plant-based proteins and a booming coffee culture increase interest in barista-quality options.
Additionally, China’s dynamic e-commerce landscape and social media-driven marketing effectively drive consumer education and trial, making plant-based milk an increasingly mainstream choice in both markets. Distinct regional preferences highlight sophisticated consumer segmentation beyond Asia and Germany. In Latin America, for example, plant-based milk sales grew by over 20% annually between 2021 and 2024, reflecting growing health consciousness and expanding distribution networks. Similarly, the Middle East and Africa region is projected to achieve a compound annual growth rate of 15% through 2030, driven by younger demographics seeking dairy alternatives due to lactose intolerance and dietary preferences.
By Sales Channel
- Offline
- Ecommerce
While offline retail dominates with 90% market share, plant-based dairy is experiencing a significant shift toward digital channels. Offline retail benefits from entrenched shopping habits, easy access to chilled products, and effective promotions. Supermarkets and Hypermarkets which grabs more than 80% market share of offline retail allocate prime shelf space for plant-based alternatives, driving product discovery and cross-category sales.However, e-commerce is rapidly expanding. In the US and Canada, plant-based dairy e-commerce grows at 12% annually, fueled by subscription models and direct consumer engagement. Europe (especially France and Benelux) is also seeing accelerated online growth, driven by improved last-mile delivery and consumer trust in purchasing perishables digitally.
Moreover, the rise of digital-first brands in Asia Pacific and Europe, which often offer exclusive online products or limited-time offers, adds a layer of exclusivity that appeals to savvy consumers. As logistical innovations, such as efficient last-mile delivery and improved cold chain infrastructure, continue to evolve, plant-based dairy companies are able to meet demand with fresh, high-quality products, reinforcing the appeal of online shopping for these items. The companies operating in the market are gradually adopting an omnichannel strategy, balancing offline presence with digital-exclusive offerings and direct consumer relationships. While offline channels will still account for over 85% of market share by 2030, online growth will continue due to consumer insights, personalized marketing, and real-time feedback driving innovation.
Top Companies in Global Plant-Based Dairy Market
The top companies operating in the market include Hebei Yangyuan Zhihui Beverage, Oatly Group, Coconut Palm, Blue Diamond Growers, Lactasoy Co, Vitasoy International Holdings, Wanxiang Sannong, Danone, Coca-Cola, Kikkoman, Fujian Dali Food, Green Spot Co, Califia Farms, Flora Food Group, Marusanai, etc., are the top players operating in the Global Plant-Based Dairy Market.
Frequently Asked Questions
Related Report
1. Market Segmentation
1.1. Research Scope
1.2. Research Methodology
1.3. Definitions and Assumptions
2. Executive Summary
3. Global Plant-Based Dairy Market Policies, Regulations, and Standards
4. Global Plant-Based Dairy Market Dynamics
4.1. Growth Factors
4.2. Challenges
4.3. Trends
4.4. Opportunities
5. Global Plant-Based Dairy Market Statistics, 2020-2030F
5.1. Market Size & Growth Outlook
5.1.1.By Revenues in US$ Million
5.2. Market Segmentation & Growth Outlook
5.2.1.By Product Type
5.2.1.1. Plant-Based Milk- Market Insights and Forecast 2020-2030, USD Million
5.2.1.1.1. Soy- Market Insights and Forecast 2020-2030, USD Million
5.2.1.1.2. Almond- Market Insights and Forecast 2020-2030, USD Million
5.2.1.1.3. Oat- Market Insights and Forecast 2020-2030, USD Million
5.2.1.1.4. Coconut- Market Insights and Forecast 2020-2030, USD Million
5.2.1.1.5. Rice- Market Insights and Forecast 2020-2030, USD Million
5.2.1.1.6. Blends- Market Insights and Forecast 2020-2030, USD Million
5.2.1.1.7. Others- Market Insights and Forecast 2020-2030, USD Million
5.2.1.2. Plant-Based Cheese- Market Insights and Forecast 2020-2030, USD Million
5.2.1.3. Plant-Based Yoghurt- Market Insights and Forecast 2020-2030, USD Million
5.2.2.By Nature
5.2.2.1. Organic- Market Insights and Forecast 2020-2030, USD Million
5.2.2.2. Natural- Market Insights and Forecast 2020-2030, USD Million
5.2.2.3. Conventional- Market Insights and Forecast 2020-2030, USD Million
5.2.3.By End User
5.2.3.1. Individual Consumption- Market Insights and Forecast 2020-2030, USD Million
5.2.3.2. Food Processing Industries- Market Insights and Forecast 2020-2030, USD Million
5.2.3.3. Bakery & Confectionery- Market Insights and Forecast 2020-2030, USD Million
5.2.3.4. Snacks & Savouries- Market Insights and Forecast 2020-2030, USD Million
5.2.3.5. Ready Meals- Market Insights and Forecast 2020-2030, USD Million
5.2.3.6. HoReCa- Market Insights and Forecast 2020-2030, USD Million
5.2.3.7. Others- Market Insights and Forecast 2020-2030, USD Million
5.2.4.By Sales Channel
5.2.4.1. Offline- Market Insights and Forecast 2020-2030, USD Million
5.2.4.2. Ecommerce- Market Insights and Forecast 2020-2030, USD Million
5.2.5.By Region
5.2.5.1. North America
5.2.5.2. South America
5.2.5.3. Europe
5.2.5.4. The Middle East & Africa
5.2.5.5. Asia-Pacific
5.2.6.By Competitors
5.2.6.1. Competition Characteristics
5.2.6.2. Market Share & Analysis
6. North America Plant-Based Dairy Market Statistics, 2020-2030F
6.1. Market Size & Growth Outlook
6.1.1.By Revenues in US$ Million
6.2. Market Segmentation & Growth Outlook
6.2.1.By Product Type- Market Insights and Forecast 2020-2030, USD Million
6.2.2.By Nature- Market Insights and Forecast 2020-2030, USD Million
6.2.3.By End User- Market Insights and Forecast 2020-2030, USD Million
6.2.4.By Sales Channel- Market Insights and Forecast 2020-2030, USD Million
6.2.5.By Country
6.2.5.1. The US
6.2.5.2. Canada
6.2.5.3. Mexico
6.3. The US Plant-Based Dairy Market Statistics, 2020-2030F
6.3.1.Market Size & Growth Outlook
6.3.1.1. By Revenues in US$ Million
6.3.2.Market Segmentation & Growth Outlook
6.3.2.1. By Product Type- Market Insights and Forecast 2020-2030, USD Million
6.3.2.2. By Nature- Market Insights and Forecast 2020-2030, USD Million
6.3.2.3. By End User- Market Insights and Forecast 2020-2030, USD Million
6.3.2.4. By Sales Channel- Market Insights and Forecast 2020-2030, USD Million
6.4. Canada Plant-Based Dairy Market Statistics, 2020-2030F
6.4.1.Market Size & Growth Outlook
6.4.1.1. By Revenues in US$ Million
6.4.2.Market Segmentation & Growth Outlook
6.4.2.1. By Product Type- Market Insights and Forecast 2020-2030, USD Million
6.4.2.2. By Nature- Market Insights and Forecast 2020-2030, USD Million
6.4.2.3. By End User- Market Insights and Forecast 2020-2030, USD Million
6.4.2.4. By Sales Channel- Market Insights and Forecast 2020-2030, USD Million
6.5. Mexico Plant-Based Dairy Market Statistics, 2020-2030F
6.5.1.Market Size & Growth Outlook
6.5.1.1. By Revenues in US$ Million
6.5.2.Market Segmentation & Growth Outlook
6.5.2.1. By Product Type- Market Insights and Forecast 2020-2030, USD Million
6.5.2.2. By Nature- Market Insights and Forecast 2020-2030, USD Million
6.5.2.3. By End User- Market Insights and Forecast 2020-2030, USD Million
6.5.2.4. By Sales Channel- Market Insights and Forecast 2020-2030, USD Million
7. South America Plant-Based Dairy Market Statistics, 2020-2030F
7.1. Market Size & Growth Outlook
7.1.1.By Revenues in US$ Million
7.2. Market Segmentation & Growth Outlook
7.2.1.By Product Type- Market Insights and Forecast 2020-2030, USD Million
7.2.2.By Nature- Market Insights and Forecast 2020-2030, USD Million
7.2.3.By End User- Market Insights and Forecast 2020-2030, USD Million
7.2.4.By Sales Channel- Market Insights and Forecast 2020-2030, USD Million
7.2.5.By Country
7.2.5.1. Brazil
7.2.5.2. Argentina
7.2.5.3. Rest of South America
7.3. Brazil Plant-Based Dairy Market Statistics, 2020-2030F
7.3.1.Market Size & Growth Outlook
7.3.1.1. By Revenues in US$ Million
7.3.2.Market Segmentation & Growth Outlook
7.3.2.1. By Product Type- Market Insights and Forecast 2020-2030, USD Million
7.3.2.2. By Nature- Market Insights and Forecast 2020-2030, USD Million
7.3.2.3. By End User- Market Insights and Forecast 2020-2030, USD Million
7.3.2.4. By Sales Channel- Market Insights and Forecast 2020-2030, USD Million
7.4. Argentina Plant-Based Dairy Market Statistics, 2020-2030F
7.4.1.Market Size & Growth Outlook
7.4.1.1. By Revenues in US$ Million
7.4.2.Market Segmentation & Growth Outlook
7.4.2.1. By Product Type- Market Insights and Forecast 2020-2030, USD Million
7.4.2.2. By Nature- Market Insights and Forecast 2020-2030, USD Million
7.4.2.3. By End User- Market Insights and Forecast 2020-2030, USD Million
7.4.2.4. By Sales Channel- Market Insights and Forecast 2020-2030, USD Million
8. Europe Plant-Based Dairy Market Statistics, 2020-2030F
8.1. Market Size & Growth Outlook
8.1.1.By Revenues in US$ Million
8.2. Market Segmentation & Growth Outlook
8.2.1.By Product Type- Market Insights and Forecast 2020-2030, USD Million
8.2.2.By Nature- Market Insights and Forecast 2020-2030, USD Million
8.2.3.By End User- Market Insights and Forecast 2020-2030, USD Million
8.2.4.By Sales Channel- Market Insights and Forecast 2020-2030, USD Million
8.2.5.By Country
8.2.5.1. Germany
8.2.5.2. The UK
8.2.5.3. France
8.2.5.4. Spain
8.2.5.5. Italy
8.2.5.6. Rest of Europe
8.3. Germany Plant-Based Dairy Market Statistics, 2020-2030F
8.3.1.Market Size & Growth Outlook
8.3.1.1. By Revenues in US$ Million
8.3.2.Market Segmentation & Growth Outlook
8.3.2.1. By Product Type- Market Insights and Forecast 2020-2030, USD Million
8.3.2.2. By Nature- Market Insights and Forecast 2020-2030, USD Million
8.3.2.3. By End User- Market Insights and Forecast 2020-2030, USD Million
8.3.2.4. By Sales Channel- Market Insights and Forecast 2020-2030, USD Million
8.4. France Plant-Based Dairy Market Statistics, 2020-2030F
8.4.1.Market Size & Growth Outlook
8.4.1.1. By Revenues in US$ Million
8.4.2.Market Segmentation & Growth Outlook
8.4.2.1. By Product Type- Market Insights and Forecast 2020-2030, USD Million
8.4.2.2. By Nature- Market Insights and Forecast 2020-2030, USD Million
8.4.2.3. By End User- Market Insights and Forecast 2020-2030, USD Million
8.4.2.4. By Sales Channel- Market Insights and Forecast 2020-2030, USD Million
8.5. The UK Plant-Based Dairy Market Statistics, 2020-2030F
8.5.1.Market Size & Growth Outlook
8.5.1.1. By Revenues in US$ Million
8.5.2.Market Segmentation & Growth Outlook
8.5.2.1. By Product Type- Market Insights and Forecast 2020-2030, USD Million
8.5.2.2. By Nature- Market Insights and Forecast 2020-2030, USD Million
8.5.2.3. By End User- Market Insights and Forecast 2020-2030, USD Million
8.5.2.4. By Sales Channel- Market Insights and Forecast 2020-2030, USD Million
8.6. Spain Plant-Based Dairy Market Statistics, 2020-2030F
8.6.1.Market Size & Growth Outlook
8.6.1.1. By Revenues in US$ Million
8.6.2.Market Segmentation & Growth Outlook
8.6.2.1. By Product Type- Market Insights and Forecast 2020-2030, USD Million
8.6.2.2. By Nature- Market Insights and Forecast 2020-2030, USD Million
8.6.2.3. By End User- Market Insights and Forecast 2020-2030, USD Million
8.6.2.4. By Sales Channel- Market Insights and Forecast 2020-2030, USD Million
8.7. Italy Plant-Based Dairy Market Statistics, 2020-2030F
8.7.1.Market Size & Growth Outlook
8.7.1.1. By Revenues in US$ Million
8.7.2.Market Segmentation & Growth Outlook
8.7.2.1. By Product Type- Market Insights and Forecast 2020-2030, USD Million
8.7.2.2. By Nature- Market Insights and Forecast 2020-2030, USD Million
8.7.2.3. By End User- Market Insights and Forecast 2020-2030, USD Million
8.7.2.4. By Sales Channel- Market Insights and Forecast 2020-2030, USD Million
9. The Middle East & Africa Plant-Based Dairy Market Statistics, 2020-2030F
9.1. Market Size & Growth Outlook
9.1.1.By Revenues in US$ Million
9.2. Market Segmentation & Growth Outlook
9.2.1.By Product Type- Market Insights and Forecast 2020-2030, USD Million
9.2.2.By Nature- Market Insights and Forecast 2020-2030, USD Million
9.2.3.By End User- Market Insights and Forecast 2020-2030, USD Million
9.2.4.By Sales Channel- Market Insights and Forecast 2020-2030, USD Million
9.2.5.By Country
9.2.5.1. The UAE
9.2.5.2. Saudi Arabia
9.2.5.3. South Africa
9.2.5.4. Rest of the Middle East & Africa
9.3. The UAE Plant-Based Dairy Market Statistics, 2020-2030F
9.3.1.Market Size & Growth Outlook
9.3.1.1. By Revenues in US$ Million
9.3.2.Market Segmentation & Growth Outlook
9.3.2.1. By Product Type- Market Insights and Forecast 2020-2030, USD Million
9.3.2.2. By Nature- Market Insights and Forecast 2020-2030, USD Million
9.3.2.3. By End User- Market Insights and Forecast 2020-2030, USD Million
9.3.2.4. By Sales Channel- Market Insights and Forecast 2020-2030, USD Million
9.4. Saudi Arabia Plant-Based Dairy Market Statistics, 2020-2030F
9.4.1.Market Size & Growth Outlook
9.4.1.1. By Revenues in US$ Million
9.4.2.Market Segmentation & Growth Outlook
9.4.2.1. By Product Type- Market Insights and Forecast 2020-2030, USD Million
9.4.2.2. By Nature- Market Insights and Forecast 2020-2030, USD Million
9.4.2.3. By End User- Market Insights and Forecast 2020-2030, USD Million
9.4.2.4. By Sales Channel- Market Insights and Forecast 2020-2030, USD Million
9.5. South Africa Plant-Based Dairy Market Statistics, 2020-2030F
9.5.1.Market Size & Growth Outlook
9.5.1.1. By Revenues in US$ Million
9.5.2.Market Segmentation & Growth Outlook
9.5.2.1. By Product Type- Market Insights and Forecast 2020-2030, USD Million
9.5.2.2. By Nature- Market Insights and Forecast 2020-2030, USD Million
9.5.2.3. By End User- Market Insights and Forecast 2020-2030, USD Million
9.5.2.4. By Sales Channel- Market Insights and Forecast 2020-2030, USD Million
10. Asia-Pacific Plant-Based Dairy Market Statistics, 2020-2030F
10.1. Market Size & Growth Outlook
10.1.1. By Revenues in US$ Million
10.2. Market Segmentation & Growth Outlook
10.2.1. By Product Type- Market Insights and Forecast 2020-2030, USD Million
10.2.2. By Nature- Market Insights and Forecast 2020-2030, USD Million
10.2.3. By End User- Market Insights and Forecast 2020-2030, USD Million
10.2.4. By Sales Channel- Market Insights and Forecast 2020-2030, USD Million
10.2.5. By Country
10.2.5.1. China
10.2.5.2. India
10.2.5.3. Japan
10.2.5.4. South Korea
10.2.5.5. Australia
10.2.5.6. Rest of Asia-Pacific
10.3. China Plant-Based Dairy Market Statistics, 2020-2030F
10.3.1. Market Size & Growth Outlook
10.3.1.1. By Revenues in US$ Million
10.3.2. Market Segmentation & Growth Outlook
10.3.2.1. By Product Type- Market Insights and Forecast 2020-2030, USD Million
10.3.2.2. By Nature- Market Insights and Forecast 2020-2030, USD Million
10.3.2.3. By End User- Market Insights and Forecast 2020-2030, USD Million
10.3.2.4. By Sales Channel- Market Insights and Forecast 2020-2030, USD Million
10.4. India Plant-Based Dairy Market Statistics, 2020-2030F
10.4.1. Market Size & Growth Outlook
10.4.1.1. By Revenues in US$ Million
10.4.2. Market Segmentation & Growth Outlook
10.4.2.1. By Product Type- Market Insights and Forecast 2020-2030, USD Million
10.4.2.2. By Nature- Market Insights and Forecast 2020-2030, USD Million
10.4.2.3. By End User- Market Insights and Forecast 2020-2030, USD Million
10.4.2.4. By Sales Channel- Market Insights and Forecast 2020-2030, USD Million
10.5. Japan Plant-Based Dairy Market Statistics, 2020-2030F
10.5.1. Market Size & Growth Outlook
10.5.1.1. By Revenues in US$ Million
10.5.2. Market Segmentation & Growth Outlook
10.5.2.1. By Product Type- Market Insights and Forecast 2020-2030, USD Million
10.5.2.2. By Nature- Market Insights and Forecast 2020-2030, USD Million
10.5.2.3. By End User- Market Insights and Forecast 2020-2030, USD Million
10.5.2.4. By Sales Channel- Market Insights and Forecast 2020-2030, USD Million
10.6. South Korea Plant-Based Dairy Market Statistics, 2020-2030F
10.6.1. Market Size & Growth Outlook
10.6.1.1. By Revenues in US$ Million
10.6.2. Market Segmentation & Growth Outlook
10.6.2.1. By Product Type- Market Insights and Forecast 2020-2030, USD Million
10.6.2.2. By Nature- Market Insights and Forecast 2020-2030, USD Million
10.6.2.3. By End User- Market Insights and Forecast 2020-2030, USD Million
10.6.2.4. By Sales Channel- Market Insights and Forecast 2020-2030, USD Million
10.7. Australia Plant-Based Dairy Market Statistics, 2020-2030F
10.7.1. Market Size & Growth Outlook
10.7.1.1. By Revenues in US$ Million
10.7.2. Market Segmentation & Growth Outlook
10.7.2.1. By Product Type- Market Insights and Forecast 2020-2030, USD Million
10.7.2.2. By Nature- Market Insights and Forecast 2020-2030, USD Million
10.7.2.3. By End User- Market Insights and Forecast 2020-2030, USD Million
10.7.2.4. By Sales Channel- Market Insights and Forecast 2020-2030, USD Million
11. Competitive Outlook
11.1. Company Profiles
11.1.1. Blue Diamond Growers
11.1.1.1. Business Description
11.1.1.2. Product Portfolio
11.1.1.3. Collaborations & Alliances
11.1.1.4. Recent Developments
11.1.1.5. Financial Details
11.1.1.6. Others
11.1.2. Lactasoy Co
11.1.2.1. Business Description
11.1.2.2. Product Portfolio
11.1.2.3. Collaborations & Alliances
11.1.2.4. Recent Developments
11.1.2.5. Financial Details
11.1.2.6. Others
11.1.3. Vitasoy International Holdings
11.1.3.1. Business Description
11.1.3.2. Product Portfolio
11.1.3.3. Collaborations & Alliances
11.1.3.4. Recent Developments
11.1.3.5. Financial Details
11.1.3.6. Others
11.1.4. Wanxiang Sannong
11.1.4.1. Business Description
11.1.4.2. Product Portfolio
11.1.4.3. Collaborations & Alliances
11.1.4.4. Recent Developments
11.1.4.5. Financial Details
11.1.4.6. Others
11.1.5. Danone
11.1.5.1. Business Description
11.1.5.2. Product Portfolio
11.1.5.3. Collaborations & Alliances
11.1.5.4. Recent Developments
11.1.5.5. Financial Details
11.1.5.6. Others
11.1.6. Hebei Yangyuan Zhihui Beverage
11.1.6.1. Business Description
11.1.6.2. Product Portfolio
11.1.6.3. Collaborations & Alliances
11.1.6.4. Recent Developments
11.1.6.5. Financial Details
11.1.6.6. Others
11.1.7. Oatly Group
11.1.7.1. Business Description
11.1.7.2. Product Portfolio
11.1.7.3. Collaborations & Alliances
11.1.7.4. Recent Developments
11.1.7.5. Financial Details
11.1.7.6. Others
11.1.8. Coconut Palm
11.1.8.1. Business Description
11.1.8.2. Product Portfolio
11.1.8.3. Collaborations & Alliances
11.1.8.4. Recent Developments
11.1.8.5. Financial Details
11.1.8.6. Others
11.1.9. Coca-Cola
11.1.9.1. Business Description
11.1.9.2. Product Portfolio
11.1.9.3. Collaborations & Alliances
11.1.9.4. Recent Developments
11.1.9.5. Financial Details
11.1.9.6. Others
11.1.10. Kikkoman
11.1.10.1.Business Description
11.1.10.2.Product Portfolio
11.1.10.3.Collaborations & Alliances
11.1.10.4.Recent Developments
11.1.10.5.Financial Details
11.1.10.6.Others
11.1.11. Fujian Dali Food
11.1.11.1.Business Description
11.1.11.2.Product Portfolio
11.1.11.3.Collaborations & Alliances
11.1.11.4.Recent Developments
11.1.11.5.Financial Details
11.1.11.6.Others
11.1.12. Green Spot Co
11.1.12.1.Business Description
11.1.12.2.Product Portfolio
11.1.12.3.Collaborations & Alliances
11.1.12.4.Recent Developments
11.1.12.5.Financial Details
11.1.12.6.Others
11.1.13. Califia Farms
11.1.13.1.Business Description
11.1.13.2.Product Portfolio
11.1.13.3.Collaborations & Alliances
11.1.13.4.Recent Developments
11.1.13.5.Financial Details
11.1.13.6.Others
11.1.14. Flora Food Group
11.1.14.1.Business Description
11.1.14.2.Product Portfolio
11.1.14.3.Collaborations & Alliances
11.1.14.4.Recent Developments
11.1.14.5.Financial Details
11.1.14.6.Others
11.1.15. Marusanai
11.1.15.1.Business Description
11.1.15.2.Product Portfolio
11.1.15.3.Collaborations & Alliances
11.1.15.4.Recent Developments
11.1.15.5.Financial Details
11.1.15.6.Others
12. Disclaimer
| Segment | Sub-Segment |
|---|---|
| By Product Type |
|
| By Nature |
|
| By End User |
|
| By Sales Channel |
|
| By Region |
|
Research Methodology
This study followed a structured approach comprising four key phases to assess the size and scope of the electro-oxidation market. The process began with thorough secondary research to collect data on the target market, related markets, and broader industry context. These findings, along with preliminary assumptions and estimates, were then validated through extensive primary research involving industry experts from across the value chain. To calculate the overall market size, both top-down and bottom-up methodologies were employed. Finally, market segmentation and data triangulation techniques were applied to refine and validate segment-level estimations.
Secondary Research
The secondary research phase involved gathering data from a wide range of credible and published sources. This step helped in identifying industry trends, defining market segmentation, and understanding the market landscape and value chain.
Sources consulted during this phase included:
- Company annual reports, investor presentations, and press releases
- Industry white papers and certified publications
- Trade directories and market-recognized databases
- Articles from authoritative authors and reputable journals
- Gold and silver standard websites
Secondary research was critical in mapping out the industry's value chain and monetary flow, identifying key market segments, understanding regional variations, and tracking significant industry developments.
Other key sources:
- Financial disclosures
- Industry associations and trade bodies
- News outlets and business magazines
- Academic journals and research studies
- Paid industry databases
Primary Research
To validate secondary data and gain deeper market insights, primary research was conducted with key stakeholders across both the supply and demand sides of the market.
On the demand side, participants included decision-makers and influencers from end-user industries—such as CIOs, CTOs, and CSOs—who provided first-hand perspectives on market needs, product usage, and future expectations.
On the supply side, interviews were conducted with manufacturers, industry associations, and institutional participants to gather insights into current offerings, product pipelines, and market challenges.
Primary interviews provided critical inputs such as:
- Market size and revenue data
- Product and service breakdowns
- Market forecasts
- Regional and application-specific trends
Stakeholders consulted included:
- Leading OEM and solution providers
- Channel and distribution partners
- End users across various applications
- Independent consultants and industry specialists
Market Size Estimation and Data Triangulation
- Identifying Key Market Participants (Secondary Research)
- Goal: To identify the major players or companies in the target market. This typically involves using publicly available data sources such as industry reports, market research publications, and financial statements of companies.
- Tools: Reports from firms like Gartner, Forrester, Euromonitor, Statista, IBISWorld, and others. Public financial statements, news articles, and press releases from top market players.
- Extracting Earnings of Key Market Participants
- Goal: To estimate the earnings generated from the product or service being analyzed. This step helps in understanding the revenue potential of each market player in a specific geography.
- Methods: Earnings data can be gathered from:
- Publicly available financial reports (for listed companies).
- Interviews and primary data sources from professionals, such as Directors, VPs, SVPs, etc. This is especially useful for understanding more nuanced, internal data that isn't publicly disclosed.
- Annual reports and investor presentations of key players.
- Data Collation and Development of a Relevant Data Model
- Goal: To collate inputs from both primary and secondary sources into a structured, data-driven model for market estimation. This model will incorporate key market KPIs and any independent variables relevant to the market.
- Key KPIs: These could include:
- Market size, growth rate, and demand drivers.
- Industry-specific metrics like market share, average revenue per customer (ARPC), or average deal size.
- External variables, such as economic growth rates, inflation rates, or commodity prices, that could affect the market.
- Data Modeling: Based on this data, the market forecasts are developed for the next 5 years. A combination of trend analysis, scenario modeling, and statistical regression might be used to generate projections.
- Scenario Analysis
- Goal: To test different assumptions and validate how sensitive the market is to changes in key variables (e.g., market demand, regulatory changes, technological disruptions).
- Types of Scenarios:
- Base Case: Based on current assumptions and historical data.
- Best-Case Scenario: Assuming favorable market conditions, regulatory environments, and technological advancements.
- Worst-Case Scenario: Accounting for adverse factors, such as economic downturns, stricter regulations, or unexpected disruptions.


