Global Phosphoric Acid Market Report: Trends, Growth and Forecast (2026-2032)
By Grade (Food Grade, Technical Grade, Industrial Grade, Fertilizer Grade, Feed Grade, Electronics/Ultra-Pure Grade), By Application (Fertilizers (Diammonium Phosphate, Monoammonium Phosphate, Trisodium Phosphate, Others), Food & Beverages, Detergents, Metal Treatment, Others), By Process (Wet-Process, Thermal-Process, Secondary-Source/Recovery), By Region (North America, South America, Europe, Middle East & Africa, Asia Pacific) ... Read more
|
Major Players
|
Global Phosphoric Acid Market Statistics and Insights, 2026
- Market Size Statistics
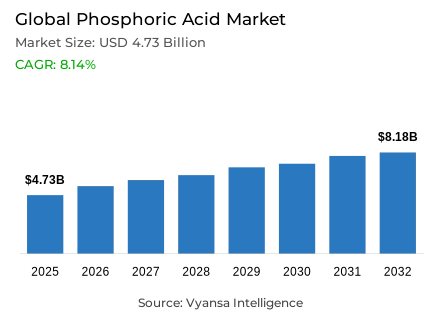
- Global phosphoric acid market is estimated at USD 4.73 billion in 2025.
- The market size is expected to grow to USD 8.18 billion by 2032.
- Market to register a CAGR of around 8.14% during 2026-32.
- Grade Shares
- Fertilizer grade grabbed market share of 80%.
- Competition
- More than 30 companies are actively engaged in producing phosphoric acid.
- Top 5 companies acquired around 60% of the market share.
- ICL Group; IFFCO; Ma’aden; The Mosaic Company; Nutrien Ltd. etc., are few of the top companies.
- Application
- Fertilizers grabbed 75% of the market.
- Region
- Asia Pacific leads with a 50% share of the global market.
Global Phosphoric Acid Market Outlook
The global phosphoric acid market will experience moderate growth from 2026 to 2032 due to growing demand in the agricultural industry. As of 2025, the phosphoric acid market was valued at $4.73 billion and is predicted to reach $8.18 billion in 2032, growing at a CAGR of 8.14% from 2026-32. Fertilizer-grade phosphoric acid accounts for 80% of the production because it serves as a key nutrient and fertilizer base for DAP, MAP, and TSP. The demand for food is growing rapidly due to rising populations. The availability of cultivatable land is decreasing due to rising demand for food. Efforts for increased yields in farming drive the demand for phosphoric acid.
Farm uses still lead with a total share of 75% in the consumption of phosphoric acid internationally. The end-users in Asia and South America are quite substantial due to their high application rates to increase the phosphate content in the soil. Fertilizers still remain the backbone in the uses of phosphoric acid, and the rising uses in the food and beverage sectors are quite substantial. The phosphoric acid of industrial grade and food grade meets specialized demands such as metal finishing and lithium iron phosphate batteries and fulfill their growth potential in the market.
The Asia-Pacific region holds the leading position in the worldwide market with a share of 50%, thanks to the substantial production of phosphate rock in China and a high demand for fertilizers in India, which is measured at a whopping 601 LMT. The ASEAN nations, too, are witnessing a rise in demand due to growth in populace, along with increased endeavors to cultivate major food grains. Both North America and Europe, respectively, contribute revenues of 14-15% and 12-13% in the worldwide market.
Innovations in sustainability and recovery of phosphorus are already influencing the future market trends. New technologies, such as bioprocessing for improved biological phosphorus removal, chemical precipitation, and recovery of struvite, provide an opportunity for a circular nutrient economy and reduced dependence on mined phosphate materials. Though there are regulatory and investment barriers to adopt these technologies, successful execution will further strengthen the positive growth trend of the global market till the end of 2032.

Global Phosphoric Acid Market Growth Driver
Intensifying Agricultural Demand Drives Market Growth
The demand for phosphoric acid in the global market is experiencing vigorous growth due to the increasing adoption of fertilizers in agricultural systems across the world to support food security. The U.S. Geological Survey reports that the consumption of P₂O₅ in the form of fertilizers across the world in 2024 was 47.5 million tons, up from 45.8 million tons in 2023; the production of phosphoric acid in 2024 reached 89.6 million tons. The regions that drive the market in the future will be Asia and South America due to the rise in the population of these regions without an adequate proportion of agricultural land.
Phosphoric acid is used as the prime feedstock for the production of major fertilizers such as DAP, MAP, and TSP. The total fertilizer requirement in India during the fiscal year 2023-24 was approximately 601 LMT, or 60.1 million tons, according to the statistics provided by the Press Information Bureau of India. The end-users in the emerging Asian nations are gradually stepping up the demand for phosphorus-based fertilizers in order to counter the depletion of soil nutrients.
Global Phosphoric Acid Market Challenge
Regulatory Pressures Elevate Production Costs
The phosphoric acid industry is facing intense operational pressures due to strict environmental regulations, especially in mature markets. The Farm to Fork Strategy proposed by the European Commission sets a target for a 20% decrease in fertilizer use by 2030, whereas limits on cadmium in phosphoric fertilizers are being reduced, and this calls for investment in advanced beneficiation and purification processes. Germany has specified phosphorus recovery from large-scale wastewater treatment facilities as a compulsory requirement from 2029.
The emerging market is also tightening its environmental regulations without the ability to efficiently absorb these pressures through developed infrastructure. The current restrictions on the use of reclaimed phosphorus for animal food by the EU further hinders the implementation of the circular economy and provides new hurdles for phosphoric acid companies that are not using the sustainable and green processing technology.
Unlock Market Intelligence
Explore the market potential with our data-driven report
Global Phosphoric Acid Market Trend
Advancements in Phosphorus Recovery Technologies
New innovations for the recovery of phosphorus are disrupting the dynamics of production, with end users and manufacturers seeking a more sustainable way to replace mined phosphate deposits. Processes such as Enhanced Biological Phosphorus Removal or chemical precipitation with Iron or Aluminum salts are being used to extract as high as 95% of the phosphorus content from the wastewater, with Germany embracing Sewage Sludge Ash Leaching approaches to create purified phosphoric acid for use in fertilizers and industry.
Additionally, Struvite precipitation technologies also make it possible for up to 90% of the phosphorus in phosphorus-containing wastewater from municipal and industrial sources to be recovered, thereby lessening reliance on mined phosphate resources. Although the technology is mature, some governmental restrictions and relatively high levels of capex have restricted wide-scale adoption of this technology in Europe. Strategic implementation of this recovery technology could help to promote the circular economy associated with nutrient cycles, thereby improving the sustainability of phosphoric acid value chains.
Global Phosphoric Acid Market Opportunity
Expanding Industrial and Food Applications Support Market Growth
The demand for phosphoric acid is shifting from the fertilizer industry and will grow in the food and industrial segments, thereby opening new growth opportunities. With FDA and EFSA approval, phosphoric acid is approved for use in the manufacturing of carbonates, dairy products, and processed food, and Asia-Pacific accounts for the largest demand, led by the growth of the Middle Class and the corresponding consumption of processed food, resulting in an annual growth in the consumption of processed food in developing Asia between 8% and 12% in the developing Asia population.
By industrial use, phosphoric acid is being used in metal finishing, water treatment, production of activated carbon, and in the manufacture of lithium iron phosphate batteries used in electric vehicles. High-end applications in the electronics industry, food industry, among others, have high margins due to rising demand in the areas of energy storage, pharmaceuticals, and accurate industrial processes. A combination of fertilizer use, along with industrial applications, guarantees sustained growth in the phosphoric acid industry.
Global Phosphoric Acid Market Regional Analysis

By Region
- North America
- South America
- Europe
- Middle East & Africa
- Asia Pacific
Asia-Pacific leads the global phosphoric acid market, accounting for approximately 50% of consumption. China anchors production with over 110 million tons of phosphate rock annually, while India ranks as the second-largest fertilizer consumer, requiring substantial domestic and imported phosphoric acid to support its 601 LMT fertilizer consumption and feed over 1.4 billion people. Southeast Asian nations, including Indonesia and Vietnam, are intensifying demand through rice and maize cultivation driven by population growth and yield enhancement programs.
North America contributes roughly 14-15% of global revenues, with the U.S. producing 20 million tons of phosphate rock in 2024. Europe accounts for approximately 12-13%, shifting demand from fertilizers toward industrial and food-grade applications due to sustainability regulations. These regional dynamics shape both production priorities and end-user supply strategies globally.
Unlock Market Intelligence
Explore the market potential with our data-driven report
Global Phosphoric Acid Market Segmentation Analysis
By Grade
- Food Grade
- Technical Grade
- Industrial Grade
- Fertilizer Grade
- Feed Grade
- Electronics/Ultra-Pure Grade
Fertilizer grade phosphoric acid dominates global production, grabbing a market share of 80% due to its indispensable role in crop nutrition and phosphorus-based fertilizers. This grade is the primary precursor for DAP, MAP, and TSP, which form the backbone of agricultural phosphate consumption. The structural necessity of phosphorus in plant growth, energy transfer, and photosynthesis underpins the sustained demand among end users in agriculture, reinforcing fertilizer-grade market leadership.
Food-grade and electronics-grade phosphoric acid serve niche applications in beverages, processed foods, semiconductors, and battery production. While these segments grow steadily due to urbanization, technological advancement, and rising middle-class demand, fertilizer-grade phosphoric acid remains the core driver of production, reflecting fundamental structural consumption patterns and ensuring continued market concentration through 2032.

By Application
- Fertilizers
- Food & Beverages
- Detergents
- Metal Treatment
- Others
Fertilizers remain the largest application segment in the global phosphoric acid market, grabbing 75% of total consumption. This predominance is driven by the essential role of phosphate fertilizers in sustaining agricultural output amidst shrinking arable land and increasing food demand. DAP, MAP, and TSP remain critical for high-yield cultivation, particularly in Asia and South America, where population pressures and soil phosphorus depletion necessitate higher application rates.
Secondary applications in food, beverages, and industrial sectors are growing, but structural demand for fertilizers ensures that end users in agriculture maintain the dominant consumption share. The necessity of phosphate fertilizers for crop nutrition guarantees that the majority of phosphoric acid demand will continue to be driven by agricultural applications through 2032, with industrial and food applications serving as supportive, expanding segments.
Market Players in Global Phosphoric Acid Market
These market players maintain a significant presence in the Global phosphoric acid market sector and contribute to its ongoing evolution.
- ICL Group
- IFFCO
- Ma’aden
- The Mosaic Company
- Nutrien Ltd.
- OCP Group
- Yara International
- EuroChem Group
- Innophos
- Agropolychim
- J.R. Simplot
- Solvay
- Arkema
- Prayon S.A.
- Brenntag AG
Market News & Updates
- OCP Group, 2025:
Achieved 21% revenue growth to MAD 52.166 billion (US$5.45 billion) in H1 2025 compared to H1 2024; commissioned new phosphoric acid treatment unit in March 2025 with daily capacity of 1,500 tons of phosphorus pentoxide (P₂O₅).
- Nutrien Ltd., 2025:
Achieved 88% operating rate at phosphate operations in Q3 2025 as reliability improvements and turnaround activities completed in H1 2025 led to significant performance improvement; maintained 2025 phosphate sales volume guidance of 2.35-2.55 million tonnes assuming higher operating rates and sales volumes in Q4.
Frequently Asked Questions
Related Report
1. Market Segmentation
1.1. Research Scope
1.2. Research Methodology
1.3. Definitions and Assumptions
2. Executive Summary
3. Global Phosphoric Acid Market Policies, Regulations, and Standards
4. Global Phosphoric Acid Market Dynamics
4.1. Growth Factors
4.2. Challenges
4.3. Trends
4.4. Opportunities
5. Global Phosphoric Acid Market Statistics, 2022-2032F
5.1. Market Size & Growth Outlook
5.1.1.By Revenues in USD Million
5.2. Market Segmentation & Growth Outlook
5.2.1.By Grade
5.2.1.1. Food Grade- Market Insights and Forecast 2022-2032, USD Million
5.2.1.2. Technical Grade- Market Insights and Forecast 2022-2032, USD Million
5.2.1.3. Industrial Grade- Market Insights and Forecast 2022-2032, USD Million
5.2.1.4. Fertilizer Grade- Market Insights and Forecast 2022-2032, USD Million
5.2.1.5. Feed Grade- Market Insights and Forecast 2022-2032, USD Million
5.2.1.6. Electronics/Ultra-Pure Grade- Market Insights and Forecast 2022-2032, USD Million
5.2.2.By Application
5.2.2.1. Fertilizers- Market Insights and Forecast 2022-2032, USD Million
5.2.2.1.1. Diammonium Phosphate- Market Insights and Forecast 2022-2032, USD Million
5.2.2.1.2. Monoammonium Phosphate- Market Insights and Forecast 2022-2032, USD Million
5.2.2.1.3. Trisodium Phosphate- Market Insights and Forecast 2022-2032, USD Million
5.2.2.1.4. Others- Market Insights and Forecast 2022-2032, USD Million
5.2.2.2. Food & Beverages- Market Insights and Forecast 2022-2032, USD Million
5.2.2.3. Detergents- Market Insights and Forecast 2022-2032, USD Million
5.2.2.4. Metal Treatment- Market Insights and Forecast 2022-2032, USD Million
5.2.2.5. Others- Market Insights and Forecast 2022-2032, USD Million
5.2.3.By Process
5.2.3.1. Wet-Process- Market Insights and Forecast 2022-2032, USD Million
5.2.3.2. Thermal-Process- Market Insights and Forecast 2022-2032, USD Million
5.2.3.3. Secondary-Source/Recovery- Market Insights and Forecast 2022-2032, USD Million
5.2.4.By Region
5.2.4.1. North America
5.2.4.2. South America
5.2.4.3. Europe
5.2.4.4. Middle East & Africa
5.2.4.5. Asia Pacific
5.2.5.By Competitors
5.2.5.1. Competition Characteristics
5.2.5.2. Market Share & Analysis
6. North America Phosphoric Acid Market Statistics, 2022-2032F
6.1. Market Size & Growth Outlook
6.1.1.By Revenues in USD Million
6.2. Market Segmentation & Growth Outlook
6.2.1.By Grade- Market Insights and Forecast 2022-2032, USD Million
6.2.2.By Application- Market Insights and Forecast 2022-2032, USD Million
6.2.3.By Process- Market Insights and Forecast 2022-2032, USD Million
6.2.4.By Country
6.2.4.1. US
6.2.4.2. Canada
6.2.4.3. Mexico
6.2.4.4. Rest of North America
6.3. US Phosphoric Acid Market Statistics, 2022-2032F
6.3.1.Market Size & Growth Outlook
6.3.1.1. By Revenues in USD Million
6.3.2.Market Segmentation & Growth Outlook
6.3.2.1. By Grade- Market Insights and Forecast 2022-2032, USD Million
6.3.2.2. By Application- Market Insights and Forecast 2022-2032, USD Million
6.4. Canada Phosphoric Acid Market Statistics, 2022-2032F
6.4.1.Market Size & Growth Outlook
6.4.1.1. By Revenues in USD Million
6.4.2.Market Segmentation & Growth Outlook
6.4.2.1. By Grade- Market Insights and Forecast 2022-2032, USD Million
6.4.2.2. By Application- Market Insights and Forecast 2022-2032, USD Million
6.5. Mexico Phosphoric Acid Market Statistics, 2022-2032F
6.5.1.Market Size & Growth Outlook
6.5.1.1. By Revenues in USD Million
6.5.2.Market Segmentation & Growth Outlook
6.5.2.1. By Grade- Market Insights and Forecast 2022-2032, USD Million
6.5.2.2. By Application- Market Insights and Forecast 2022-2032, USD Million
7. South America Phosphoric Acid Market Statistics, 2022-2032F
7.1. Market Size & Growth Outlook
7.1.1.By Revenues in USD Million
7.2. Market Segmentation & Growth Outlook
7.2.1.By Grade- Market Insights and Forecast 2022-2032, USD Million
7.2.2.By Application- Market Insights and Forecast 2022-2032, USD Million
7.2.3.By Process- Market Insights and Forecast 2022-2032, USD Million
7.2.4.By Country
7.2.4.1. Brazil
7.2.4.2. Argentina
7.2.4.3. Rest of South America
7.3. Brazil Phosphoric Acid Market Statistics, 2022-2032F
7.3.1.Market Size & Growth Outlook
7.3.1.1. By Revenues in USD Million
7.3.2.Market Segmentation & Growth Outlook
7.3.2.1. By Grade- Market Insights and Forecast 2022-2032, USD Million
7.3.2.2. By Application- Market Insights and Forecast 2022-2032, USD Million
7.4. Argentina Phosphoric Acid Market Statistics, 2022-2032F
7.4.1.Market Size & Growth Outlook
7.4.1.1. By Revenues in USD Million
7.4.2.Market Segmentation & Growth Outlook
7.4.2.1. By Grade- Market Insights and Forecast 2022-2032, USD Million
7.4.2.2. By Application- Market Insights and Forecast 2022-2032, USD Million
8. Europe Phosphoric Acid Market Statistics, 2022-2032F
8.1. Market Size & Growth Outlook
8.1.1.By Revenues in USD Million
8.2. Market Segmentation & Growth Outlook
8.2.1.By Grade- Market Insights and Forecast 2022-2032, USD Million
8.2.2.By Application- Market Insights and Forecast 2022-2032, USD Million
8.2.3.By Process- Market Insights and Forecast 2022-2032, USD Million
8.2.4.By Country
8.2.4.1. Germany
8.2.4.2. France
8.2.4.3. UK
8.2.4.4. Russia
8.2.4.5. Italy
8.2.4.6. Spain
8.2.4.7. Netherlands
8.2.4.8. Belgium
8.2.4.9. Poland
8.2.4.10. Turkey
8.2.4.11. Rest of Europe
8.3. Germany Phosphoric Acid Market Statistics, 2022-2032F
8.3.1.Market Size & Growth Outlook
8.3.1.1. By Revenues in USD Million
8.3.2.Market Segmentation & Growth Outlook
8.3.2.1. By Grade- Market Insights and Forecast 2022-2032, USD Million
8.3.2.2. By Application- Market Insights and Forecast 2022-2032, USD Million
8.4. France Phosphoric Acid Market Statistics, 2022-2032F
8.4.1.Market Size & Growth Outlook
8.4.1.1. By Revenues in USD Million
8.4.2.Market Segmentation & Growth Outlook
8.4.2.1. By Grade- Market Insights and Forecast 2022-2032, USD Million
8.4.2.2. By Application- Market Insights and Forecast 2022-2032, USD Million
8.5. UK Phosphoric Acid Market Statistics, 2022-2032F
8.5.1.Market Size & Growth Outlook
8.5.1.1. By Revenues in USD Million
8.5.2.Market Segmentation & Growth Outlook
8.5.2.1. By Grade- Market Insights and Forecast 2022-2032, USD Million
8.5.2.2. By Application- Market Insights and Forecast 2022-2032, USD Million
8.6. Russia Phosphoric Acid Market Statistics, 2022-2032F
8.6.1.Market Size & Growth Outlook
8.6.1.1. By Revenues in USD Million
8.6.2.Market Segmentation & Growth Outlook
8.6.2.1. By Grade- Market Insights and Forecast 2022-2032, USD Million
8.6.2.2. By Application- Market Insights and Forecast 2022-2032, USD Million
8.7. Italy Phosphoric Acid Market Statistics, 2022-2032F
8.7.1.Market Size & Growth Outlook
8.7.1.1. By Revenues in USD Million
8.7.2.Market Segmentation & Growth Outlook
8.7.2.1. By Grade- Market Insights and Forecast 2022-2032, USD Million
8.7.2.2. By Application- Market Insights and Forecast 2022-2032, USD Million
8.8. Spain Phosphoric Acid Market Statistics, 2022-2032F
8.8.1.Market Size & Growth Outlook
8.8.1.1. By Revenues in USD Million
8.8.2.Market Segmentation & Growth Outlook
8.8.2.1. By Grade- Market Insights and Forecast 2022-2032, USD Million
8.8.2.2. By Application- Market Insights and Forecast 2022-2032, USD Million
8.9. Netherlands Phosphoric Acid Market Statistics, 2022-2032F
8.9.1.Market Size & Growth Outlook
8.9.1.1. By Revenues in USD Million
8.9.2.Market Segmentation & Growth Outlook
8.9.2.1. By Grade- Market Insights and Forecast 2022-2032, USD Million
8.9.2.2. By Application- Market Insights and Forecast 2022-2032, USD Million
8.10. Belgium Phosphoric Acid Market Statistics, 2022-2032F
8.10.1. Market Size & Growth Outlook
8.10.1.1. By Revenues in USD Million
8.10.2. Market Segmentation & Growth Outlook
8.10.2.1. By Grade- Market Insights and Forecast 2022-2032, USD Million
8.10.2.2. By Application- Market Insights and Forecast 2022-2032, USD Million
8.11. Poland Phosphoric Acid Market Statistics, 2022-2032F
8.11.1. Market Size & Growth Outlook
8.11.1.1. By Revenues in USD Million
8.11.2. Market Segmentation & Growth Outlook
8.11.2.1. By Grade- Market Insights and Forecast 2022-2032, USD Million
8.11.2.2. By Application- Market Insights and Forecast 2022-2032, USD Million
8.12. Turkey Phosphoric Acid Market Statistics, 2022-2032F
8.12.1. Market Size & Growth Outlook
8.12.1.1. By Revenues in USD Million
8.12.2. Market Segmentation & Growth Outlook
8.12.2.1. By Grade- Market Insights and Forecast 2022-2032, USD Million
8.12.2.2. By Application- Market Insights and Forecast 2022-2032, USD Million
9. Middle East & Africa Phosphoric Acid Market Statistics, 2022-2032F
9.1. Market Size & Growth Outlook
9.1.1.By Revenues in USD Million
9.2. Market Segmentation & Growth Outlook
9.2.1.By Grade- Market Insights and Forecast 2022-2032, USD Million
9.2.2.By Application- Market Insights and Forecast 2022-2032, USD Million
9.2.3.By Process- Market Insights and Forecast 2022-2032, USD Million
9.2.4.By Country
9.2.4.1. UAE
9.2.4.2. Saudi Arabia
9.2.4.3. Rest of Middle East & Africa
9.3. UAE Phosphoric Acid Market Statistics, 2022-2032F
9.3.1.Market Size & Growth Outlook
9.3.1.1. By Revenues in USD Million
9.3.2.Market Segmentation & Growth Outlook
9.3.2.1. By Grade- Market Insights and Forecast 2022-2032, USD Million
9.3.2.2. By Application- Market Insights and Forecast 2022-2032, USD Million
9.4. Saudi Arabia Phosphoric Acid Market Statistics, 2022-2032F
9.4.1.Market Size & Growth Outlook
9.4.1.1. By Revenues in USD Million
9.4.2.Market Segmentation & Growth Outlook
9.4.2.1. By Grade- Market Insights and Forecast 2022-2032, USD Million
9.4.2.2. By Application- Market Insights and Forecast 2022-2032, USD Million
10. Asia Pacific Phosphoric Acid Market Statistics, 2022-2032F
10.1. Market Size & Growth Outlook
10.1.1. By Revenues in USD Million
10.2. Market Segmentation & Growth Outlook
10.2.1. By Grade- Market Insights and Forecast 2022-2032, USD Million
10.2.2. By Application- Market Insights and Forecast 2022-2032, USD Million
10.2.3. By Process- Market Insights and Forecast 2022-2032, USD Million
10.2.4. By Country
10.2.4.1. China
10.2.4.2. India
10.2.4.3. Japan
10.2.4.4. South Korea
10.2.4.5. Australia
10.2.4.6. Thailand
10.2.4.7. Rest of Asia Pacific
10.3. China Phosphoric Acid Market Statistics, 2022-2032F
10.3.1. Market Size & Growth Outlook
10.3.1.1. By Revenues in USD Million
10.3.2. Market Segmentation & Growth Outlook
10.3.2.1. By Grade- Market Insights and Forecast 2022-2032, USD Million
10.3.2.2. By Application- Market Insights and Forecast 2022-2032, USD Million
10.4. India Phosphoric Acid Market Statistics, 2022-2032F
10.4.1. Market Size & Growth Outlook
10.4.1.1. By Revenues in USD Million
10.4.2. Market Segmentation & Growth Outlook
10.4.2.1. By Grade- Market Insights and Forecast 2022-2032, USD Million
10.4.2.2. By Application- Market Insights and Forecast 2022-2032, USD Million
10.5. Japan Phosphoric Acid Market Statistics, 2022-2032F
10.5.1. Market Size & Growth Outlook
10.5.1.1. By Revenues in USD Million
10.5.2. Market Segmentation & Growth Outlook
10.5.2.1. By Grade- Market Insights and Forecast 2022-2032, USD Million
10.5.2.2. By Application- Market Insights and Forecast 2022-2032, USD Million
10.6. South Korea Phosphoric Acid Market Statistics, 2022-2032F
10.6.1. Market Size & Growth Outlook
10.6.1.1. By Revenues in USD Million
10.6.2. Market Segmentation & Growth Outlook
10.6.2.1. By Grade- Market Insights and Forecast 2022-2032, USD Million
10.6.2.2. By Application- Market Insights and Forecast 2022-2032, USD Million
10.7. Australia Phosphoric Acid Market Statistics, 2022-2032F
10.7.1. Market Size & Growth Outlook
10.7.1.1. By Revenues in USD Million
10.7.2. Market Segmentation & Growth Outlook
10.7.2.1. By Grade- Market Insights and Forecast 2022-2032, USD Million
10.7.2.2. By Application- Market Insights and Forecast 2022-2032, USD Million
10.8. Thailand Phosphoric Acid Market Statistics, 2022-2032F
10.8.1. Market Size & Growth Outlook
10.8.1.1. By Revenues in USD Million
10.8.2. Market Segmentation & Growth Outlook
10.8.2.1. By Grade- Market Insights and Forecast 2022-2032, USD Million
10.8.2.2. By Application- Market Insights and Forecast 2022-2032, USD Million
11. Competitive Outlook
11.1. Company Profiles
11.1.1. Nutrien Ltd.
11.1.1.1. Business Description
11.1.1.2. Product Portfolio
11.1.1.3. Collaborations & Alliances
11.1.1.4. Recent Developments
11.1.1.5. Financial Details
11.1.1.6. Others
11.1.2. OCP Group
11.1.2.1. Business Description
11.1.2.2. Product Portfolio
11.1.2.3. Collaborations & Alliances
11.1.2.4. Recent Developments
11.1.2.5. Financial Details
11.1.2.6. Others
11.1.3. Yara International
11.1.3.1. Business Description
11.1.3.2. Product Portfolio
11.1.3.3. Collaborations & Alliances
11.1.3.4. Recent Developments
11.1.3.5. Financial Details
11.1.3.6. Others
11.1.4. EuroChem Group
11.1.4.1. Business Description
11.1.4.2. Product Portfolio
11.1.4.3. Collaborations & Alliances
11.1.4.4. Recent Developments
11.1.4.5. Financial Details
11.1.4.6. Others
11.1.5. ICL Group
11.1.5.1. Business Description
11.1.5.2. Product Portfolio
11.1.5.3. Collaborations & Alliances
11.1.5.4. Recent Developments
11.1.5.5. Financial Details
11.1.5.6. Others
11.1.6. IFFCO
11.1.6.1. Business Description
11.1.6.2. Product Portfolio
11.1.6.3. Collaborations & Alliances
11.1.6.4. Recent Developments
11.1.6.5. Financial Details
11.1.6.6. Others
11.1.7. Ma’aden
11.1.7.1. Business Description
11.1.7.2. Product Portfolio
11.1.7.3. Collaborations & Alliances
11.1.7.4. Recent Developments
11.1.7.5. Financial Details
11.1.7.6. Others
11.1.8. Innophos
11.1.8.1. Business Description
11.1.8.2. Product Portfolio
11.1.8.3. Collaborations & Alliances
11.1.8.4. Recent Developments
11.1.8.5. Financial Details
11.1.8.6. Others
11.1.9. Agropolychim
11.1.9.1. Business Description
11.1.9.2. Product Portfolio
11.1.9.3. Collaborations & Alliances
11.1.9.4. Recent Developments
11.1.9.5. Financial Details
11.1.9.6. Others
11.1.10. J.R. Simplot
11.1.10.1.Business Description
11.1.10.2.Product Portfolio
11.1.10.3.Collaborations & Alliances
11.1.10.4.Recent Developments
11.1.10.5.Financial Details
11.1.10.6.Others
11.1.11. Solvay
11.1.11.1.Business Description
11.1.11.2.Product Portfolio
11.1.11.3.Collaborations & Alliances
11.1.11.4.Recent Developments
11.1.11.5.Financial Details
11.1.11.6.Others
11.1.12. Arkema
11.1.12.1.Business Description
11.1.12.2.Product Portfolio
11.1.12.3.Collaborations & Alliances
11.1.12.4.Recent Developments
11.1.12.5.Financial Details
11.1.12.6.Others
11.1.13. Prayon S.A.
11.1.13.1.Business Description
11.1.13.2.Product Portfolio
11.1.13.3.Collaborations & Alliances
11.1.13.4.Recent Developments
11.1.13.5.Financial Details
11.1.13.6.Others
11.1.14. Brenntag AG
11.1.14.1.Business Description
11.1.14.2.Product Portfolio
11.1.14.3.Collaborations & Alliances
11.1.14.4.Recent Developments
11.1.14.5.Financial Details
11.1.14.6.Others
11.1.15. Guangxi Qinzhou Capital Success Chemical
11.1.15.1.Business Description
11.1.15.2.Product Portfolio
11.1.15.3.Collaborations & Alliances
11.1.15.4.Recent Developments
11.1.15.5.Financial Details
11.1.15.6.Others
12. Disclaimer
| Segment | Sub-Segment |
|---|---|
| By Grade |
|
| By Application |
|
| By Process |
|
| By Region |
|
Research Methodology
This study followed a structured approach comprising four key phases to assess the size and scope of the electro-oxidation market. The process began with thorough secondary research to collect data on the target market, related markets, and broader industry context. These findings, along with preliminary assumptions and estimates, were then validated through extensive primary research involving industry experts from across the value chain. To calculate the overall market size, both top-down and bottom-up methodologies were employed. Finally, market segmentation and data triangulation techniques were applied to refine and validate segment-level estimations.
Secondary Research
The secondary research phase involved gathering data from a wide range of credible and published sources. This step helped in identifying industry trends, defining market segmentation, and understanding the market landscape and value chain.
Sources consulted during this phase included:
- Company annual reports, investor presentations, and press releases
- Industry white papers and certified publications
- Trade directories and market-recognized databases
- Articles from authoritative authors and reputable journals
- Gold and silver standard websites
Secondary research was critical in mapping out the industry's value chain and monetary flow, identifying key market segments, understanding regional variations, and tracking significant industry developments.
Other key sources:
- Financial disclosures
- Industry associations and trade bodies
- News outlets and business magazines
- Academic journals and research studies
- Paid industry databases
Primary Research
To validate secondary data and gain deeper market insights, primary research was conducted with key stakeholders across both the supply and demand sides of the market.
On the demand side, participants included decision-makers and influencers from end-user industries—such as CIOs, CTOs, and CSOs—who provided first-hand perspectives on market needs, product usage, and future expectations.
On the supply side, interviews were conducted with manufacturers, industry associations, and institutional participants to gather insights into current offerings, product pipelines, and market challenges.
Primary interviews provided critical inputs such as:
- Market size and revenue data
- Product and service breakdowns
- Market forecasts
- Regional and application-specific trends
Stakeholders consulted included:
- Leading OEM and solution providers
- Channel and distribution partners
- End users across various applications
- Independent consultants and industry specialists
Market Size Estimation and Data Triangulation
- Identifying Key Market Participants (Secondary Research)
- Goal: To identify the major players or companies in the target market. This typically involves using publicly available data sources such as industry reports, market research publications, and financial statements of companies.
- Tools: Reports from firms like Gartner, Forrester, Euromonitor, Statista, IBISWorld, and others. Public financial statements, news articles, and press releases from top market players.
- Extracting Earnings of Key Market Participants
- Goal: To estimate the earnings generated from the product or service being analyzed. This step helps in understanding the revenue potential of each market player in a specific geography.
- Methods: Earnings data can be gathered from:
- Publicly available financial reports (for listed companies).
- Interviews and primary data sources from professionals, such as Directors, VPs, SVPs, etc. This is especially useful for understanding more nuanced, internal data that isn't publicly disclosed.
- Annual reports and investor presentations of key players.
- Data Collation and Development of a Relevant Data Model
- Goal: To collate inputs from both primary and secondary sources into a structured, data-driven model for market estimation. This model will incorporate key market KPIs and any independent variables relevant to the market.
- Key KPIs: These could include:
- Market size, growth rate, and demand drivers.
- Industry-specific metrics like market share, average revenue per customer (ARPC), or average deal size.
- External variables, such as economic growth rates, inflation rates, or commodity prices, that could affect the market.
- Data Modeling: Based on this data, the market forecasts are developed for the next 5 years. A combination of trend analysis, scenario modeling, and statistical regression might be used to generate projections.
- Scenario Analysis
- Goal: To test different assumptions and validate how sensitive the market is to changes in key variables (e.g., market demand, regulatory changes, technological disruptions).
- Types of Scenarios:
- Base Case: Based on current assumptions and historical data.
- Best-Case Scenario: Assuming favorable market conditions, regulatory environments, and technological advancements.
- Worst-Case Scenario: Accounting for adverse factors, such as economic downturns, stricter regulations, or unexpected disruptions.


