Global Glycerin Market Report: Trends, Growth and Forecast (2026-2032)
By Grade (USP Grade, Industrial Grade, Pharmaceutical Grade), By Application (Personal Care, Food, Pharmaceuticals), By Region (North America, South America, Europe, Asia Pacific) ... Read more
|
Major Players
|
Global Glycerin Market Statistics and Insights, 2026
- Market Size Statistics
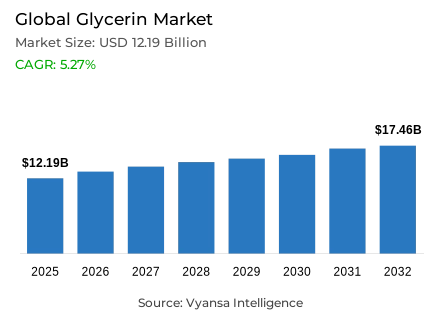
- Global glycerin market is estimated at USD 12.19 billion in 2025.
- The market size is expected to grow to USD 17.46 billion by 2032.
- Market to register a CAGR of around 5.27% during 2026-32.
- Grade Shares
- Usp grade grabbed market share of 60%.
- Competition
- Global glycerin market is currently being catered to by more than 20 companies.
- Top 5 companies acquired around 50% of the market share.
- KLK Oleo; VVF Ltd; Wilmar International; Oleon NV; Procter & Gamble etc., are few of the top companies.
- Application
- Personal care grabbed 35% of the market.
- Region
- Asia Pacific leads with a 40% share of the global market.
Global Glycerin Market Outlook
The Global Glycerin Market experiences strong growth potential due to the rapid growth of the biodiesel industry, which provides crude glycerol as a byproduct of biodiesel production. As countries have made greater efforts to meet their climate goals by utilizing low-carbon fuels, there has been an increase in predictable and consistent sources of glycerin that can be used in the industry. The glycerin market is expected to be worth $12.19 billion by 2025 and $17.46 billion by 2032 with a projected CAGR of approximately 5.27% between 2026 and 2032. The output of crude glycerin through biodiesel production provides the end user with a constant source of reliable feedstock to be utilized in large-volume chemical and personal care application production.
The glycerin market has experienced strong growth; however, there are many challenges from an oversupply and refining perspective. Widespread biodiesel production has created immense quantities of raw glycerin that frequently exceed the current available storage and refining capacity. Converting these significant volumes into either high-purity technical or USP-grade glycerin will require additional energy-intensive processing steps, which create processing bottlenecks for those producers that do not have facilities capable of conducting glycerin refining processes. While policy-driven biodiesel mandates in India and Indonesia have helped to stabilize the glycerin supply, efficient refining will still be critical to achieving profitability and supporting industry demand.
The glycerin market can be divided into multiple segments based upon both the glycerin purity level/grade and the particular application segment to which it is utilized. Currently, the largest grade of glycerin is USP Grade, which has approximately 60% of the overall glycerin market because of its importance and utilitarian function within pharmaceuticals, cosmetics, and other quality-sensitive consumer products. The personal care application category holds the largest market share at approximately 35%, reflecting the common utilization of glycerin as a humectant and emulsifier for soaps, lotions, and skin-care formulations. End users consistently require high-purity glycerin for both safety and efficacy in producing finished products, resulting in a stable level of demand from end users throughout the global personal-care and hygiene marketplace.
Regionally, Asia-Pacific represents the largest region of the global glycerin market, representing approximately 40% of the total market due to extensive biodiesel production infrastructure, an abundance of feedstocks that can be utilized, and a rising demand for industrial products. Key contributor countries include Indonesia, Malaysia, and China, which have significant palm oil plantations that support both biodiesel and glycerin production. Additionally, the rapid growth of industrialization and the increasing size of the middle-class consumer base, as well as the increasing purchasing power of consumers for personal care products, will continue to enhance the region's dominant position within the global glycerin market.

Global Glycerin Market Growth Driver
Expanding Biodiesel Production Driving Feedstock Availability
The biodiesel industry is rapidly growing, and that growth is driving the glycerin market because of the large amount of crude glycerol produced from biodiesel. With countries looking for low-carbon fuel sources to meet climate commitments, biodiesel production from biomass will continue to grow, thereby providing a constant supply of crude glycerol as an alternative feedstock. According to the World Bioenergy Association (WBA), 2023 biodiesel output will be nearly 50 billion liters, with Indonesia, the European Union, Brazil and the United States producing the largest volumes. Continued production of biodiesel ensures a steady supply of raw materials for industrial end users.
About 10% of the total weight of biodiesel produced will produce a corresponding quantity of crude glycerol. This is also a steady source of feedstock for industrial use and is increasing in demand, particularly from emerging economies. The International Energy Agency (IEA) said that the use of glycerin derived from biodiesel is growing in importance across sectors, allowing users to be assured of a consistent and reliable feedstock supply, thus enabling increased scaling of chemical manufacturing processes globally.
Global Glycerin Market Challenge
Managing Oversupply and Refining Limitations
Despite the ample supply of glycerol in the global glycerin market, there are challenges associated with the over-supply of crude glycerol, as well as the disposal of unused crude glycerol. The rapid growth of the biodiesel industry has resulted in an overabundance of crude glycerol produced in a relatively short time frame, and as biodiesel production increases, there are already significant quantities of crude glycerol on hand at producers who do not have the storage or refining capabilities. According to the OECD-FAO Agricultural Outlook 2025-2034, biomass-based diesel production will increase at an annual rate of 1.68%, compounding the over-supply problem of biodiesel by-products.
Therefore, accumulated crude glycerol puts downward pressure on prices and creates additional logistical challenges for producers who are not fully integrated into the industryThe energy required to convert crude glycerol into either high purity technical grade or high purity USP grade glycerol creates a bottleneck with regard to glycerol refinery production capacity not meeting supply demand. Nation's like Brazil and the United States, who together accounted for approximately 80% of total global ethanol and a large percentage of the biodiesel production in 2023, are faced with concentrated oversupply issues. The challenge of excess crude glycerol is particularly problematic for smaller biodiesel producers because the costs to process or dispose of the excess crude glycerol streams are high, severely reducing their profitability and overall market competitiveness.
Unlock Market Intelligence
Explore the market potential with our data-driven report
Global Glycerin Market Trend
Policy-Driven Expansion Influencing Production Dynamics
The creation of biofuel production mandates at the government level alters the value chain for producing glycerol worldwide. Governments throughout the world have enforced higher biodiesel blending targets to achieve reductions in their respective dependencies on fossil fuels. The higher biodiesel blending targets establish a systematic increase in the volume of glycerol-rich by-products produced. A prime example of this shift in raw glycerol production is that India's National Policy on Biofuels has established a goal of 20% biodiesel blends by the year 2030, thus creating a need for existing and new local infrastructure to refine biodiesel and providing existing biodiesel refiners with a guaranteed source of glycerol.
The government mandates requiring B40 (40% biodiesel) or greater blends of biodiesel in many Southeast Asian countries, including Indonesia, represents an example of the policy-driven increase in biodiesel production. The biofuel mandates also work to ensure that a nation’s energy security and agricultural industries remain supported by creating new sources of glycerin and that glycerin manufacturers are able to establish procurement strategies that conform to government legislation and guidelines. When governments incorporate policies that support the establishment of local production of all forms of renewable energy into their national energy frameworks, it creates a stable supply of feedstock for end-users.
Global Glycerin Market Opportunity
Conversion of Glycerol into Advanced Renewable Fuels
The process of Valorization of crude glycerol to produce next-generation renewable fuels, such as Sustainable Aviation Fuel (SAF), presents an opportunity for tremendous growth. The aviation industry has identified the need to decarbonize, and a source of decarbonized hydrogen and bio-jet fuel produced through catalytic reforming processes from glycerin is a viable feedstock for SAF.According to the International Energy Agency (IEA), global biofuel consumption will expand 38 billion litres from 2023 to 2028, with half of this growth coming from renewable diesel and aviation biofuel sources.
Transformed from low-value crude glycerol into high-value energy carriers, converting glycerol offers producers an excellent way to increase profitability while creating sustainability benefits. Approximately 70% of all new global biofuel consumption by 2028 will be driven by emergent or developing market economies; therefore, there is a good opportunity to invest in technologies to convert glycerol into essential components for creating the new green aviation sector. This offers end users access to advanced renewable fuels and consistency with circular economy principles.
Global Glycerin Market Regional Analysis

By Region
- North America
- South America
- Europe
- Asia Pacific
There are high concentrations of the Glycerin Market in regions with developed biodiesel industries and a strong industrial base. In Asia Pacific, the Glycerin Market is the largest with an approximate market share of 40%. The leading countries that contribute to this market are Indonesia, Malaysia, and China. In addition to the large-scale production that takes place in these countries, the Asia Pacific region continues to have large quantities of raw material at its disposal for growing industrial applications; therefore, the production and utilizing of glycerin is linked to one another in an integrated manner.
The vast amount of palm oil being grown creates an environment for the biodiesel industry and thereby provides sales feedstock for the refining industry. As a result of rapid industrialization and a growing middle class demanding more personal care and food products, a cyclical system of supply and demand continues to develop. The synergy between the supply of the raw material and the demand from the end-user allows the Asia Pacific Region to remain a focal point in the Global Glycerin Trade.
Unlock Market Intelligence
Explore the market potential with our data-driven report
Global Glycerin Market Segmentation Analysis
By Grade
- USP Grade
- Industrial Grade
- Pharmaceutical Grade
The glycerine market segments very well by grade, with high-purity grades accounting for the majority of glycerine sale due to the stringent regulatory and safety standards associated with them. High-purity grades, such as USP Grade, are critical for use in human contact applications, such as pharmaceutical and cosmetic formulations due to the high standards of purity required for these products. USP Grade currently holds approximately 60% of the market share and is the established industry standard for high-value applications where quality is a mandatory requirement.
The prevalence of USP Grade reflects the focus of end users on having access to safe, non-toxic, and consistent ingredients throughout the entire product formulation and manufacture. The manufacturers that refine glycerine focus on meeting the requirements of their customers by providing them with high-purity grades, which command the highest trade volumes and market value when compared with technical grade products. This is critical to maintaining a reliable global supply chain for high-quality glycerine products for industries that depend on high-purity glycerine and the associated regulatory compliance.

By Application
- Personal Care
- Food
- Pharmaceuticals
Glycerine is used in a variety of applications, ranging from industrial chemical synthesis to the manufacture of delicate personal care products. The vast majority of the glycerine market is driven by demand for moisture-retaining and emulsifying functionality; the Personal Care segment represents approximately 35% of the total glycerine market and demonstrates the essential role of glycerine in soaps, lotions, and skin care products globally.As more consumers become interested in hydrating and skin-beneficial products, the segment makes up the majority of market revenue.
Glycerin acts as a humectant, allowing for demand to remain constant for daily products. While there are other applications in the commercial sector, personal care products have the highest quantity of use and therefore maintain demand for Refined Glycerin. As a result of this large application base, Refined Glycerin will continue to be produced at a high level by manufacturers, resulting in multiple growth opportunities for the Glycerin Market and increased usage in health, beauty, and hygiene sectors.
Market Players in Global Glycerin Market
These market players maintain a significant presence in the Global glycerin market sector and contribute to its ongoing evolution.
- KLK Oleo
- VVF Ltd
- Wilmar International
- Oleon NV
- Procter & Gamble
- Emery Oleochemicals Group
- Cargill
- BASF SE
- Godrej Industries
- Musim Mas
- IOI Oleochemical
- Vantage Specialty Chemicals
- Croda International Plc
- Kao Corporation
- Eastman Chemical Company
Market News & Updates
- BASF SE, 2025:
BASF SE completed the sale of its Food and Health Performance Ingredients business to Louis Dreyfus Company, including the Illertissen production facility, three application labs, and approximately 300 employees, enabling BASF to focus its portfolio on vitamins and carotenoids for vital nutrition ingredients. The company continues to offer refined bio-based and synthetic food-grade glycerin products supporting clean-label and sustainable sourcing trends, maintaining a 12–16% market share in the food-grade segment. Portfolio optimization in the Intermediates division ensures management of glycerin-derivative markets amid global overcapacity and margin pressure. These strategic moves allow BASF to streamline operations, strengthen core competencies, and maintain its competitive position in high-value glycerin markets while responding to evolving end-user demand for sustainable and multifunctional glycerin applications across food, pharmaceutical, and personal care sectors.
- Wilmar International Limited, 2025:
Wilmar International Limited supplies refined vegetable-derived glycerin under the Wilfarin brand for multifunctional applications in personal care, pharmaceuticals, and food industries, with a 10–14% share in the food-grade glycerin market. The product is characterized by odorless and colorless properties, and the company specializes in refined glycerine USP997 and glycerine monostearate (97%) emulsifiers for bakery, confectionery, and beverage stabilization. Positioned as a primary supplier for clean-label and natural food formulations, Wilmar benefits from global glycerin market growth of 4.8% driven by expansion in personal care and pharmaceutical sectors. The company’s focus on high-quality vegetable-derived glycerin aligns with rising end-user preference for sustainable, bio-based ingredients, enhancing its competitive position in premium and environmentally conscious product segments worldwide.
Frequently Asked Questions
Related Report
1. Market Segmentation
1.1. Research Scope
1.2. Research Methodology
1.3. Definitions and Assumptions
2. Executive Summary
3. Global Glycerin Market Policies, Regulations, and Standards
4. Global Glycerin Market Dynamics
4.1. Growth Factors
4.2. Challenges
4.3. Trends
4.4. Opportunities
5. Global Glycerin Market Statistics, 2022-2032F
5.1. Market Size & Growth Outlook
5.1.1.By Revenues in USD Million
5.2. Market Segmentation & Growth Outlook
5.2.1.By Grade
5.2.1.1. USP Grade- Market Insights and Forecast 2022-2032, USD Million
5.2.1.2. Industrial Grade- Market Insights and Forecast 2022-2032, USD Million
5.2.1.3. Pharmaceutical Grade- Market Insights and Forecast 2022-2032, USD Million
5.2.2.By Application
5.2.2.1. Personal Care- Market Insights and Forecast 2022-2032, USD Million
5.2.2.2. Food- Market Insights and Forecast 2022-2032, USD Million
5.2.2.3. Pharmaceuticals- Market Insights and Forecast 2022-2032, USD Million
5.2.3.By Region
5.2.3.1. North America
5.2.3.2. South America
5.2.3.3. Europe
5.2.3.4. Asia Pacific
5.2.4.By Competitors
5.2.4.1. Competition Characteristics
5.2.4.2. Market Share & Analysis
6. North America Glycerin Market Statistics, 2022-2032F
6.1. Market Size & Growth Outlook
6.1.1.By Revenues in USD Million
6.2. Market Segmentation & Growth Outlook
6.2.1.By Grade- Market Insights and Forecast 2022-2032, USD Million
6.2.2.By Application- Market Insights and Forecast 2022-2032, USD Million
6.2.3.By Country
6.2.3.1. US
6.2.3.2. Canada
6.2.3.3. Mexico
6.2.3.4. Rest of North America
6.3. US Glycerin Market Statistics, 2022-2032F
6.3.1.Market Size & Growth Outlook
6.3.1.1. By Revenues in USD Million
6.3.2.Market Segmentation & Growth Outlook
6.3.2.1. By Grade- Market Insights and Forecast 2022-2032, USD Million
6.3.2.2. By Application- Market Insights and Forecast 2022-2032, USD Million
6.4. Canada Glycerin Market Statistics, 2022-2032F
6.4.1.Market Size & Growth Outlook
6.4.1.1. By Revenues in USD Million
6.4.2.Market Segmentation & Growth Outlook
6.4.2.1. By Grade- Market Insights and Forecast 2022-2032, USD Million
6.4.2.2. By Application- Market Insights and Forecast 2022-2032, USD Million
6.5. Mexico Glycerin Market Statistics, 2022-2032F
6.5.1.Market Size & Growth Outlook
6.5.1.1. By Revenues in USD Million
6.5.2.Market Segmentation & Growth Outlook
6.5.2.1. By Grade- Market Insights and Forecast 2022-2032, USD Million
6.5.2.2. By Application- Market Insights and Forecast 2022-2032, USD Million
7. South America Glycerin Market Statistics, 2022-2032F
7.1. Market Size & Growth Outlook
7.1.1.By Revenues in USD Million
7.2. Market Segmentation & Growth Outlook
7.2.1.By Grade- Market Insights and Forecast 2022-2032, USD Million
7.2.2.By Application- Market Insights and Forecast 2022-2032, USD Million
7.2.3.By Country
7.2.3.1. Brazil
7.2.3.2. Rest of South America
7.3. Brazil Glycerin Market Statistics, 2022-2032F
7.3.1.Market Size & Growth Outlook
7.3.1.1. By Revenues in USD Million
7.3.2.Market Segmentation & Growth Outlook
7.3.2.1. By Grade- Market Insights and Forecast 2022-2032, USD Million
7.3.2.2. By Application- Market Insights and Forecast 2022-2032, USD Million
8. Europe Glycerin Market Statistics, 2022-2032F
8.1. Market Size & Growth Outlook
8.1.1.By Revenues in USD Million
8.2. Market Segmentation & Growth Outlook
8.2.1.By Grade- Market Insights and Forecast 2022-2032, USD Million
8.2.2.By Application- Market Insights and Forecast 2022-2032, USD Million
8.2.3.By Country
8.2.3.1. Germany
8.2.3.2. France
8.2.3.3. UK
8.2.3.4. Italy
8.2.3.5. Spain
8.2.3.6. Netherlands
8.2.3.7. Belgium
8.2.3.8. Russia
8.2.3.9. Poland
8.2.3.10. Turkey
8.2.3.11. Rest of Europe
8.3. Germany Glycerin Market Statistics, 2022-2032F
8.3.1.Market Size & Growth Outlook
8.3.1.1. By Revenues in USD Million
8.3.2.Market Segmentation & Growth Outlook
8.3.2.1. By Grade- Market Insights and Forecast 2022-2032, USD Million
8.3.2.2. By Application- Market Insights and Forecast 2022-2032, USD Million
8.4. France Glycerin Market Statistics, 2022-2032F
8.4.1.Market Size & Growth Outlook
8.4.1.1. By Revenues in USD Million
8.4.2.Market Segmentation & Growth Outlook
8.4.2.1. By Grade- Market Insights and Forecast 2022-2032, USD Million
8.4.2.2. By Application- Market Insights and Forecast 2022-2032, USD Million
8.5. UK Glycerin Market Statistics, 2022-2032F
8.5.1.Market Size & Growth Outlook
8.5.1.1. By Revenues in USD Million
8.5.2.Market Segmentation & Growth Outlook
8.5.2.1. By Grade- Market Insights and Forecast 2022-2032, USD Million
8.5.2.2. By Application- Market Insights and Forecast 2022-2032, USD Million
8.6. Italy Glycerin Market Statistics, 2022-2032F
8.6.1.Market Size & Growth Outlook
8.6.1.1. By Revenues in USD Million
8.6.2.Market Segmentation & Growth Outlook
8.6.2.1. By Grade- Market Insights and Forecast 2022-2032, USD Million
8.6.2.2. By Application- Market Insights and Forecast 2022-2032, USD Million
8.7. Spain Glycerin Market Statistics, 2022-2032F
8.7.1.Market Size & Growth Outlook
8.7.1.1. By Revenues in USD Million
8.7.2.Market Segmentation & Growth Outlook
8.7.2.1. By Grade- Market Insights and Forecast 2022-2032, USD Million
8.7.2.2. By Application- Market Insights and Forecast 2022-2032, USD Million
8.8. Netherlands Glycerin Market Statistics, 2022-2032F
8.8.1.Market Size & Growth Outlook
8.8.1.1. By Revenues in USD Million
8.8.2.Market Segmentation & Growth Outlook
8.8.2.1. By Grade- Market Insights and Forecast 2022-2032, USD Million
8.8.2.2. By Application- Market Insights and Forecast 2022-2032, USD Million
8.9. Belgium Glycerin Market Statistics, 2022-2032F
8.9.1.Market Size & Growth Outlook
8.9.1.1. By Revenues in USD Million
8.9.2.Market Segmentation & Growth Outlook
8.9.2.1. By Grade- Market Insights and Forecast 2022-2032, USD Million
8.9.2.2. By Application- Market Insights and Forecast 2022-2032, USD Million
8.10. Russia Glycerin Market Statistics, 2022-2032F
8.10.1. Market Size & Growth Outlook
8.10.1.1. By Revenues in USD Million
8.10.2. Market Segmentation & Growth Outlook
8.10.2.1. By Grade- Market Insights and Forecast 2022-2032, USD Million
8.10.2.2. By Application- Market Insights and Forecast 2022-2032, USD Million
8.11. Poland Glycerin Market Statistics, 2022-2032F
8.11.1. Market Size & Growth Outlook
8.11.1.1. By Revenues in USD Million
8.11.2. Market Segmentation & Growth Outlook
8.11.2.1. By Grade- Market Insights and Forecast 2022-2032, USD Million
8.11.2.2. By Application- Market Insights and Forecast 2022-2032, USD Million
8.12. Turkey Glycerin Market Statistics, 2022-2032F
8.12.1. Market Size & Growth Outlook
8.12.1.1. By Revenues in USD Million
8.12.2. Market Segmentation & Growth Outlook
8.12.2.1. By Grade- Market Insights and Forecast 2022-2032, USD Million
8.12.2.2. By Application- Market Insights and Forecast 2022-2032, USD Million
9. Asia Pacific Glycerin Market Statistics, 2022-2032F
9.1. Market Size & Growth Outlook
9.1.1.By Revenues in USD Million
9.2. Market Segmentation & Growth Outlook
9.2.1.By Grade- Market Insights and Forecast 2022-2032, USD Million
9.2.2.By Application- Market Insights and Forecast 2022-2032, USD Million
9.2.3.By Country
9.2.3.1. China
9.2.3.2. India
9.2.3.3. Japan
9.2.3.4. South Korea
9.2.3.5. Australia
9.2.3.6. Thailand
9.2.3.7. Rest of Asia Pacific
9.3. China Glycerin Market Statistics, 2022-2032F
9.3.1.Market Size & Growth Outlook
9.3.1.1. By Revenues in USD Million
9.3.2.Market Segmentation & Growth Outlook
9.3.2.1. By Grade- Market Insights and Forecast 2022-2032, USD Million
9.3.2.2. By Application- Market Insights and Forecast 2022-2032, USD Million
9.4. India Glycerin Market Statistics, 2022-2032F
9.4.1.Market Size & Growth Outlook
9.4.1.1. By Revenues in USD Million
9.4.2.Market Segmentation & Growth Outlook
9.4.2.1. By Grade- Market Insights and Forecast 2022-2032, USD Million
9.4.2.2. By Application- Market Insights and Forecast 2022-2032, USD Million
9.5. Japan Glycerin Market Statistics, 2022-2032F
9.5.1.Market Size & Growth Outlook
9.5.1.1. By Revenues in USD Million
9.5.2.Market Segmentation & Growth Outlook
9.5.2.1. By Grade- Market Insights and Forecast 2022-2032, USD Million
9.5.2.2. By Application- Market Insights and Forecast 2022-2032, USD Million
9.6. South Korea Glycerin Market Statistics, 2022-2032F
9.6.1.Market Size & Growth Outlook
9.6.1.1. By Revenues in USD Million
9.6.2.Market Segmentation & Growth Outlook
9.6.2.1. By Grade- Market Insights and Forecast 2022-2032, USD Million
9.6.2.2. By Application- Market Insights and Forecast 2022-2032, USD Million
9.7. Australia Glycerin Market Statistics, 2022-2032F
9.7.1.Market Size & Growth Outlook
9.7.1.1. By Revenues in USD Million
9.7.2.Market Segmentation & Growth Outlook
9.7.2.1. By Grade- Market Insights and Forecast 2022-2032, USD Million
9.7.2.2. By Application- Market Insights and Forecast 2022-2032, USD Million
9.8. Thailand Glycerin Market Statistics, 2022-2032F
9.8.1.Market Size & Growth Outlook
9.8.1.1. By Revenues in USD Million
9.8.2.Market Segmentation & Growth Outlook
9.8.2.1. By Grade- Market Insights and Forecast 2022-2032, USD Million
9.8.2.2. By Application- Market Insights and Forecast 2022-2032, USD Million
10. Competitive Outlook
10.1. Company Profiles
10.1.1. Oleon NV
10.1.1.1. Business Description
10.1.1.2. Product Portfolio
10.1.1.3. Collaborations & Alliances
10.1.1.4. Recent Developments
10.1.1.5. Financial Details
10.1.1.6. Others
10.1.2. Procter & Gamble
10.1.2.1. Business Description
10.1.2.2. Product Portfolio
10.1.2.3. Collaborations & Alliances
10.1.2.4. Recent Developments
10.1.2.5. Financial Details
10.1.2.6. Others
10.1.3. Emery Oleochemicals Group
10.1.3.1. Business Description
10.1.3.2. Product Portfolio
10.1.3.3. Collaborations & Alliances
10.1.3.4. Recent Developments
10.1.3.5. Financial Details
10.1.3.6. Others
10.1.4. Cargill
10.1.4.1. Business Description
10.1.4.2. Product Portfolio
10.1.4.3. Collaborations & Alliances
10.1.4.4. Recent Developments
10.1.4.5. Financial Details
10.1.4.6. Others
10.1.5. BASF SE
10.1.5.1. Business Description
10.1.5.2. Product Portfolio
10.1.5.3. Collaborations & Alliances
10.1.5.4. Recent Developments
10.1.5.5. Financial Details
10.1.5.6. Others
10.1.6. KLK Oleo
10.1.6.1. Business Description
10.1.6.2. Product Portfolio
10.1.6.3. Collaborations & Alliances
10.1.6.4. Recent Developments
10.1.6.5. Financial Details
10.1.6.6. Others
10.1.7. VVF Ltd
10.1.7.1. Business Description
10.1.7.2. Product Portfolio
10.1.7.3. Collaborations & Alliances
10.1.7.4. Recent Developments
10.1.7.5. Financial Details
10.1.7.6. Others
10.1.8. Wilmar International
10.1.8.1. Business Description
10.1.8.2. Product Portfolio
10.1.8.3. Collaborations & Alliances
10.1.8.4. Recent Developments
10.1.8.5. Financial Details
10.1.8.6. Others
10.1.9. Godrej Industries
10.1.9.1. Business Description
10.1.9.2. Product Portfolio
10.1.9.3. Collaborations & Alliances
10.1.9.4. Recent Developments
10.1.9.5. Financial Details
10.1.9.6. Others
10.1.10. Musim Mas
10.1.10.1.Business Description
10.1.10.2.Product Portfolio
10.1.10.3.Collaborations & Alliances
10.1.10.4.Recent Developments
10.1.10.5.Financial Details
10.1.10.6.Others
10.1.11. IOI Oleochemical
10.1.11.1.Business Description
10.1.11.2.Product Portfolio
10.1.11.3.Collaborations & Alliances
10.1.11.4.Recent Developments
10.1.11.5.Financial Details
10.1.11.6.Others
10.1.12. Vantage Specialty Chemicals
10.1.12.1.Business Description
10.1.12.2.Product Portfolio
10.1.12.3.Collaborations & Alliances
10.1.12.4.Recent Developments
10.1.12.5.Financial Details
10.1.12.6.Others
10.1.13. Croda International Plc
10.1.13.1.Business Description
10.1.13.2.Product Portfolio
10.1.13.3.Collaborations & Alliances
10.1.13.4.Recent Developments
10.1.13.5.Financial Details
10.1.13.6.Others
10.1.14. Kao Corporation
10.1.14.1.Business Description
10.1.14.2.Product Portfolio
10.1.14.3.Collaborations & Alliances
10.1.14.4.Recent Developments
10.1.14.5.Financial Details
10.1.14.6.Others
10.1.15. Eastman Chemical Company
10.1.15.1.Business Description
10.1.15.2.Product Portfolio
10.1.15.3.Collaborations & Alliances
10.1.15.4.Recent Developments
10.1.15.5.Financial Details
10.1.15.6.Others
11. Disclaimer
| Segment | Sub-Segment |
|---|---|
| By Grade |
|
| By Application |
|
| By Region |
|
Research Methodology
This study followed a structured approach comprising four key phases to assess the size and scope of the electro-oxidation market. The process began with thorough secondary research to collect data on the target market, related markets, and broader industry context. These findings, along with preliminary assumptions and estimates, were then validated through extensive primary research involving industry experts from across the value chain. To calculate the overall market size, both top-down and bottom-up methodologies were employed. Finally, market segmentation and data triangulation techniques were applied to refine and validate segment-level estimations.
Secondary Research
The secondary research phase involved gathering data from a wide range of credible and published sources. This step helped in identifying industry trends, defining market segmentation, and understanding the market landscape and value chain.
Sources consulted during this phase included:
- Company annual reports, investor presentations, and press releases
- Industry white papers and certified publications
- Trade directories and market-recognized databases
- Articles from authoritative authors and reputable journals
- Gold and silver standard websites
Secondary research was critical in mapping out the industry's value chain and monetary flow, identifying key market segments, understanding regional variations, and tracking significant industry developments.
Other key sources:
- Financial disclosures
- Industry associations and trade bodies
- News outlets and business magazines
- Academic journals and research studies
- Paid industry databases
Primary Research
To validate secondary data and gain deeper market insights, primary research was conducted with key stakeholders across both the supply and demand sides of the market.
On the demand side, participants included decision-makers and influencers from end-user industries—such as CIOs, CTOs, and CSOs—who provided first-hand perspectives on market needs, product usage, and future expectations.
On the supply side, interviews were conducted with manufacturers, industry associations, and institutional participants to gather insights into current offerings, product pipelines, and market challenges.
Primary interviews provided critical inputs such as:
- Market size and revenue data
- Product and service breakdowns
- Market forecasts
- Regional and application-specific trends
Stakeholders consulted included:
- Leading OEM and solution providers
- Channel and distribution partners
- End users across various applications
- Independent consultants and industry specialists
Market Size Estimation and Data Triangulation
- Identifying Key Market Participants (Secondary Research)
- Goal: To identify the major players or companies in the target market. This typically involves using publicly available data sources such as industry reports, market research publications, and financial statements of companies.
- Tools: Reports from firms like Gartner, Forrester, Euromonitor, Statista, IBISWorld, and others. Public financial statements, news articles, and press releases from top market players.
- Extracting Earnings of Key Market Participants
- Goal: To estimate the earnings generated from the product or service being analyzed. This step helps in understanding the revenue potential of each market player in a specific geography.
- Methods: Earnings data can be gathered from:
- Publicly available financial reports (for listed companies).
- Interviews and primary data sources from professionals, such as Directors, VPs, SVPs, etc. This is especially useful for understanding more nuanced, internal data that isn't publicly disclosed.
- Annual reports and investor presentations of key players.
- Data Collation and Development of a Relevant Data Model
- Goal: To collate inputs from both primary and secondary sources into a structured, data-driven model for market estimation. This model will incorporate key market KPIs and any independent variables relevant to the market.
- Key KPIs: These could include:
- Market size, growth rate, and demand drivers.
- Industry-specific metrics like market share, average revenue per customer (ARPC), or average deal size.
- External variables, such as economic growth rates, inflation rates, or commodity prices, that could affect the market.
- Data Modeling: Based on this data, the market forecasts are developed for the next 5 years. A combination of trend analysis, scenario modeling, and statistical regression might be used to generate projections.
- Scenario Analysis
- Goal: To test different assumptions and validate how sensitive the market is to changes in key variables (e.g., market demand, regulatory changes, technological disruptions).
- Types of Scenarios:
- Base Case: Based on current assumptions and historical data.
- Best-Case Scenario: Assuming favorable market conditions, regulatory environments, and technological advancements.
- Worst-Case Scenario: Accounting for adverse factors, such as economic downturns, stricter regulations, or unexpected disruptions.


