Global Isopropyl Alcohol Market Report: Trends, Growth and Forecast (2026-2032)
Grade (Industrial Grade, Pharmaceutical Grade, Electronic Grade), Application (Cleaning Solvents, Pharmaceuticals, Cosmetics & Personal Care, Paints & Coatings, Others), End-Use Industry (Healthcare, Pharmaceuticals, Cosmetics & Personal Care, Food & Beverages, Paints & Coatings, Chemicals, Electronics, Agrochemicals, Others), Region (North America, South America, Europe, Middle East & Africa, Asia Pacific) ... Read more
|
Major Players
|
Global Isopropyl Alcohol Market Statistics and Insights, 2026
- Market Size Statistics
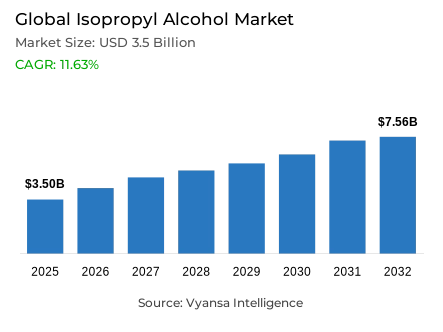
- Global isopropyl alcohol market is estimated at USD 3.5 billion.
- The market size is expected to grow to USD 7.56 billion by 2032.
- Market to register a CAGR of around 11.63% during 2026-32.
- Grade Shares
- Industrial grade grabbed market share of 60%.
- Competition
- More than 20 companies are actively engaged in producing isopropyl alcohol.
- Top 5 companies acquired around 60% of the market share.
- Linde plc; LyondellBasell Industries N.V.; Mitsubishi Chemical Holdings Corporation; Dow Inc.; Ecolab Inc. etc., are few of the top companies.
- Application
- Cleaning solvents grabbed 40% of the market.
- Region
- Asia Pacific leads with a 40% share of the global market.
Global Isopropyl Alcohol Market Outlook
In 2025, it is estimated that the global Isopropyl Alcohol (IPA) market will be worth approximately $3.5 billion and will grow to approximately $7.56 billion in 2032 at an average CAGR of about 11.63% for the period 2026–32 (AAGR for 2026–32). The ongoing growth in the demand for effective disinfection and antiseptic products continues to result from the continuing impact of Healthcare Associated Infections. Isopropyl Alcohol plays a critical role in pharmaceutical formulation, sterilisation, and cleanroom activities, all of which must comply with strict hygiene guidelines for hospitals and other healthcare facilities; as such, continued growth will occur due to the growing availability of healthcare and the heightened awareness of hygiene following the COVID-19 pandemic regarding the need for additional disinfection products (e.g., hand sanitiser) and/or products for medical cleaning purposes.
In industrial applications, there is also a significant contribution to the demand for Isopropyl Alcohol (IPA) from the Semiconductor and Electronics industries; high purity IPA is necessary for the precision cleaning and residue removal required in these industries, while general use/grade IPA (60% of total IPA consumption) is primarily used to manufacture, chemically process, paint, coat and clean across most manufacturing sectors.
When broken down into applications, Isopropyl Alcohol (IPA) is mainly used for cleaning and is the largest application category (40% of IPA usage). As a result, cleaning solvents contain the largest amount of Isopropyl Alcohol used by end-users and Across all sectors. Cleaning solvents based on Isopropyl Alcohol (IPA) are commonly used for degreasing, surface disinfection, and cleaning electronics. Other applications, such as the Synthesis of Pharmaceuticals, General and Personal Care, and Process Solvent, also continue to consume Isopropyl Alcohol (IPA) at relatively stable volumes week-to-week.
The Asia Pacific region has the largest Isopropyl Alcohol (IPA) market share of 40% globally due to its large industrial and pharmaceutical manufacturing and production of personal care products and electronics. The main consumer nations, China, India, and Japan, are located in this region and support Production and Consumption in this area with various government support initiatives, lower production costs, and substantial investments in chemical and pharmaceutical infrastructure. Asia Pacific is therefore a strategic region for Isopropyl Alcohol (IPA) Supply Chains, both Industrial-Grade and High-Purity products.

Global Isopropyl Alcohol Market Growth Driver
Rising Healthcare Awareness and Expanding Pharmaceutical Demand
The Global Isopropyl Alcohol (IPA) Market is being driven by the continuing rise of healthcare-associated infections (HAIs) globally, driving demand for disinfectants and antiseptics. According to the World Health Organization (WHO) approximately one out of ten patients admitted to an acute care facility is affected by HAIs, while those living in low or middle income regions have a higher prevalence of 15%, compared to those living in high-income countries who have a lower rate of 7%. The growth of the pharmaceutical industry has also been a leading reason for increased consumption of IPA due to not only the growth of the pharmaceutical industry in terms of both manufacturing and innovation, but also that IPA continues to be an essential solvent and sterilizing agent used in drug formulation and cleanroom operations. The focus on higher levels of hygiene in hospitals and healthcare facilities is also driving consumption of IPA in these facilities.
In addition to being a critical part of the pharmaceutical industry, the semiconductor manufacturing industry is also a very large driving force in increasing the demand for IPA. IPA is utilized as a cleaning agent and for removing residues during precision cleaning and the fabrication of both semiconductors and PCBs. By ensuring proper contamination control and process efficiency, IPA is essential to the growth of AI, data center, and electronics manufacturing. As such, the need for high-purity IPA will continue to expand due to increased activity of these three industries and their reliance on high-quality products.
Global Isopropyl Alcohol Market Challenge
Raw Material Volatility and Production Cost Challenges
As the dominant feedstock for IPA, propylene has experienced considerable price volatility as a result of crude oil market fluctuations and geopolitical influences. Propylene capacity in China is projected to exceed consumption, resulting in an overabundant supply of propylene and unpredictable pricing of raw materials; this puts pressure on profit margins and complicates the pricing strategies employed by IPA manufacturers around the world. Additionally, IPA producers face increased operational complexity because of the myriad of regulatory requirements associated with the production of IPA in multiple industries - pharmaceuticals, electronics, food production, and chemical manufacturing.
Therefore, IPA producers are required to have diversified production streams for each industry to comply with the respective regulatory requirements, such as USP, EP, and JP; also, each production stream must be able to achieve consistent quality across all consumer markets (i.e., industrial, pharmaceutical, and electronic-grade). Collectively, the regulatory pressures placed on IPA producers regarding cost, purity, and operational requirements create ongoing financial and logistical challenges for companies engaged in the global IPA market.
Unlock Market Intelligence
Explore the market potential with our data-driven report
Global Isopropyl Alcohol Market Trend
Expanding Electronics Manufacturing Driving Specialized IPA Applications
The industrial electronics market continues to represent an ever-increasing demand for the use of isopropyl alcohol (IPA) in both precision cleaning and removal of residues. The application of IPA in the cleaning of semiconductor and printed circuit board (PCB) parts removes flux residue as well as other contaminants (i.e., oil and dust), while protecting sensitive electronic components. Therefore, as global manufacturers of semiconductors and electronics grow to meet the increasing demand for technology, the overall consumption of high-purity (99.99% pure; triple-distilled) IPA for these electronic manufacturing applications will continue to increase.
The application of isopropyl alcohol (IPA) is becoming increasingly important in the healthcare industry with many manufacturers establishing or expanding their manufacture of IPA in regions where demand is greatest. This trend allows for manufacturers to reduce turn-around times, improve supply chain resiliency, and ensure compliance with local and/or regional regulations, while providing long-term security of supply, the ability to respond quickly to changes in demand, and better align with regional sustainability initiatives. Furthermore, companies that have regional production operations will gain a competitive edge over companies that do not due to having faster and more reliable service, lower-cost logistics, and better penetration into regional markets, which will allow for greater opportunity for growth among key industrial end-users.
Global Isopropyl Alcohol Market Opportunity
Rising Healthcare Infrastructure and Surface Disinfectant Adoption
Increased access to healthcare services and the growing elderly population, there is continuing and increased demand for high-quality isopropyl alcohol (IPA) in pharmaceutical formulation, sterilization, and clean room operations. In recent years, the global emphasis on post-pandemic "hygiene" has been coupled with the need for heightened "infection control" measures, and increased investment in healthcare infrastructure, which has solidified the role of isopropyl alcohol (IPA) as a key component in disinfectants, hand sanitizers, and medical grade cleaning solutions.
With higher awareness regarding hygiene and the need for isopropyl alcohol (IPA)-based solutions to meet the needs of healthcare facilities, demand for the usage of isopropyl alcohol (IPA) in hospitals, schools, and homes will remain high. Therefore, collectively, these trends will ultimately position isopropyl alcohol (IPA) to be the most critical component to help support and/or realize existing global hygiene standards, especially regarding the healthcare and pharmaceutical manufacturing industries, as well as commercial cleaning applications.
Global Isopropyl Alcohol Market Regional Analysis

By Region
- North America
- South America
- Europe
- Middle East & Africa
- Asia Pacific
Asia Pacific commands a dominant 40% share of the global IPA market, driven by industrial and pharmaceutical manufacturing, personal care production, and a substantial electronics sector. China, India, and Japan are central production and consumption hubs, with China contributing significant propylene feedstock capacity and pharmaceutical output. Rapid industrialization, urbanization, and rising middle-class populations sustain robust demand for IPA in healthcare, industrial cleaning, and manufacturing processes.
Favorable government policies, lower production costs, and major investments in chemical infrastructure reinforce the region’s leadership. Southeast Asian nations are experiencing accelerated industrialization and pharmaceutical growth, while India’s petrochemical program strengthens backward integration into solvent production. The regional concentration of manufacturing expertise, production capacity, and end-user demand positions Asia Pacific as the strategic center for global IPA supply chains, supporting both volume and high-purity IPA market segments.
Unlock Market Intelligence
Explore the market potential with our data-driven report
Global Isopropyl Alcohol Market Segmentation Analysis
By Grade
- Industrial Grade
- Pharmaceutical Grade
- Electronic Grade
Industrial-grade IPA holds the largest market share at 60%, reflecting its widespread application in manufacturing, cleaning, and solvent extraction processes where high purity is not critical. This segment encompasses technical-grade uses across pharmaceuticals, chemicals, paints, coatings, and general industrial cleaning operations. Its cost-effectiveness and cleaning performance make it the preferred choice for end users requiring bulk quantities without stringent purity specifications, maintaining robust market value and widespread adoption.
The remaining 40% of the market comprises pharmaceutical-grade (USP) and electronic-grade IPA. Pharmaceutical-grade products adhere to strict quality standards for medical formulations and device sterilization, commanding premium pricing. Electronic-grade IPA, required for semiconductor and microelectronics cleaning, offers ultra-low impurity levels critical for contamination-sensitive applications. Although smaller in volumetric share, these high-purity grades contribute disproportionately to revenue due to specialized production and rigorous end-use requirements, highlighting the segment’s strategic importance in the global market.

By Application
- Cleaning Solvents
- Pharmaceuticals
- Cosmetics & Personal Care
- Paints & Coatings
- Others
Cleaning solvent applications account for the largest market share at 40%, reflecting extensive use across industrial, healthcare, and commercial sectors. IPA-based cleaning solutions are employed for degreasing, surface disinfection, and electronics cleaning, benefiting from heightened hygiene awareness post-COVID-19. Hospitals, industrial facilities, transportation systems, and commercial establishments increasingly rely on IPA for effective residue removal, contamination control, and general-purpose cleaning operations.
Pharmaceutical synthesis, personal care, and process solvent applications account for the remaining 60% of market demand. Pharmaceutical uses involve drug synthesis, sterilization, and formulation of finished products. Personal care demand is driven by hand sanitizers, disinfectant wipes, and cosmetic preparations. Process solvent applications in chemical and food industries benefit from expanding industrialization and chemical manufacturing capacity in emerging markets. Collectively, these applications ensure consistent IPA consumption across diverse end-user segments.
Market Players in Global Isopropyl Alcohol Market
These market players maintain a significant presence in the Global isopropyl alcohol market sector and contribute to its ongoing evolution.
- Linde plc
- LyondellBasell Industries N.V.
- Mitsubishi Chemical Holdings Corporation
- Dow Inc.
- Ecolab Inc.
- ExxonMobil Corporation
- INEOS Group Ltd
- LG Chem Ltd.
- Mistral Industrial Chemicals
- Perrigo Company plc
- ReAgent Chemicals Ltd.
- Royal Dutch Shell plc
- Sasol Limited
- Tokuyama Corporation
- Avantor
Market News & Updates
- ExxonMobil Corporation, 2025:
Announced $100 million investment to upgrade its Baton Rouge facility (world's largest IPA plant) to produce 99.999% ultra-pure isopropyl alcohol for semiconductor manufacturing by 2027, establishing a fully domestic U.S. supply chain.
- LyondellBasell Industries N.V., 2025:
Announced $0.10 per pound price increase for isopropyl alcohol effective March 19, 2025, citing rising production costs, while managing a temporary Force Majeure closure at Texas facility.
Frequently Asked Questions
Related Report
1. Market Segmentation
1.1. Research Scope
1.2. Research Methodology
1.3. Definitions and Assumptions
2. Executive Summary
3. Global Isopropyl Alcohol Market Policies, Regulations, and Standards
4. Global Isopropyl Alcohol Market Dynamics
4.1. Growth Factors
4.2. Challenges
4.3. Trends
4.4. Opportunities
5. Global Isopropyl Alcohol Market Statistics, 2022-2032F
5.1. Market Size & Growth Outlook
5.1.1.By Revenues in USD Million
5.1.2.By Volume (Kilo Tons)
5.2. Market Segmentation & Growth Outlook
5.2.1.By Grade
5.2.1.1. Industrial Grade- Market Insights and Forecast 2022-2032, USD Million
5.2.1.2. Pharmaceutical Grade- Market Insights and Forecast 2022-2032, USD Million
5.2.1.3. Electronic Grade- Market Insights and Forecast 2022-2032, USD Million
5.2.2.By Application
5.2.2.1. Cleaning Solvents- Market Insights and Forecast 2022-2032, USD Million
5.2.2.2. Pharmaceuticals- Market Insights and Forecast 2022-2032, USD Million
5.2.2.3. Cosmetics & Personal Care- Market Insights and Forecast 2022-2032, USD Million
5.2.2.4. Paints & Coatings- Market Insights and Forecast 2022-2032, USD Million
5.2.2.5. Others- Market Insights and Forecast 2022-2032, USD Million
5.2.3.By End-Use Industry
5.2.3.1. Healthcare- Market Insights and Forecast 2022-2032, USD Million
5.2.3.2. Pharmaceuticals- Market Insights and Forecast 2022-2032, USD Million
5.2.3.3. Cosmetics & Personal Care- Market Insights and Forecast 2022-2032, USD Million
5.2.3.4. Food & Beverages- Market Insights and Forecast 2022-2032, USD Million
5.2.3.5. Paints & Coatings- Market Insights and Forecast 2022-2032, USD Million
5.2.3.6. Chemicals- Market Insights and Forecast 2022-2032, USD Million
5.2.3.7. Electronics- Market Insights and Forecast 2022-2032, USD Million
5.2.3.8. Agrochemicals- Market Insights and Forecast 2022-2032, USD Million
5.2.3.9. Others- Market Insights and Forecast 2022-2032, USD Million
5.2.4.By Region
5.2.4.1. North America
5.2.4.2. South America
5.2.4.3. Europe
5.2.4.4. Middle East & Africa
5.2.4.5. Asia Pacific
5.2.5.By Competitors
5.2.5.1. Competition Characteristics
5.2.5.2. Market Share & Analysis
6. North America Isopropyl Alcohol Market Statistics, 2022-2032F
6.1. Market Size & Growth Outlook
6.1.1.By Revenues in USD Million
6.1.2.By Volume (Kilo Tons)
6.2. Market Segmentation & Growth Outlook
6.2.1.By Grade- Market Insights and Forecast 2022-2032, USD Million
6.2.2.By Application- Market Insights and Forecast 2022-2032, USD Million
6.2.3.By End-Use Industry- Market Insights and Forecast 2022-2032, USD Million
6.2.4.By Country
6.2.4.1. US
6.2.4.2. Canada
6.2.4.3. Mexico
6.2.4.4. Rest of North America
6.3. US Isopropyl Alcohol Market Statistics, 2022-2032F
6.3.1.Market Size & Growth Outlook
6.3.1.1. By Revenues in USD Million
6.3.1.2. By Volume (Kilo Tons)
6.3.2.Market Segmentation & Growth Outlook
6.3.2.1. By Grade- Market Insights and Forecast 2022-2032, USD Million
6.3.2.2. By Application- Market Insights and Forecast 2022-2032, USD Million
6.4. Canada Isopropyl Alcohol Market Statistics, 2022-2032F
6.4.1.Market Size & Growth Outlook
6.4.1.1. By Revenues in USD Million
6.4.1.2. By Volume (Kilo Tons)
6.4.2.Market Segmentation & Growth Outlook
6.4.2.1. By Grade- Market Insights and Forecast 2022-2032, USD Million
6.4.2.2. By Application- Market Insights and Forecast 2022-2032, USD Million
6.5. Mexico Isopropyl Alcohol Market Statistics, 2022-2032F
6.5.1.Market Size & Growth Outlook
6.5.1.1. By Revenues in USD Million
6.5.1.2. By Volume (Kilo Tons)
6.5.2.Market Segmentation & Growth Outlook
6.5.2.1. By Grade- Market Insights and Forecast 2022-2032, USD Million
6.5.2.2. By Application- Market Insights and Forecast 2022-2032, USD Million
7. South America Isopropyl Alcohol Market Statistics, 2022-2032F
7.1. Market Size & Growth Outlook
7.1.1.By Revenues in USD Million
7.1.2.By Volume (Kilo Tons)
7.2. Market Segmentation & Growth Outlook
7.2.1.By Grade- Market Insights and Forecast 2022-2032, USD Million
7.2.2.By Application- Market Insights and Forecast 2022-2032, USD Million
7.2.3.By End-Use Industry- Market Insights and Forecast 2022-2032, USD Million
7.2.4.By Country
7.2.4.1. Brazil
7.2.4.2. Argentina
7.2.4.3. Rest of South America
7.3. Brazil Isopropyl Alcohol Market Statistics, 2022-2032F
7.3.1.Market Size & Growth Outlook
7.3.1.1. By Revenues in USD Million
7.3.1.2. By Volume (Kilo Tons)
7.3.2.Market Segmentation & Growth Outlook
7.3.2.1. By Grade- Market Insights and Forecast 2022-2032, USD Million
7.3.2.2. By Application- Market Insights and Forecast 2022-2032, USD Million
7.4. Argentina Isopropyl Alcohol Market Statistics, 2022-2032F
7.4.1.Market Size & Growth Outlook
7.4.1.1. By Revenues in USD Million
7.4.1.2. By Volume (Kilo Tons)
7.4.2.Market Segmentation & Growth Outlook
7.4.2.1. By Grade- Market Insights and Forecast 2022-2032, USD Million
7.4.2.2. By Application- Market Insights and Forecast 2022-2032, USD Million
8. Europe Isopropyl Alcohol Market Statistics, 2022-2032F
8.1. Market Size & Growth Outlook
8.1.1.By Revenues in USD Million
8.1.2.By Volume (Kilo Tons)
8.2. Market Segmentation & Growth Outlook
8.2.1.By Grade- Market Insights and Forecast 2022-2032, USD Million
8.2.2.By Application- Market Insights and Forecast 2022-2032, USD Million
8.2.3.By End-Use Industry- Market Insights and Forecast 2022-2032, USD Million
8.2.4.By Country
8.2.4.1. Germany
8.2.4.2. France
8.2.4.3. UK
8.2.4.4. Russia
8.2.4.5. Italy
8.2.4.6. Spain
8.2.4.7. Netherlands
8.2.4.8. Belgium
8.2.4.9. Poland
8.2.4.10. Turkey
8.2.4.11. Rest of Europe
8.3. Germany Isopropyl Alcohol Market Statistics, 2022-2032F
8.3.1.Market Size & Growth Outlook
8.3.1.1. By Revenues in USD Million
8.3.1.2. By Volume (Kilo Tons)
8.3.2.Market Segmentation & Growth Outlook
8.3.2.1. By Grade- Market Insights and Forecast 2022-2032, USD Million
8.3.2.2. By Application- Market Insights and Forecast 2022-2032, USD Million
8.4. France Isopropyl Alcohol Market Statistics, 2022-2032F
8.4.1.Market Size & Growth Outlook
8.4.1.1. By Revenues in USD Million
8.4.1.2. By Volume (Kilo Tons)
8.4.2.Market Segmentation & Growth Outlook
8.4.2.1. By Grade- Market Insights and Forecast 2022-2032, USD Million
8.4.2.2. By Application- Market Insights and Forecast 2022-2032, USD Million
8.5. UK Isopropyl Alcohol Market Statistics, 2022-2032F
8.5.1.Market Size & Growth Outlook
8.5.1.1. By Revenues in USD Million
8.5.1.2. By Volume (Kilo Tons)
8.5.2.Market Segmentation & Growth Outlook
8.5.2.1. By Grade- Market Insights and Forecast 2022-2032, USD Million
8.5.2.2. By Application- Market Insights and Forecast 2022-2032, USD Million
8.6. Russia Isopropyl Alcohol Market Statistics, 2022-2032F
8.6.1.Market Size & Growth Outlook
8.6.1.1. By Revenues in USD Million
8.6.1.2. By Volume (Kilo Tons)
8.6.2.Market Segmentation & Growth Outlook
8.6.2.1. By Grade- Market Insights and Forecast 2022-2032, USD Million
8.6.2.2. By Application- Market Insights and Forecast 2022-2032, USD Million
8.7. Italy Isopropyl Alcohol Market Statistics, 2022-2032F
8.7.1.Market Size & Growth Outlook
8.7.1.1. By Revenues in USD Million
8.7.1.2. By Volume (Kilo Tons)
8.7.2.Market Segmentation & Growth Outlook
8.7.2.1. By Grade- Market Insights and Forecast 2022-2032, USD Million
8.7.2.2. By Application- Market Insights and Forecast 2022-2032, USD Million
8.8. Spain Isopropyl Alcohol Market Statistics, 2022-2032F
8.8.1.Market Size & Growth Outlook
8.8.1.1. By Revenues in USD Million
8.8.1.2. By Volume (Kilo Tons)
8.8.2.Market Segmentation & Growth Outlook
8.8.2.1. By Grade- Market Insights and Forecast 2022-2032, USD Million
8.8.2.2. By Application- Market Insights and Forecast 2022-2032, USD Million
8.9. Netherlands Isopropyl Alcohol Market Statistics, 2022-2032F
8.9.1.Market Size & Growth Outlook
8.9.1.1. By Revenues in USD Million
8.9.1.2. By Volume (Kilo Tons)
8.9.2.Market Segmentation & Growth Outlook
8.9.2.1. By Grade- Market Insights and Forecast 2022-2032, USD Million
8.9.2.2. By Application- Market Insights and Forecast 2022-2032, USD Million
8.10. Belgium Isopropyl Alcohol Market Statistics, 2022-2032F
8.10.1. Market Size & Growth Outlook
8.10.1.1. By Revenues in USD Million
8.10.1.2. By Volume (Kilo Tons)
8.10.2. Market Segmentation & Growth Outlook
8.10.2.1. By Grade- Market Insights and Forecast 2022-2032, USD Million
8.10.2.2. By Application- Market Insights and Forecast 2022-2032, USD Million
8.11. Poland Isopropyl Alcohol Market Statistics, 2022-2032F
8.11.1. Market Size & Growth Outlook
8.11.1.1. By Revenues in USD Million
8.11.1.2. By Volume (Kilo Tons)
8.11.2. Market Segmentation & Growth Outlook
8.11.2.1. By Grade- Market Insights and Forecast 2022-2032, USD Million
8.11.2.2. By Application- Market Insights and Forecast 2022-2032, USD Million
8.12. Turkey Isopropyl Alcohol Market Statistics, 2022-2032F
8.12.1. Market Size & Growth Outlook
8.12.1.1. By Revenues in USD Million
8.12.1.2. By Volume (Kilo Tons)
8.12.2. Market Segmentation & Growth Outlook
8.12.2.1. By Grade- Market Insights and Forecast 2022-2032, USD Million
8.12.2.2. By Application- Market Insights and Forecast 2022-2032, USD Million
9. Middle East & Africa Isopropyl Alcohol Market Statistics, 2022-2032F
9.1. Market Size & Growth Outlook
9.1.1.By Revenues in USD Million
9.1.2.By Volume (Kilo Tons)
9.2. Market Segmentation & Growth Outlook
9.2.1.By Grade- Market Insights and Forecast 2022-2032, USD Million
9.2.2.By Application- Market Insights and Forecast 2022-2032, USD Million
9.2.3.By End-Use Industry- Market Insights and Forecast 2022-2032, USD Million
9.2.4.By Country
9.2.4.1. Saudi Arabia
9.2.4.2. United Arab Emirates
9.2.4.3. South Africa
9.2.4.4. Egypt
9.2.4.5. Nigeria
9.2.4.6. Rest of Middle East & Africa
9.3. Saudi Arabia Isopropyl Alcohol Market Statistics, 2022-2032F
9.3.1.Market Size & Growth Outlook
9.3.1.1. By Revenues in USD Million
9.3.1.2. By Volume (Kilo Tons)
9.3.2.Market Segmentation & Growth Outlook
9.3.2.1. By Grade- Market Insights and Forecast 2022-2032, USD Million
9.3.2.2. By Application- Market Insights and Forecast 2022-2032, USD Million
9.4. United Arab Emirates Isopropyl Alcohol Market Statistics, 2022-2032F
9.4.1.Market Size & Growth Outlook
9.4.1.1. By Revenues in USD Million
9.4.1.2. By Volume (Kilo Tons)
9.4.2.Market Segmentation & Growth Outlook
9.4.2.1. By Grade- Market Insights and Forecast 2022-2032, USD Million
9.4.2.2. By Application- Market Insights and Forecast 2022-2032, USD Million
9.5. South Africa Isopropyl Alcohol Market Statistics, 2022-2032F
9.5.1.Market Size & Growth Outlook
9.5.1.1. By Revenues in USD Million
9.5.1.2. By Volume (Kilo Tons)
9.5.2.Market Segmentation & Growth Outlook
9.5.2.1. By Grade- Market Insights and Forecast 2022-2032, USD Million
9.5.2.2. By Application- Market Insights and Forecast 2022-2032, USD Million
9.6. Egypt Isopropyl Alcohol Market Statistics, 2022-2032F
9.6.1.Market Size & Growth Outlook
9.6.1.1. By Revenues in USD Million
9.6.1.2. By Volume (Kilo Tons)
9.6.2.Market Segmentation & Growth Outlook
9.6.2.1. By Grade- Market Insights and Forecast 2022-2032, USD Million
9.6.2.2. By Application- Market Insights and Forecast 2022-2032, USD Million
9.7. Nigeria Isopropyl Alcohol Market Statistics, 2022-2032F
9.7.1.Market Size & Growth Outlook
9.7.1.1. By Revenues in USD Million
9.7.1.2. By Volume (Kilo Tons)
9.7.2.Market Segmentation & Growth Outlook
9.7.2.1. By Grade- Market Insights and Forecast 2022-2032, USD Million
9.7.2.2. By Application- Market Insights and Forecast 2022-2032, USD Million
10. Asia Pacific Isopropyl Alcohol Market Statistics, 2022-2032F
10.1. Market Size & Growth Outlook
10.1.1. By Revenues in USD Million
10.1.2. By Volume (Kilo Tons)
10.2. Market Segmentation & Growth Outlook
10.2.1. By Grade- Market Insights and Forecast 2022-2032, USD Million
10.2.2. By Application- Market Insights and Forecast 2022-2032, USD Million
10.2.3. By End-Use Industry- Market Insights and Forecast 2022-2032, USD Million
10.2.4. By Country
10.2.4.1. China
10.2.4.2. India
10.2.4.3. Japan
10.2.4.4. South Korea
10.2.4.5. Australia
10.2.4.6. Thailand
10.2.4.7. Rest of Asia Pacific
10.3. China Isopropyl Alcohol Market Statistics, 2022-2032F
10.3.1. Market Size & Growth Outlook
10.3.1.1. By Revenues in USD Million
10.3.1.2. By Volume (Kilo Tons)
10.3.2. Market Segmentation & Growth Outlook
10.3.2.1. By Grade- Market Insights and Forecast 2022-2032, USD Million
10.3.2.2. By Application- Market Insights and Forecast 2022-2032, USD Million
10.4. India Isopropyl Alcohol Market Statistics, 2022-2032F
10.4.1. Market Size & Growth Outlook
10.4.1.1. By Revenues in USD Million
10.4.1.2. By Volume (Kilo Tons)
10.4.2. Market Segmentation & Growth Outlook
10.4.2.1. By Grade- Market Insights and Forecast 2022-2032, USD Million
10.4.2.2. By Application- Market Insights and Forecast 2022-2032, USD Million
10.5. Japan Isopropyl Alcohol Market Statistics, 2022-2032F
10.5.1. Market Size & Growth Outlook
10.5.1.1. By Revenues in USD Million
10.5.1.2. By Volume (Kilo Tons)
10.5.2. Market Segmentation & Growth Outlook
10.5.2.1. By Grade- Market Insights and Forecast 2022-2032, USD Million
10.5.2.2. By Application- Market Insights and Forecast 2022-2032, USD Million
10.6. South Korea Isopropyl Alcohol Market Statistics, 2022-2032F
10.6.1. Market Size & Growth Outlook
10.6.1.1. By Revenues in USD Million
10.6.1.2. By Volume (Kilo Tons)
10.6.2. Market Segmentation & Growth Outlook
10.6.2.1. By Grade- Market Insights and Forecast 2022-2032, USD Million
10.6.2.2. By Application- Market Insights and Forecast 2022-2032, USD Million
10.7. Australia Isopropyl Alcohol Market Statistics, 2022-2032F
10.7.1. Market Size & Growth Outlook
10.7.1.1. By Revenues in USD Million
10.7.1.2. By Volume (Kilo Tons)
10.7.2. Market Segmentation & Growth Outlook
10.7.2.1. By Grade- Market Insights and Forecast 2022-2032, USD Million
10.7.2.2. By Application- Market Insights and Forecast 2022-2032, USD Million
10.8. Thailand Isopropyl Alcohol Market Statistics, 2022-2032F
10.8.1. Market Size & Growth Outlook
10.8.1.1. By Revenues in USD Million
10.8.1.2. By Volume (Kilo Tons)
10.8.2. Market Segmentation & Growth Outlook
10.8.2.1. By Grade- Market Insights and Forecast 2022-2032, USD Million
10.8.2.2. By Application- Market Insights and Forecast 2022-2032, USD Million
11. Competitive Outlook
11.1. Company Profiles
11.1.1. Dow Inc.
11.1.1.1. Business Description
11.1.1.2. Product Portfolio
11.1.1.3. Collaborations & Alliances
11.1.1.4. Recent Developments
11.1.1.5. Financial Details
11.1.1.6. Others
11.1.2. Ecolab Inc.
11.1.2.1. Business Description
11.1.2.2. Product Portfolio
11.1.2.3. Collaborations & Alliances
11.1.2.4. Recent Developments
11.1.2.5. Financial Details
11.1.2.6. Others
11.1.3. ExxonMobil Corporation
11.1.3.1. Business Description
11.1.3.2. Product Portfolio
11.1.3.3. Collaborations & Alliances
11.1.3.4. Recent Developments
11.1.3.5. Financial Details
11.1.3.6. Others
11.1.4. INEOS Group Ltd
11.1.4.1. Business Description
11.1.4.2. Product Portfolio
11.1.4.3. Collaborations & Alliances
11.1.4.4. Recent Developments
11.1.4.5. Financial Details
11.1.4.6. Others
11.1.5. LG Chem Ltd.
11.1.5.1. Business Description
11.1.5.2. Product Portfolio
11.1.5.3. Collaborations & Alliances
11.1.5.4. Recent Developments
11.1.5.5. Financial Details
11.1.5.6. Others
11.1.6. Linde plc
11.1.6.1. Business Description
11.1.6.2. Product Portfolio
11.1.6.3. Collaborations & Alliances
11.1.6.4. Recent Developments
11.1.6.5. Financial Details
11.1.6.6. Others
11.1.7. LyondellBasell Industries N.V.
11.1.7.1. Business Description
11.1.7.2. Product Portfolio
11.1.7.3. Collaborations & Alliances
11.1.7.4. Recent Developments
11.1.7.5. Financial Details
11.1.7.6. Others
11.1.8. Mitsubishi Chemical Holdings Corporation
11.1.8.1. Business Description
11.1.8.2. Product Portfolio
11.1.8.3. Collaborations & Alliances
11.1.8.4. Recent Developments
11.1.8.5. Financial Details
11.1.8.6. Others
11.1.9. Mistral Industrial Chemicals
11.1.9.1. Business Description
11.1.9.2. Product Portfolio
11.1.9.3. Collaborations & Alliances
11.1.9.4. Recent Developments
11.1.9.5. Financial Details
11.1.9.6. Others
11.1.10. Perrigo Company plc
11.1.10.1.Business Description
11.1.10.2.Product Portfolio
11.1.10.3.Collaborations & Alliances
11.1.10.4.Recent Developments
11.1.10.5.Financial Details
11.1.10.6.Others
11.1.11. ReAgent Chemicals Ltd.
11.1.11.1.Business Description
11.1.11.2.Product Portfolio
11.1.11.3.Collaborations & Alliances
11.1.11.4.Recent Developments
11.1.11.5.Financial Details
11.1.11.6.Others
11.1.12. Royal Dutch Shell plc
11.1.12.1.Business Description
11.1.12.2.Product Portfolio
11.1.12.3.Collaborations & Alliances
11.1.12.4.Recent Developments
11.1.12.5.Financial Details
11.1.12.6.Others
11.1.13. Sasol Limited
11.1.13.1.Business Description
11.1.13.2.Product Portfolio
11.1.13.3.Collaborations & Alliances
11.1.13.4.Recent Developments
11.1.13.5.Financial Details
11.1.13.6.Others
11.1.14. Tokuyama Corporation
11.1.14.1.Business Description
11.1.14.2.Product Portfolio
11.1.14.3.Collaborations & Alliances
11.1.14.4.Recent Developments
11.1.14.5.Financial Details
11.1.14.6.Others
11.1.15. Avantor
11.1.15.1.Business Description
11.1.15.2.Product Portfolio
11.1.15.3.Collaborations & Alliances
11.1.15.4.Recent Developments
11.1.15.5.Financial Details
11.1.15.6.Others
12. Disclaimer
| Segment | Sub-Segment |
|---|---|
| By Grade |
|
| By Application |
|
| By End-Use Industry |
|
| By Region |
|
Research Methodology
This study followed a structured approach comprising four key phases to assess the size and scope of the electro-oxidation market. The process began with thorough secondary research to collect data on the target market, related markets, and broader industry context. These findings, along with preliminary assumptions and estimates, were then validated through extensive primary research involving industry experts from across the value chain. To calculate the overall market size, both top-down and bottom-up methodologies were employed. Finally, market segmentation and data triangulation techniques were applied to refine and validate segment-level estimations.
Secondary Research
The secondary research phase involved gathering data from a wide range of credible and published sources. This step helped in identifying industry trends, defining market segmentation, and understanding the market landscape and value chain.
Sources consulted during this phase included:
- Company annual reports, investor presentations, and press releases
- Industry white papers and certified publications
- Trade directories and market-recognized databases
- Articles from authoritative authors and reputable journals
- Gold and silver standard websites
Secondary research was critical in mapping out the industry's value chain and monetary flow, identifying key market segments, understanding regional variations, and tracking significant industry developments.
Other key sources:
- Financial disclosures
- Industry associations and trade bodies
- News outlets and business magazines
- Academic journals and research studies
- Paid industry databases
Primary Research
To validate secondary data and gain deeper market insights, primary research was conducted with key stakeholders across both the supply and demand sides of the market.
On the demand side, participants included decision-makers and influencers from end-user industries—such as CIOs, CTOs, and CSOs—who provided first-hand perspectives on market needs, product usage, and future expectations.
On the supply side, interviews were conducted with manufacturers, industry associations, and institutional participants to gather insights into current offerings, product pipelines, and market challenges.
Primary interviews provided critical inputs such as:
- Market size and revenue data
- Product and service breakdowns
- Market forecasts
- Regional and application-specific trends
Stakeholders consulted included:
- Leading OEM and solution providers
- Channel and distribution partners
- End users across various applications
- Independent consultants and industry specialists
Market Size Estimation and Data Triangulation
- Identifying Key Market Participants (Secondary Research)
- Goal: To identify the major players or companies in the target market. This typically involves using publicly available data sources such as industry reports, market research publications, and financial statements of companies.
- Tools: Reports from firms like Gartner, Forrester, Euromonitor, Statista, IBISWorld, and others. Public financial statements, news articles, and press releases from top market players.
- Extracting Earnings of Key Market Participants
- Goal: To estimate the earnings generated from the product or service being analyzed. This step helps in understanding the revenue potential of each market player in a specific geography.
- Methods: Earnings data can be gathered from:
- Publicly available financial reports (for listed companies).
- Interviews and primary data sources from professionals, such as Directors, VPs, SVPs, etc. This is especially useful for understanding more nuanced, internal data that isn't publicly disclosed.
- Annual reports and investor presentations of key players.
- Data Collation and Development of a Relevant Data Model
- Goal: To collate inputs from both primary and secondary sources into a structured, data-driven model for market estimation. This model will incorporate key market KPIs and any independent variables relevant to the market.
- Key KPIs: These could include:
- Market size, growth rate, and demand drivers.
- Industry-specific metrics like market share, average revenue per customer (ARPC), or average deal size.
- External variables, such as economic growth rates, inflation rates, or commodity prices, that could affect the market.
- Data Modeling: Based on this data, the market forecasts are developed for the next 5 years. A combination of trend analysis, scenario modeling, and statistical regression might be used to generate projections.
- Scenario Analysis
- Goal: To test different assumptions and validate how sensitive the market is to changes in key variables (e.g., market demand, regulatory changes, technological disruptions).
- Types of Scenarios:
- Base Case: Based on current assumptions and historical data.
- Best-Case Scenario: Assuming favorable market conditions, regulatory environments, and technological advancements.
- Worst-Case Scenario: Accounting for adverse factors, such as economic downturns, stricter regulations, or unexpected disruptions.


