Global Citric Acid Market Report: Trends, Growth and Forecast (2026-2032)
Grade (Anhydrous, Monohydrate), Application (Food & Beverage, Pharmaceuticals, Cosmetics), Region (North America, South America, Europe, Asia Pacific) ... Read more
|
Major Players
|
Global Citric Acid Market Statistics and Insights, 2026
- Market Size Statistics
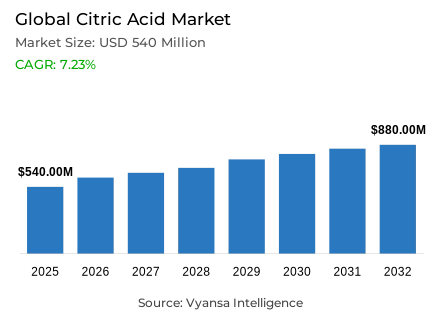
- Global citric acid market is estimated at USD 540 million in 2025.
- The market size is expected to grow to USD 880 million by 2032.
- Market to register a CAGR of around 7.23% during 2026-32.
- Grade Shares
- Anhydrous grabbed market share of 70%.
- Competition
- More than 30 companies are actively engaged in producing citric acid.
- Top 5 companies acquired around 60% of the market share.
- Tate & Lyle PLC; CJ CheilJedang; Anhui BBCA Biochemical Co.; Cargill; Archer Daniels Midland etc., are few of the top companies.
- Application
- Food & beverage grabbed 65% of the market.
- Region
- Asia Pacific leads with a 40% share of the global market.
Global Citric Acid Market Outlook
The Global Citric Acid Market was valued at approximately USD 540 million in 2025, with projections for nearly USD 880 million by 2032, demonstrating a CAGR of about 7.23% from 2026 to 2032. Strong growth within the global citric acid market is attributed to the growing use of citric acid in both food and beverage formulations. Citric acid remains an essential ingredient for acidulation, preservation, and pH stability. The segment's dominance is further bolstered by the presence of over 2 million tons of citric acid produced annually and by the increasing preference for "clean-label" products by consumers and the acceptance of citric acid by the major regulatory authorities. The pharmaceutical grade of citric acid which has aided in strengthening the upward momentum of this market segment due to its buffering and chelating properties.
However, citric acid's market segment continues to face constraints that stem from volatility in the production of corn-based dextrose and molasses. The rapid fluctuations in the climate and the market for these commodities create price instability. Regional pricing gaps exist due to supply chain difficulties such as freight costs, port congestion, and geopolitical tensions. In addition, the continued presence of oversupply of citric acid in China and the presence of disparate patterns of global demand have placed downward pressure on profitability for small-scale producers of citric acid. Consequently, these small-scale producers require more resilient sourcing methods and long-term planning for risk avoidance.
Emerging applications for citric acid include its use for biodegradable polymer manufacturing, bioplastics, and for biomedical materials. Citric acid enhances bioplastic performance and supports the development of low-impact materials and aligns with global sustainability initiatives. The development of engineered microorganisms that can manufacture citric acid from CO₂ has also opened opportunities to utilize greener processes for citric acid production. With a 40% share of the global citric acid market, Asia Pacific is in the middle of this growth opportunity, as China produces the most citric acid, and India and Southeast Asia are early adopters of green chemistry technologies.
In terms of grade, anhydrous citric acid dominates this market segment, with about 70% of the market share belonging to anhydrous citric acid, due to its compatibility and stability with high-volume processing. Food and Beverage is the leading end user of citric acid, making up about 65% of the global demand for citric acid, with expanding uses in beverages, dairy products, and functional drinks. Given this sizeable market, as well as the expanding variety of end-user applications, the market for citric acid is expected to continue to grow significantly throughout the 2026-2032 period.

Global Citric Acid Market Growth Driver
Strengthening Demand from Food & Beverage Applications
The sustained growth of the citric acid market will continue to be driven by an increase in the use of citric acid in the formulation of food and beverage products due to its ability to act as a pH stabiliser, preserve the product, and acidify the product. The global production of citric acid is estimated to be over 2 million metric tons per year, with the predominant use being in food and beverage products, illustrating that citric acid has become an important ingredient in many types of soft drinks and juice products, as well as many types of flavored beverages and dairy products. End users are becoming more aware of the benefits associated with using natural preservation methods, and citric acid has become part of clean label initiatives that focus on reducing the amount of synthetic additives used while maintaining the flavour and safety of the product. Furthermore, increasing acceptance of citric acid from regulatory authorities throughout the world will support citric acid's role in product innovation.
Pharmaceutical applications provide another source of stability for citric acid. Citric acid's chelating and buffering properties provide manufacturers with opportunities to create products using fewer additives, which will provide additional opportunities for citric acid applications across different processed categories. Due to the rising popularity of functional beverages and minimally processed products, it is projected that there will continue to be demand for citric acid's natural acidulation properties, which will continue to reinforce citric acid's role as a core ingredient in the development of global product formulation strategies.
Global Citric Acid Market Challenge
Supply-Side Pressures from Raw Material and Logistics Volatility
Country-to-country logistical supply chain disruptions due to climatic influences of agricult-ural feedstocks and fluctuations in crop yield and macro-commodity trends are responsible for the impact of supply chain disruptions on the pricing of raw material inputs. The production costs associated with these raw materials are significant drivers of variation in pricing for citric acid and other products throughout major regions. Recent volatility in pricing for citric acid in the United States can be attributed to significant changes in transportation disruptions and varying availability of raw materials through major logistical corridors. For large manufacturers of citric acid, these influences will increase cost unpredictability and limit strategic flexibility in managing and planning for production capacity.
Disruptions to global supply chains, arising from the effects of COVID-19 (such as a slowing global economy), geopolitical tensions and higher shipping costs, are resulting in large price variances between regions. An oversupply of products, especially from China, coupled with sporadic drops in demand, are placing downward pressure on export prices and making it difficult for low-volume or higher-cost exporters to be profitable. The cumulative impact of these vulnerabilities suggests that, as suppliers adapt to the volatility of global business conditions over the 2026-2022 periods, it will be increasingly vital for them to have developed resilient sourcing strategies, as well as risk mitigation strategies.
Unlock Market Intelligence
Explore the market potential with our data-driven report
Global Citric Acid Market Trend
Expanding Applications in Biodegradable and Advanced Material Technologies
Sustainable material use is accelerating the use of citric acid as a key ingredient in biodegradable polymers, bioplastics, and eco-friendly superabsorbents. Citric acid’s ability to form cross-links results in stronger structural properties in starch-based bioplastics and thermoplastic blends and makes citric acid an ideal ingredient for creating completely compostable alternatives to traditional petroleum-based plastics. The strengthened properties of these biodegradable materials support the regulatory initiatives in Asia, Europe, and North America to reduce plastic waste.
Citric acid is increasingly being adopted outside of packaging, especially in the biomedical and pharmaceutical sectors, where it is being used in scaffolds for tissue engineering, co-crystals for pharmaceuticals, and bio-compatible formulation systems. Citric acid’s growing importance in advanced materials science provides an potential to broaden its existing food-related market base. Manufacturers are increasing their attention on providing low-impact, circular-economy-compliant products; therefore, their continued inclusion of citric acid in the development of future polymers and specialty materials will increase significantly during the forecasted period.
Global Citric Acid Market Opportunity
Advancements in Sustainable and Low-Carbon Production Pathways
The growing potential for increased investments by manufacturers in more efficient fermentation processes and renewable feedstocks to boost the sustainability of their output creates significant opportunities for producers.Traditional fermentation processes that involve the use of microorganisms such as Aspergillus niger and others have created approximately 2 million tons of citric acid annually, however, the increase in automated production, optimisation through machine learning technology and monitoring of performance in real time has transitioned production to enhance yields, energy efficiency and maintenance of operation reliability. The implementation of these technological advancements has made it possible to lower production costs while also improving compliance with increasingly stringent environmental regulations worldwide.
Engineered Cyanobacteria that are capable of converting CO₂ into citric acid directly are leading to innovation in the development of low-emission, circular production models. The Asia Pacific region is at the forefront of adopting these innovative technologies at scale due to the nearly 70% production share that China controls and continuous innovation that is occurring in India and Southeast Asia. Many government and institutional policies now create more favourable conditions for suppliers that can provide quantifiable evidence of their sustainable accomplishments, resulting in a competitive edge for technologically advanced manufacturers in global procurement networks.
Global Citric Acid Market Regional Analysis

By Region
- North America
- South America
- Europe
- Asia Pacific
With around 40% of the global total market, Asia Pacific is still the leading region of production of citric acid and will continue to be a leader in the future with its large amounts of production capacity, competitive pricing from low feedstock cost locations, and strong consumer growth within its food and beverage and pharmaceutical markets. China produces almost 70% of the world's citric acid and is further solidifying its market position through its ability to operate at scale and its pricing competitiveness on the global market where it is likely to ship over 300,000 tonnes of product in Q1 of 2024.The expanding beverage and pharmaceutical markets of India continue to drive the South Asian region's growth and provide greater demand for imported goods from South Asia.
Meanwhile, Japan and South Korea's significant levels of consumption are a result of both the sophisticated capabilities of their food-processing industries and the economies of their advanced pharmaceutical manufacturing systems. The growth of these two markets also enhances the growth of packaged food and the FMCG sectors in Southeast Asia. As a result, these structural strengths allow the Asia-Pacific region to influence global pricing and supply dynamics and create intense competition for producers in Europe and North America. At the same time, they allow the Asia-Pacific region to continue to be the leading hub for production and consumption throughout the 2026-2032 period.
Unlock Market Intelligence
Explore the market potential with our data-driven report
Global Citric Acid Market Segmentation Analysis
By Grade
- Anhydrous
- Monohydrate
Anhydrous citric acid is the predominant form of citric acid consumed in the global market, comprising around 70% of the total market share under the grade segment, primarily attributable to its greater stability, longer shelf-life, and ability to provide very precise quantities for dosing in industrial applications. Beverage producers, pharmaceutical producers and detergent formulators can leverage powdered forms of anhydrous citric acid to provide relatively consistent concentrations through the multiple-high-volume production capacity at their operations. The combination of the widespread use of anhydrous citric acid in China and India, where there is an emphasis on modern processing techniques and cross-sector manufacturing efficiencies, is indicative of the strength of ongoing demand for anhydrous citric acid.
Other forms of citric acid are produced in liquid and monohydrate forms for particularised applications such as cosmetics, concentrated beverage bases, and industrial applications where fluids are easier to handle. Despite their role in niche markets, global standardisation of processing techniques continues to play a critical role in sustaining long-term growth for the anhydrous form of citric acid.While its versatility, stability and suitability for automated production processes are integral to making it the most commercially viable of all types of citric acid across both established and emerging demand sectors.

By Application
- Food & Beverage
- Pharmaceuticals
- Cosmetics
The food & beverage industry represents roughly 65% of all global citric acid demand, which continues to grow rapidly, due in large part to the numerous applications of citric acid within the Food and Beverage Industry such as carbonated soft drinks, pure juice beverages, liquid dairy and alcohol beverage formulations. Through the multiple abilities of citric acid to help maintain acidity, improve flavoring, provide microbial stability, and extend shelf-life performance for many food products, the demand for the natural acidifier will continue as functional beverage lines, fortified hydration drinks and flavored health drinks grow and develop into compliance with changing customer requirements for clean label products.
In addition to food-related products, the use of citric acid in detergent formulations and household cleaners, which together deliver 15-20% of total demand for citric acid, expands the product's market further due to its ability to serve as a descaler and chelator for these types of products. The remaining 10-12% represents demand from the pharmaceutical industry for products made with citric acid due to its compatibility with products of this type and ability to enhance stability and buffering capacity. While Food & Beverage will remain as the primary source of demand, an expanding array of uses for industrial and residential products indicates a trend toward the increased use of citric acid in non-traditional consumption methods.
Market Players in Global Citric Acid Market
These market players maintain a significant presence in the Global citric acid market sector and contribute to its ongoing evolution.
- Tate & Lyle PLC
- CJ CheilJedang
- Anhui BBCA Biochemical Co.
- Cargill
- Archer Daniels Midland
- Jungbunzlauer Suisse AG
- Weifang Ensign Industry Co. Ltd.
- COFCO Biochemical
- Qingdao Industrial Biotech
- Layn Natural Ingredients
- Prinova Group LLC
- Zhengzhou Yuanxing Chemical Co.Ltd.
- Nanning Dongda Biochemical Engineering Co.Ltd.
- Jungbunzlauer AG
- Weifang Ensign Industry Co. Ltd.
Market News & Updates
- Jungbunzlauer Suisse AG, 2025:
Jungbunzlauer Suisse AG initiated construction of a new state-of-the-art citric acid production facility in Lower Austria along the Danube River, leveraging competencies and resources from its existing Pernhofen plant. The greenfield plant will employ advanced fermentation technology using non-genetically modified microorganisms with corn as the carbohydrate feedstock, enabling minimal waste streams and highly efficient energy consumption while reducing climate gas emissions. The project is designed to support an expanded bio-based product portfolio for food & beverage, detergents, and industrial applications, aligning with growing consumer demand for biodegradable and sustainably sourced ingredients. The facility’s operational timeline targets completion within several years, positioning the company to strengthen its leadership in sustainable citric acid production and meet increasing global demand for environmentally responsible products.
- Cargill, 2025:
Cargill reinforced its leading position in the global citric acid market through strategic bio-based production partnerships and expansion into premium clean-label segments. In France, the company achieved a 25% increase in organic citric acid revenue in 2023 by collaborating with organic food brands, demonstrating strong growth potential in the health-conscious consumer segment. Cargill offers both liquid and anhydrous citric acid formulations tailored for food & beverage, pharmaceutical, and personal care applications, focusing on sustainable sourcing of molasses and renewable feedstocks. These initiatives reflect the company’s strategy to provide high-quality, environmentally responsible products while expanding its market share in organic and bio-based citric acid offerings globally, ensuring alignment with sustainability trends and regulatory preferences in key regions.
Frequently Asked Questions
Related Report
1. Market Segmentation
1.1. Research Scope
1.2. Research Methodology
1.3. Definitions and Assumptions
2. Executive Summary
3. Global Citric Acid Market Policies, Regulations, and Standards
4. Global Citric Acid Market Dynamics
4.1. Growth Factors
4.2. Challenges
4.3. Trends
4.4. Opportunities
5. Global Citric Acid Market Statistics, 2022-2032F
5.1. Market Size & Growth Outlook
5.1.1.By Revenues in USD Million
5.2. Market Segmentation & Growth Outlook
5.2.1.By Grade
5.2.1.1. Anhydrous- Market Insights and Forecast 2022-2032, USD Million
5.2.1.2. Monohydrate- Market Insights and Forecast 2022-2032, USD Million
5.2.2.By Application
5.2.2.1. Food & Beverage- Market Insights and Forecast 2022-2032, USD Million
5.2.2.2. Pharmaceuticals- Market Insights and Forecast 2022-2032, USD Million
5.2.2.3. Cosmetics- Market Insights and Forecast 2022-2032, USD Million
5.2.3.By Region
5.2.3.1. North America
5.2.3.2. South America
5.2.3.3. Europe
5.2.3.4. Asia Pacific
5.2.4.By Competitors
5.2.4.1. Competition Characteristics
5.2.4.2. Market Share & Analysis
6. North America Citric Acid Market Statistics, 2022-2032F
6.1. Market Size & Growth Outlook
6.1.1.By Revenues in USD Million
6.2. Market Segmentation & Growth Outlook
6.2.1.By Grade- Market Insights and Forecast 2022-2032, USD Million
6.2.2.By Application- Market Insights and Forecast 2022-2032, USD Million
6.2.3.By Country
6.2.3.1. US
6.2.3.2. Canada
6.2.3.3. Mexico
6.2.3.4. Rest of North America
6.3. US Citric Acid Market Statistics, 2022-2032F
6.3.1.Market Size & Growth Outlook
6.3.1.1. By Revenues in USD Million
6.3.2.Market Segmentation & Growth Outlook
6.3.2.1. By Grade- Market Insights and Forecast 2022-2032, USD Million
6.3.2.2. By Application- Market Insights and Forecast 2022-2032, USD Million
6.4. Canada Citric Acid Market Statistics, 2022-2032F
6.4.1.Market Size & Growth Outlook
6.4.1.1. By Revenues in USD Million
6.4.2.Market Segmentation & Growth Outlook
6.4.2.1. By Grade- Market Insights and Forecast 2022-2032, USD Million
6.4.2.2. By Application- Market Insights and Forecast 2022-2032, USD Million
6.5. Mexico Citric Acid Market Statistics, 2022-2032F
6.5.1.Market Size & Growth Outlook
6.5.1.1. By Revenues in USD Million
6.5.2.Market Segmentation & Growth Outlook
6.5.2.1. By Grade- Market Insights and Forecast 2022-2032, USD Million
6.5.2.2. By Application- Market Insights and Forecast 2022-2032, USD Million
7. South America Citric Acid Market Statistics, 2022-2032F
7.1. Market Size & Growth Outlook
7.1.1.By Revenues in USD Million
7.2. Market Segmentation & Growth Outlook
7.2.1.By Grade- Market Insights and Forecast 2022-2032, USD Million
7.2.2.By Application- Market Insights and Forecast 2022-2032, USD Million
7.2.3.By Country
7.2.3.1. Brazil
7.2.3.2. Rest of South America
7.3. Brazil Citric Acid Market Statistics, 2022-2032F
7.3.1.Market Size & Growth Outlook
7.3.1.1. By Revenues in USD Million
7.3.2.Market Segmentation & Growth Outlook
7.3.2.1. By Grade- Market Insights and Forecast 2022-2032, USD Million
7.3.2.2. By Application- Market Insights and Forecast 2022-2032, USD Million
8. Europe Citric Acid Market Statistics, 2022-2032F
8.1. Market Size & Growth Outlook
8.1.1.By Revenues in USD Million
8.2. Market Segmentation & Growth Outlook
8.2.1.By Grade- Market Insights and Forecast 2022-2032, USD Million
8.2.2.By Application- Market Insights and Forecast 2022-2032, USD Million
8.2.3.By Country
8.2.3.1. Germany
8.2.3.2. France
8.2.3.3. UK
8.2.3.4. Italy
8.2.3.5. Spain
8.2.3.6. Netherlands
8.2.3.7. Belgium
8.2.3.8. Russia
8.2.3.9. Poland
8.2.3.10. Turkey
8.2.3.11. Rest of Europe
8.3. Germany Citric Acid Market Statistics, 2022-2032F
8.3.1.Market Size & Growth Outlook
8.3.1.1. By Revenues in USD Million
8.3.2.Market Segmentation & Growth Outlook
8.3.2.1. By Grade- Market Insights and Forecast 2022-2032, USD Million
8.3.2.2. By Application- Market Insights and Forecast 2022-2032, USD Million
8.4. France Citric Acid Market Statistics, 2022-2032F
8.4.1.Market Size & Growth Outlook
8.4.1.1. By Revenues in USD Million
8.4.2.Market Segmentation & Growth Outlook
8.4.2.1. By Grade- Market Insights and Forecast 2022-2032, USD Million
8.4.2.2. By Application- Market Insights and Forecast 2022-2032, USD Million
8.5. UK Citric Acid Market Statistics, 2022-2032F
8.5.1.Market Size & Growth Outlook
8.5.1.1. By Revenues in USD Million
8.5.2.Market Segmentation & Growth Outlook
8.5.2.1. By Grade- Market Insights and Forecast 2022-2032, USD Million
8.5.2.2. By Application- Market Insights and Forecast 2022-2032, USD Million
8.6. Italy Citric Acid Market Statistics, 2022-2032F
8.6.1.Market Size & Growth Outlook
8.6.1.1. By Revenues in USD Million
8.6.2.Market Segmentation & Growth Outlook
8.6.2.1. By Grade- Market Insights and Forecast 2022-2032, USD Million
8.6.2.2. By Application- Market Insights and Forecast 2022-2032, USD Million
8.7. Spain Citric Acid Market Statistics, 2022-2032F
8.7.1.Market Size & Growth Outlook
8.7.1.1. By Revenues in USD Million
8.7.2.Market Segmentation & Growth Outlook
8.7.2.1. By Grade- Market Insights and Forecast 2022-2032, USD Million
8.7.2.2. By Application- Market Insights and Forecast 2022-2032, USD Million
8.8. Netherlands Citric Acid Market Statistics, 2022-2032F
8.8.1.Market Size & Growth Outlook
8.8.1.1. By Revenues in USD Million
8.8.2.Market Segmentation & Growth Outlook
8.8.2.1. By Grade- Market Insights and Forecast 2022-2032, USD Million
8.8.2.2. By Application- Market Insights and Forecast 2022-2032, USD Million
8.9. Belgium Citric Acid Market Statistics, 2022-2032F
8.9.1.Market Size & Growth Outlook
8.9.1.1. By Revenues in USD Million
8.9.2.Market Segmentation & Growth Outlook
8.9.2.1. By Grade- Market Insights and Forecast 2022-2032, USD Million
8.9.2.2. By Application- Market Insights and Forecast 2022-2032, USD Million
8.10. Russia Citric Acid Market Statistics, 2022-2032F
8.10.1. Market Size & Growth Outlook
8.10.1.1. By Revenues in USD Million
8.10.2. Market Segmentation & Growth Outlook
8.10.2.1. By Grade- Market Insights and Forecast 2022-2032, USD Million
8.10.2.2. By Application- Market Insights and Forecast 2022-2032, USD Million
8.11. Poland Citric Acid Market Statistics, 2022-2032F
8.11.1. Market Size & Growth Outlook
8.11.1.1. By Revenues in USD Million
8.11.2. Market Segmentation & Growth Outlook
8.11.2.1. By Grade- Market Insights and Forecast 2022-2032, USD Million
8.11.2.2. By Application- Market Insights and Forecast 2022-2032, USD Million
8.12. Turkey Citric Acid Market Statistics, 2022-2032F
8.12.1. Market Size & Growth Outlook
8.12.1.1. By Revenues in USD Million
8.12.2. Market Segmentation & Growth Outlook
8.12.2.1. By Grade- Market Insights and Forecast 2022-2032, USD Million
8.12.2.2. By Application- Market Insights and Forecast 2022-2032, USD Million
9. Asia Pacific Citric Acid Market Statistics, 2022-2032F
9.1. Market Size & Growth Outlook
9.1.1.By Revenues in USD Million
9.2. Market Segmentation & Growth Outlook
9.2.1.By Grade- Market Insights and Forecast 2022-2032, USD Million
9.2.2.By Application- Market Insights and Forecast 2022-2032, USD Million
9.2.3.By Country
9.2.3.1. China
9.2.3.2. India
9.2.3.3. Japan
9.2.3.4. South Korea
9.2.3.5. Australia
9.2.3.6. Thailand
9.2.3.7. Rest of Asia Pacific
9.3. China Citric Acid Market Statistics, 2022-2032F
9.3.1.Market Size & Growth Outlook
9.3.1.1. By Revenues in USD Million
9.3.2.Market Segmentation & Growth Outlook
9.3.2.1. By Grade- Market Insights and Forecast 2022-2032, USD Million
9.3.2.2. By Application- Market Insights and Forecast 2022-2032, USD Million
9.4. India Citric Acid Market Statistics, 2022-2032F
9.4.1.Market Size & Growth Outlook
9.4.1.1. By Revenues in USD Million
9.4.2.Market Segmentation & Growth Outlook
9.4.2.1. By Grade- Market Insights and Forecast 2022-2032, USD Million
9.4.2.2. By Application- Market Insights and Forecast 2022-2032, USD Million
9.5. Japan Citric Acid Market Statistics, 2022-2032F
9.5.1.Market Size & Growth Outlook
9.5.1.1. By Revenues in USD Million
9.5.2.Market Segmentation & Growth Outlook
9.5.2.1. By Grade- Market Insights and Forecast 2022-2032, USD Million
9.5.2.2. By Application- Market Insights and Forecast 2022-2032, USD Million
9.6. South Korea Citric Acid Market Statistics, 2022-2032F
9.6.1.Market Size & Growth Outlook
9.6.1.1. By Revenues in USD Million
9.6.2.Market Segmentation & Growth Outlook
9.6.2.1. By Grade- Market Insights and Forecast 2022-2032, USD Million
9.6.2.2. By Application- Market Insights and Forecast 2022-2032, USD Million
9.7. Australia Citric Acid Market Statistics, 2022-2032F
9.7.1.Market Size & Growth Outlook
9.7.1.1. By Revenues in USD Million
9.7.2.Market Segmentation & Growth Outlook
9.7.2.1. By Grade- Market Insights and Forecast 2022-2032, USD Million
9.7.2.2. By Application- Market Insights and Forecast 2022-2032, USD Million
9.8. Thailand Citric Acid Market Statistics, 2022-2032F
9.8.1.Market Size & Growth Outlook
9.8.1.1. By Revenues in USD Million
9.8.2.Market Segmentation & Growth Outlook
9.8.2.1. By Grade- Market Insights and Forecast 2022-2032, USD Million
9.8.2.2. By Application- Market Insights and Forecast 2022-2032, USD Million
10. Competitive Outlook
10.1. Company Profiles
10.1.1. Cargill
10.1.1.1. Business Description
10.1.1.2. Product Portfolio
10.1.1.3. Collaborations & Alliances
10.1.1.4. Recent Developments
10.1.1.5. Financial Details
10.1.1.6. Others
10.1.2. Archer Daniels Midland
10.1.2.1. Business Description
10.1.2.2. Product Portfolio
10.1.2.3. Collaborations & Alliances
10.1.2.4. Recent Developments
10.1.2.5. Financial Details
10.1.2.6. Others
10.1.3. Jungbunzlauer Suisse AG
10.1.3.1. Business Description
10.1.3.2. Product Portfolio
10.1.3.3. Collaborations & Alliances
10.1.3.4. Recent Developments
10.1.3.5. Financial Details
10.1.3.6. Others
10.1.4. Weifang Ensign Industry Co. Ltd.
10.1.4.1. Business Description
10.1.4.2. Product Portfolio
10.1.4.3. Collaborations & Alliances
10.1.4.4. Recent Developments
10.1.4.5. Financial Details
10.1.4.6. Others
10.1.5. COFCO Biochemical
10.1.5.1. Business Description
10.1.5.2. Product Portfolio
10.1.5.3. Collaborations & Alliances
10.1.5.4. Recent Developments
10.1.5.5. Financial Details
10.1.5.6. Others
10.1.6. Tate & Lyle PLC
10.1.6.1. Business Description
10.1.6.2. Product Portfolio
10.1.6.3. Collaborations & Alliances
10.1.6.4. Recent Developments
10.1.6.5. Financial Details
10.1.6.6. Others
10.1.7. CJ CheilJedang
10.1.7.1. Business Description
10.1.7.2. Product Portfolio
10.1.7.3. Collaborations & Alliances
10.1.7.4. Recent Developments
10.1.7.5. Financial Details
10.1.7.6. Others
10.1.8. Anhui BBCA Biochemical Co.
10.1.8.1. Business Description
10.1.8.2. Product Portfolio
10.1.8.3. Collaborations & Alliances
10.1.8.4. Recent Developments
10.1.8.5. Financial Details
10.1.8.6. Others
10.1.9. Qingdao Industrial Biotech
10.1.9.1. Business Description
10.1.9.2. Product Portfolio
10.1.9.3. Collaborations & Alliances
10.1.9.4. Recent Developments
10.1.9.5. Financial Details
10.1.9.6. Others
10.1.10. Layn Natural Ingredients
10.1.10.1.Business Description
10.1.10.2.Product Portfolio
10.1.10.3.Collaborations & Alliances
10.1.10.4.Recent Developments
10.1.10.5.Financial Details
10.1.10.6.Others
10.1.11. Prinova Group LLC
10.1.11.1.Business Description
10.1.11.2.Product Portfolio
10.1.11.3.Collaborations & Alliances
10.1.11.4.Recent Developments
10.1.11.5.Financial Details
10.1.11.6.Others
10.1.12. Zhengzhou Yuanxing Chemical Co.Ltd.
10.1.12.1.Business Description
10.1.12.2.Product Portfolio
10.1.12.3.Collaborations & Alliances
10.1.12.4.Recent Developments
10.1.12.5.Financial Details
10.1.12.6.Others
10.1.13. Nanning Dongda Biochemical Engineering Co.Ltd.
10.1.13.1.Business Description
10.1.13.2.Product Portfolio
10.1.13.3.Collaborations & Alliances
10.1.13.4.Recent Developments
10.1.13.5.Financial Details
10.1.13.6.Others
10.1.14. Jungbunzlauer AG
10.1.14.1.Business Description
10.1.14.2.Product Portfolio
10.1.14.3.Collaborations & Alliances
10.1.14.4.Recent Developments
10.1.14.5.Financial Details
10.1.14.6.Others
10.1.15. Weifang Ensign Industry Co. Ltd.
10.1.15.1.Business Description
10.1.15.2.Product Portfolio
10.1.15.3.Collaborations & Alliances
10.1.15.4.Recent Developments
10.1.15.5.Financial Details
10.1.15.6.Others
11. Disclaimer
| Segment | Sub-Segment |
|---|---|
| By Grade |
|
| By Application |
|
| By Region |
|
Research Methodology
This study followed a structured approach comprising four key phases to assess the size and scope of the electro-oxidation market. The process began with thorough secondary research to collect data on the target market, related markets, and broader industry context. These findings, along with preliminary assumptions and estimates, were then validated through extensive primary research involving industry experts from across the value chain. To calculate the overall market size, both top-down and bottom-up methodologies were employed. Finally, market segmentation and data triangulation techniques were applied to refine and validate segment-level estimations.
Secondary Research
The secondary research phase involved gathering data from a wide range of credible and published sources. This step helped in identifying industry trends, defining market segmentation, and understanding the market landscape and value chain.
Sources consulted during this phase included:
- Company annual reports, investor presentations, and press releases
- Industry white papers and certified publications
- Trade directories and market-recognized databases
- Articles from authoritative authors and reputable journals
- Gold and silver standard websites
Secondary research was critical in mapping out the industry's value chain and monetary flow, identifying key market segments, understanding regional variations, and tracking significant industry developments.
Other key sources:
- Financial disclosures
- Industry associations and trade bodies
- News outlets and business magazines
- Academic journals and research studies
- Paid industry databases
Primary Research
To validate secondary data and gain deeper market insights, primary research was conducted with key stakeholders across both the supply and demand sides of the market.
On the demand side, participants included decision-makers and influencers from end-user industries—such as CIOs, CTOs, and CSOs—who provided first-hand perspectives on market needs, product usage, and future expectations.
On the supply side, interviews were conducted with manufacturers, industry associations, and institutional participants to gather insights into current offerings, product pipelines, and market challenges.
Primary interviews provided critical inputs such as:
- Market size and revenue data
- Product and service breakdowns
- Market forecasts
- Regional and application-specific trends
Stakeholders consulted included:
- Leading OEM and solution providers
- Channel and distribution partners
- End users across various applications
- Independent consultants and industry specialists
Market Size Estimation and Data Triangulation
- Identifying Key Market Participants (Secondary Research)
- Goal: To identify the major players or companies in the target market. This typically involves using publicly available data sources such as industry reports, market research publications, and financial statements of companies.
- Tools: Reports from firms like Gartner, Forrester, Euromonitor, Statista, IBISWorld, and others. Public financial statements, news articles, and press releases from top market players.
- Extracting Earnings of Key Market Participants
- Goal: To estimate the earnings generated from the product or service being analyzed. This step helps in understanding the revenue potential of each market player in a specific geography.
- Methods: Earnings data can be gathered from:
- Publicly available financial reports (for listed companies).
- Interviews and primary data sources from professionals, such as Directors, VPs, SVPs, etc. This is especially useful for understanding more nuanced, internal data that isn't publicly disclosed.
- Annual reports and investor presentations of key players.
- Data Collation and Development of a Relevant Data Model
- Goal: To collate inputs from both primary and secondary sources into a structured, data-driven model for market estimation. This model will incorporate key market KPIs and any independent variables relevant to the market.
- Key KPIs: These could include:
- Market size, growth rate, and demand drivers.
- Industry-specific metrics like market share, average revenue per customer (ARPC), or average deal size.
- External variables, such as economic growth rates, inflation rates, or commodity prices, that could affect the market.
- Data Modeling: Based on this data, the market forecasts are developed for the next 5 years. A combination of trend analysis, scenario modeling, and statistical regression might be used to generate projections.
- Scenario Analysis
- Goal: To test different assumptions and validate how sensitive the market is to changes in key variables (e.g., market demand, regulatory changes, technological disruptions).
- Types of Scenarios:
- Base Case: Based on current assumptions and historical data.
- Best-Case Scenario: Assuming favorable market conditions, regulatory environments, and technological advancements.
- Worst-Case Scenario: Accounting for adverse factors, such as economic downturns, stricter regulations, or unexpected disruptions.


