Peru Sports Nutrition Market Report: Trends, Growth and Forecast (2026-2032)
By Product Type (Sports Protein Products (Protein/Energy Bars, Sports Protein Powder, Sports Protein RTD), Sports Non-Protein Products), By Sales Channel (Retail Offline, Retail Online), By Ingredients (Vitamins and Minerals, Proteins and Amino Acids, Carbohydrates, Probiotics, Botanicals/Herbals, Others), By Functionality (Energy, Muscle growth, Hydration, Weight Management, Others), By End User (Bodybuilders, Athletes, Lifestyle Users) ... Read more
|
Major Players
|
Peru Sports Nutrition Market Statistics and Insights, 2026
- Market Size Statistics
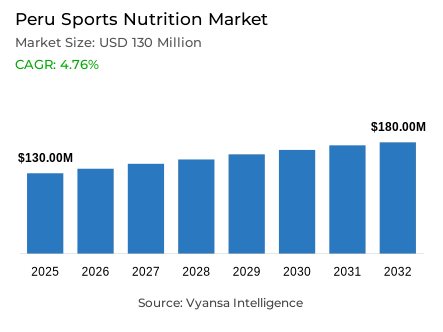
- Sports nutrition in Peru is estimated at USD 130 million in 2025.
- The market size is expected to grow to USD 180 million by 2032.
- Market to register a cagr of around 4.76% during 2026-32.
- Product Type Shares
- Sports protein products grabbed market share of 55%.
- Competition
- More than 10 companies are actively engaged in producing sports nutrition in Peru.
- Top 5 companies acquired around 65% of the market share.
- Tmx Perú SRL; Vitamins Nutri Sport SAC; Herbalife Perú SRL; Omnilife Perú SAC; Universe Nutrition SAC etc., are few of the top companies.
- Sales Channel
- Retail offline grabbed 60% of the market.
Peru Sports Nutrition Market Outlook
The Peru sports nutrition market is expected to see steady growth in the coming years due to increasing health consciousness and greater participation in fitness activities. Valued at around USD 130 million in 2025, the industry is likely to reach around USD 180 million by 2032, growing at a CAGR of around 4.76%. Increasing interest in active lifestyles and higher consumption of protein and non-protein supplements contribute to consistent market growth. Fitness communities and gyms also contribute significantly to the adoption of sports nutrition products in everyday life.
Sports protein products hold the largest share of around 55% in the overall segment. This includes protein powders, bars, and ready-to-drink options that are now a regular part of many end users’ training schedules. The rising interest in muscle recovery and performance improvement keeps this segment at the forefront. Advanced protein types such as whey, hydrolysed, and isolated variants are also attracting more attention for their effectiveness.
Retail offline channels continues to dominate the sales channel, by holding around 60% of the market share. Pharmacies, gyms, and specialized nutrition shops are favored due to the personalized consultation provided by educated staff that enables end users to make informed choices. The ability to view and compare products directly enhance trust in brands and ensuring safety during purchase.
Competition remains moderate, with more than 10 companies actively operating in the market and the top five players accounting for nearly 65% of the total share. These companies continue to expand their product portfolios and build strong in-store visibility. With increasing fitness participation and a well established distribution network, the market is well positioned for steady growth through 2032.

Peru Sports Nutrition Market Growth Driver
Growing Interest in an Active Lifestyle
As society puts more emphasis on an active lifestyle, interest in sports nutrition continues to grow. Many end users are moving toward health and regular exercise, resulting in increased consumption of protein and non-protein dietary supplements. According to The World Health Organization 43% of adults end users in Peru report insufficient physical inactivity (age-standardized estimate, 2022), indicating a strong possibilities for expansion of market with increased awareness. Younger generation end users are inspired to remain active, get fit, and inspire each other through online health content and fitness groups, while incorporating an element of protein or non-protein dietary supplements into their daily health routines.
Furthermore, strength training is now practiced by 32% of active Latin American end users, which shows a strong link between physical exercise and the use of nutritional supplements. Local stores have also expanded their offerings to make access easier to both imported and domestic products aimed at diverse fitness goals of various end users . Together, these factors support steady growth for sports nutrition across active lifestyle segments.
Peru Sports Nutrition Market Challenge
Rising Illicit Trade in Unregulated Supplements
The widespread trade of unregulated protein products remains a serious threat to genuine sports nutrition products. Many are sold through unofficial distributors without proper health and safety standards, harming both users and brand credibility. According to the data from DIGEMID, between 1997 and 2014, 52.9% of all national alerts, totaling 1,738 cases, were due to counterfeit medicines. This shows the scale of the problem within Peru wider health product sector. These cases often involve unlicensed sellers who distribute items without proper certification or ingredient control.
Moreover, about 25% of the counterfeit medicines had no active ingredient, according to the National Quality Control Center, posing a very high risk. Such unsafe and misleading products reduce public confidence and present an unfair competition for legal businesses that follow national standards. This is a lingering issue that limits end user confidence and slows down overall market development.
Unlock Market Intelligence
Explore the market potential with our data-driven report
Peru Sports Nutrition Market Trend
Growing Popularity of Creatine
Creatine is currently one of the most commonly used supplements in sports nutrition. The effect of creatine on muscle performance and strength is now so widely accepted, that even casual gym goers take creatine. In the past, this substance was used mainly by professional athletes, but it has become popular among regular gym end users who see this as another harmless way to get better training results. Nutritionists still promote it, which supports consistent trust and steady sales throughout the year.
Moreover, creatine stands out from other products because it maintains stable demand throughout the seasons, while other products tend to peak during the summer. Demand remains strong, despite increased costs of goods production, because of well known benefits and proven results. Interest in performance nutritional products is rising and is a reflection of end users shift toward products that deliver visual results.
Peru Sports Nutrition Market Opportunity
Expanding Demand for Customised Fitness Solution
Personalization of supplements is also an important factor for market growth, as end users look for supplements that meet their specific fitness objectives. According to Ipsos Latin America, 44% of active consumers prioritize improving and maintaining general health, while 40% focus on mental wellbeing. This indicates the need for effective communication and in-store guidance to understand different motivations. In-store staff can improve confidence and satisfaction by clearly explaining the supplement benefits for first time end users.
Moreover, 53% of Latin American non-gym members are likely to enroll in fitness facilities, presenting a strong chance for strategic partnerships between supplement companies and gyms. Companies can engage directly with enthusiastic end user by partnering with professional trainers and even sponsoring events. In return, this approach help build trust, improve product knowledge, and ultimately building loyalty in the evolving dynamics of the sports nutrition market.
Unlock Market Intelligence
Explore the market potential with our data-driven report
Peru Sports Nutrition Market Segmentation Analysis
By Product Type
- Sports Protein Products
- Sports Non-Protein Products
The leading segment within the sports nutrition market belongs to Sports Protein Products, holding around 55% of the total market value. This category includes protein powders, ready-to-drink products, and bars, with protein powders accounting for the highest demand. This strong position indicates that end users increasingly recognise the importance of protein in strength building, muscle recovery, and improvement of overall fitness. Most of the end users made these products a regular part of their routine, especially those actively participating in gyms or sports training.
The segment is expected to retain its leading position from 2026 to 2032, as more end users prefers protein powders to get better results in performance. Whey, hydrolyzed, and isolated proteins are the main variants that gain interest among fitness oriented end users. With rising awareness, frequent gym visits, and strong retail distribution, the sports protein products segment will continue to be the first choice for most end users during the forecast period.

By Sales Channel
- Retail Offline
- Retail Online
The segment with the highest share under the sales channel is retail offline, which accounts for around 60% of the total market value. Most end users still depend on physical stores such as pharmacies, gyms, and nutrition focused stores for supplement purchases. These outlets offer the benefit of personalized service, where staff can recommend products that best suit an individual's specific fitness requirements. This, approach helps, first time purchasers confidence and reduces misconceptions the end user might have regarding the usage of a particular supplement.
Additionally, retail offline is expected to maintain its dominance from 2026-2032, as many end users prefer to make purchases personally rather than digitally. The ability to view and compare products directly, while being able to consume them immediately, builds a strong sense of trust and satisfaction. Moreover, physical outlets help brands determine and build stronger visibility and loyalty among their end users base, ensuring this channel remains dominant even as online sales continue to grow.
List of Companies Covered in Peru Sports Nutrition Market
The companies listed below are highly influential in the Peru sports nutrition market, with a significant market share and a strong impact on industry developments.
- Tmx Perú SRL
- Vitamins Nutri Sport SAC
- Herbalife Perú SRL
- Omnilife Perú SAC
- Universe Nutrition SAC
- Lab Nutrition Corp SAC
- Sanexim SAC
- FuXion Biotech SAC
- Inversiones ITA SAC
- Mass Nutricion Peru SAC
Market News & Updates
- Universe Nutrition SAC, 2024:
Introduced a "100% MADE IN USA" product line in Peru to highlight U.S. formulated supplement quality.
- Lab Nutrition Corp SAC, 2024:
Expanded imports of premium hydrolyzed whey protein products from the U.S. into Peru.
Frequently Asked Questions
Related Report
1. Market Segmentation
1.1. Research Scope
1.2. Research Methodology
1.3. Definitions and Assumptions
2. Executive Summary
3. Peru Sports Nutrition Market Policies, Regulations, and Standards
4. Peru Sports Nutrition Market Dynamics
4.1. Growth Factors
4.2. Challenges
4.3. Trends
4.4. Opportunities
5. Peru Sports Nutrition Market Statistics, 2022-2032F
5.1. Market Size & Growth Outlook
5.1.1.By Revenues in USD Million
5.2. Market Segmentation & Growth Outlook
5.2.1.By Product Type
5.2.1.1. Sports Protein Products- Market Insights and Forecast 2022-2032, USD Million
5.2.1.1.1. Protein/Energy Bars- Market Insights and Forecast 2022-2032, USD Million
5.2.1.1.2. Sports Protein Powder- Market Insights and Forecast 2022-2032, USD Million
5.2.1.1.3. Sports Protein RTD- Market Insights and Forecast 2022-2032, USD Million
5.2.1.2. Sports Non-Protein Products- Market Insights and Forecast 2022-2032, USD Million
5.2.2.By Sales Channel
5.2.2.1. Retail Offline- Market Insights and Forecast 2022-2032, USD Million
5.2.2.2. Retail Online- Market Insights and Forecast 2022-2032, USD Million
5.2.3.By Ingredients
5.2.3.1. Vitamins and Minerals- Market Insights and Forecast 2022-2032, USD Million
5.2.3.2. Proteins and Amino Acids- Market Insights and Forecast 2022-2032, USD Million
5.2.3.3. Carbohydrates- Market Insights and Forecast 2022-2032, USD Million
5.2.3.4. Probiotics- Market Insights and Forecast 2022-2032, USD Million
5.2.3.5. Botanicals/Herbals- Market Insights and Forecast 2022-2032, USD Million
5.2.3.6. Others- Market Insights and Forecast 2022-2032, USD Million
5.2.4.By Functionality
5.2.4.1. Energy- Market Insights and Forecast 2022-2032, USD Million
5.2.4.2. Muscle growth- Market Insights and Forecast 2022-2032, USD Million
5.2.4.3. Hydration- Market Insights and Forecast 2022-2032, USD Million
5.2.4.4. Weight Management- Market Insights and Forecast 2022-2032, USD Million
5.2.4.5. Others- Market Insights and Forecast 2022-2032, USD Million
5.2.5.By End User
5.2.5.1. Bodybuilders- Market Insights and Forecast 2022-2032, USD Million
5.2.5.2. Athletes- Market Insights and Forecast 2022-2032, USD Million
5.2.5.3. Lifestyle Users- Market Insights and Forecast 2022-2032, USD Million
5.2.6.By Competitors
5.2.6.1. Competition Characteristics
5.2.6.2. Market Share & Analysis
6. Peru Protein Products Sports Nutrition Market Statistics, 2022-2032F
6.1. Market Size & Growth Outlook
6.1.1.By Revenues in USD Million
6.2. Market Segmentation & Growth Outlook
6.2.1.By Sales Channel- Market Insights and Forecast 2022-2032, USD Million
6.2.2.By Ingredients- Market Insights and Forecast 2022-2032, USD Million
6.2.3.By Functionality- Market Insights and Forecast 2022-2032, USD Million
6.2.4.By End User- Market Insights and Forecast 2022-2032, USD Million
7. Peru Non-Protein Products Sports Nutrition Market Statistics, 2022-2032F
7.1. Market Size & Growth Outlook
7.1.1.By Revenues in USD Million
7.2. Market Segmentation & Growth Outlook
7.2.1.By Sales Channel- Market Insights and Forecast 2022-2032, USD Million
7.2.2.By Ingredients- Market Insights and Forecast 2022-2032, USD Million
7.2.3.By Functionality- Market Insights and Forecast 2022-2032, USD Million
7.2.4.By End User- Market Insights and Forecast 2022-2032, USD Million
8. Competitive Outlook
8.1. Company Profiles
8.1.1.Omnilife Perú SAC
8.1.1.1. Business Description
8.1.1.2. Product Portfolio
8.1.1.3. Collaborations & Alliances
8.1.1.4. Recent Developments
8.1.1.5. Financial Details
8.1.1.6. Others
8.1.2.Universe Nutrition SAC
8.1.2.1. Business Description
8.1.2.2. Product Portfolio
8.1.2.3. Collaborations & Alliances
8.1.2.4. Recent Developments
8.1.2.5. Financial Details
8.1.2.6. Others
8.1.3.Lab Nutrition Corp SAC
8.1.3.1. Business Description
8.1.3.2. Product Portfolio
8.1.3.3. Collaborations & Alliances
8.1.3.4. Recent Developments
8.1.3.5. Financial Details
8.1.3.6. Others
8.1.4.Sanexim SAC
8.1.4.1. Business Description
8.1.4.2. Product Portfolio
8.1.4.3. Collaborations & Alliances
8.1.4.4. Recent Developments
8.1.4.5. Financial Details
8.1.4.6. Others
8.1.5.FuXion Biotech SAC
8.1.5.1. Business Description
8.1.5.2. Product Portfolio
8.1.5.3. Collaborations & Alliances
8.1.5.4. Recent Developments
8.1.5.5. Financial Details
8.1.5.6. Others
8.1.6.Tmx Perú SRL
8.1.6.1. Business Description
8.1.6.2. Product Portfolio
8.1.6.3. Collaborations & Alliances
8.1.6.4. Recent Developments
8.1.6.5. Financial Details
8.1.6.6. Others
8.1.7.Vitamins Nutri Sport SAC
8.1.7.1. Business Description
8.1.7.2. Product Portfolio
8.1.7.3. Collaborations & Alliances
8.1.7.4. Recent Developments
8.1.7.5. Financial Details
8.1.7.6. Others
8.1.8.Herbalife Perú SRL
8.1.8.1. Business Description
8.1.8.2. Product Portfolio
8.1.8.3. Collaborations & Alliances
8.1.8.4. Recent Developments
8.1.8.5. Financial Details
8.1.8.6. Others
8.1.9.Inversiones ITA SAC
8.1.9.1. Business Description
8.1.9.2. Product Portfolio
8.1.9.3. Collaborations & Alliances
8.1.9.4. Recent Developments
8.1.9.5. Financial Details
8.1.9.6. Others
8.1.10. Zeiter EIRL
8.1.10.1. Business Description
8.1.10.2. Product Portfolio
8.1.10.3. Collaborations & Alliances
8.1.10.4. Recent Developments
8.1.10.5. Financial Details
8.1.10.6. Others
9. Disclaimer
| Segment | Sub-Segment |
|---|---|
| By Product Type |
|
| By Sales Channel |
|
| By Ingredients |
|
| By Functionality |
|
| By End User |
|
Research Methodology
This study followed a structured approach comprising four key phases to assess the size and scope of the electro-oxidation market. The process began with thorough secondary research to collect data on the target market, related markets, and broader industry context. These findings, along with preliminary assumptions and estimates, were then validated through extensive primary research involving industry experts from across the value chain. To calculate the overall market size, both top-down and bottom-up methodologies were employed. Finally, market segmentation and data triangulation techniques were applied to refine and validate segment-level estimations.
Secondary Research
The secondary research phase involved gathering data from a wide range of credible and published sources. This step helped in identifying industry trends, defining market segmentation, and understanding the market landscape and value chain.
Sources consulted during this phase included:
- Company annual reports, investor presentations, and press releases
- Industry white papers and certified publications
- Trade directories and market-recognized databases
- Articles from authoritative authors and reputable journals
- Gold and silver standard websites
Secondary research was critical in mapping out the industry's value chain and monetary flow, identifying key market segments, understanding regional variations, and tracking significant industry developments.
Other key sources:
- Financial disclosures
- Industry associations and trade bodies
- News outlets and business magazines
- Academic journals and research studies
- Paid industry databases
Primary Research
To validate secondary data and gain deeper market insights, primary research was conducted with key stakeholders across both the supply and demand sides of the market.
On the demand side, participants included decision-makers and influencers from end-user industries—such as CIOs, CTOs, and CSOs—who provided first-hand perspectives on market needs, product usage, and future expectations.
On the supply side, interviews were conducted with manufacturers, industry associations, and institutional participants to gather insights into current offerings, product pipelines, and market challenges.
Primary interviews provided critical inputs such as:
- Market size and revenue data
- Product and service breakdowns
- Market forecasts
- Regional and application-specific trends
Stakeholders consulted included:
- Leading OEM and solution providers
- Channel and distribution partners
- End users across various applications
- Independent consultants and industry specialists
Market Size Estimation and Data Triangulation
- Identifying Key Market Participants (Secondary Research)
- Goal: To identify the major players or companies in the target market. This typically involves using publicly available data sources such as industry reports, market research publications, and financial statements of companies.
- Tools: Reports from firms like Gartner, Forrester, Euromonitor, Statista, IBISWorld, and others. Public financial statements, news articles, and press releases from top market players.
- Extracting Earnings of Key Market Participants
- Goal: To estimate the earnings generated from the product or service being analyzed. This step helps in understanding the revenue potential of each market player in a specific geography.
- Methods: Earnings data can be gathered from:
- Publicly available financial reports (for listed companies).
- Interviews and primary data sources from professionals, such as Directors, VPs, SVPs, etc. This is especially useful for understanding more nuanced, internal data that isn't publicly disclosed.
- Annual reports and investor presentations of key players.
- Data Collation and Development of a Relevant Data Model
- Goal: To collate inputs from both primary and secondary sources into a structured, data-driven model for market estimation. This model will incorporate key market KPIs and any independent variables relevant to the market.
- Key KPIs: These could include:
- Market size, growth rate, and demand drivers.
- Industry-specific metrics like market share, average revenue per customer (ARPC), or average deal size.
- External variables, such as economic growth rates, inflation rates, or commodity prices, that could affect the market.
- Data Modeling: Based on this data, the market forecasts are developed for the next 5 years. A combination of trend analysis, scenario modeling, and statistical regression might be used to generate projections.
- Scenario Analysis
- Goal: To test different assumptions and validate how sensitive the market is to changes in key variables (e.g., market demand, regulatory changes, technological disruptions).
- Types of Scenarios:
- Base Case: Based on current assumptions and historical data.
- Best-Case Scenario: Assuming favorable market conditions, regulatory environments, and technological advancements.
- Worst-Case Scenario: Accounting for adverse factors, such as economic downturns, stricter regulations, or unexpected disruptions.


