Netherlands Beer Market Report: Trends, Growth and Forecast (2026-2032)
Product Type (Dark Beer (Ale, Sorghum Beer, Weissbier/Weizen/Wheat Beer), Lager (Flavoured/Mixed Lager, Standard Lager (Premium Lager (Domestic Premium Lager, Imported Premium Lager), Mid-Priced Lager (Domestic Mid-Priced Lager, Imported Mid-Priced Lager), Economy Lager (Domestic Economy Lager, Imported Economy Lager))), Non/Low Alcohol Beer (Low Alcohol Beer, Non Alcoholic Beer), Stout, Others (Porter, Malt etc.)), Production (Macro Brewery, Micro Brewery, Craft Brewery), Packaging Type (Bottles, Cans, Others), Sales Channel (On-Trade, Off-Trade) ... Read more
|
Major Players
|
Netherlands Beer Market Statistics and Insights, 2026
- Market Size Statistics
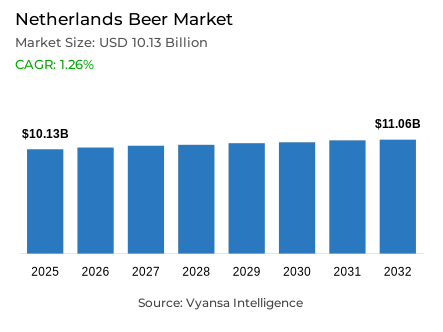
- Beer in Netherlands is estimated at USD 10.13 billion in 2025.
- The market size is expected to grow to USD 11.06 billion by 2032.
- Market to register a cagr of around 1.26% during 2026-32.
- Product Type Shares
- Lager grabbed market share of 55%.
- Lager to witness a volume cagr of around 0.47%.
- Competition
- More than 20 companies are actively engaged in producing beer in Netherlands.
- Top 5 companies acquired around 75% of the market share.
- Warsteiner Brauerei Haus Cramer GmbH & Co KG; Aldi Nederland BV; Jumbo Supermarkten BV; Heineken NV; InBev Nederland NV etc., are few of the top companies.
- Sales Channel
- On-trade grabbed 70% of the market.
Netherlands Beer Market Outlook
The Netherlands beer market was estimated to have a market value of USD 10.13 billion in 2025, and is projected to grow to USD 11.06 billion by 2032 with a CAGR of around 1.26% from 2026 to 2032. With pressures from tax increases and changing consumption behaviors, the market is expected to have a slow recovery in the years ahead. The total demand is expected to see a modest increase from the sustained trajectory of non/low-alcohol beers, along with the gradual shift towards premium lagers and ales.
Lager will continue to be the largest category in the market, representing close to 55% of total sales; however, its volume CAGR will be just 0.47% as health-conscious end users are switching to lighter, low-alcohol options. Leading brewers such as Heineken NV and InBev Nederland NV have a substantial presence collectively controlling the majority of the top 75% market share which contributes to maintaining a competitive category through innovation and product diversification.
The rising interest in healthier lifestyles is expected to remain a significant force in shaping the outlook for beer consumption in the future. end users, particularly younger drinkers, are likely to lean toward low and/or non-alcoholic variants of various style categories and for Ready-to-Drink (RTD) options which are perceived as light and fashionable. Breweries will focus on improving the taste and quality of low-alcohol ales and lagers to reach the next generation of beer drinkers.
The on-trade market channel will likely continue to hold the largest share of the beer category with almost 70% share of total beer sale, especially as the on-trade market steadily emerges back into social drinking occasions and bars. Nonetheless, continuing price sensitivity may continue to sway some demand toward the off-trade and retail online channels as part of an evolving balance in the quality beer segment.

Netherlands Beer Market Growth DriverRising Health Awareness Drives Non/Low Alcohol Beer Demand
The Netherlands beer market is continuing to grow thanks to the rise in demand for non/low-alcohol beers. On the end-user side, young adults are becoming increasingly health-aware and beginning to cut back on high-alcohol products. This movement toward healthier lifestyles has urged end users toward lighter beers to still engage in social functions and enjoy the moment while minimizing the impact on their health goals. Increased product acceptance is improving category performance in spite of the broader pressures on the market.
Major brewers are placing more focus on improving the taste, mouth-feel, and quality of low-alcohol beer offerings to keep in line with changing end-user tastes. These innovations will aid in promoting brand loyalty and begin to replace some of the traditional segments of beer sales lost through alcohol reduction. The ambiguities of responsible drinking and balanced lifestyles only further aids end users acceptance of healthier alternatives to beer in the netherlands.
Netherlands Beer Market ChallengeTax Increases and Bad Weather Drag Down Beer Sales
The consistent rise in excise duties and consumption taxes levied on both alcoholic and non-alcoholic beers places considerable pressure on the Netherlands Beer Market. This rise has led to an increase in retail prices, which, in turn, has made end users cut down on the quantity of beer purchased and allocate more money to other categories. Indeed, these taxes have taken a heavy toll on both on-trade and off-trade channels, as evidenced by a continuing price squeeze in both.
Adverse weather conditions add to the challenge, as a cold spring and summer dampen overall demand for beer. Products such as flavoured lagers and Radlers, linked with seasonal outdoor consumption, have clearly suffered. All of these factors combine to create an unfavorable trading environment limiting volume recovery and growth prospects for brewers across the netherlands.
Unlock Market Intelligence
Explore the market potential with our data-driven report
Netherlands Beer Market TrendShifting end users Preference from Mainstream Lager toward Premium Alternatives
The Netherlands end users landscape is beginning to change as end-users transition away from mainstream lagers toward premium and craft brands. Mainstream lagers will reach a level of decline due to maturing end users interest, price inflation, and how the perception of drinking socially is changing. More younger adults now see heavy drinking as a behavior associated with less healthy habits and may prefer to drink less often but of a higher quality when they do.
The focus on drinking premium, craft or non-alcoholic beverages reflects changes in general lifestyle and taste maturity. End users are increasingly interested in unique flavors, provenance and authenticity behind brewing, and drinks that activate an experience. In turn, beer companies have expanded their product line entries and new product innovations to attract quality-drinking end users.
Netherlands Beer Market OpportunityInnovation in Non-Alcoholic Ales Creates Growth Opportunities
The innovation in the non-alcoholic category will significantly expand the beer segment in the Netherlands. After the success of non-alcoholic lagers, brewers are using their knowledge and expertise to create non-alcoholic, flavourful high quality. The offer provides a fuller, richer beer taste, combined with a lower-calorie, healthier product proposition that modern end users would appreciate.
Over the next several years, the non/low-alcohol segment will get additional traction from innovative product developments and innovations in brewing technology. Breweries will likely continue to announce new versions and initiatives to market those innovative high-quality and wellness benefits. It is expected that this willing approach to product innovation will continue to grow the category and help convert more customers interested in healthier appetences of beer.
Unlock Market Intelligence
Explore the market potential with our data-driven report
Netherlands Beer Market Segmentation Analysis
By Product Type
- Dark Beer
- Lager
- Non/Low Alcohol Beer
- Stout
The segment with highest market share under product type is, lager with approximately 55% of share in the Netherlands Beer Market. Lager is the preferred Product Type because of its immense popularity and cultural importance in the country. With its clean, refreshing taste and balanced flavour profile, lager is an attractive option for the Netherlands beer drinker. With both local and international breweries investing in premium ranges, craft options, and lower alcohol products, end users have greater choice in what is often seen as their preferred beer style.
On-trade and off-trade accessibility give lager additional popularity on the market. netherlands drinkability and mild alcohol levels make it particularly suited for social occasions such as gathering occasions, every day drinking, and other celebrations. Lager is anticipated to continue to be a strong driver of the beer market in the netherlands with an estimated volume CAGR of approximately 0.47% over the forecast period.

By Sales Channel
- On-Trade
- Off-Trade
The segment with highest market share under sales channel is on-trade with approximately 70 % of share of the Netherlands Beer Market. It seems highly likely that on-trade is expected to maintain its dominance due to the significance of beer at the center of social culture in the Netherlands - beers are consumed more frequently in plenty of bars, cafés, and restaurants. Beer is traditionally consumed in such informal public social settings, and the continuous influx of both local and international tourists are beneficial for the sales channel of on-trade.
Moreover, a growing hospitality industry, and regular social practices, supports on-trade performance. Beer is often enjoyed in a fresh on-tap format, particularly for lager varieties, and it is these formats that are favored within this sales channel. With an increase in nightlife in the urban areas, as well as outdoor settings, it seems likely that the on-trade channel will remain in the lead, and likely assist in the growing beer consumption in the country during the forecast period.
List of Companies Covered in Netherlands Beer Market
The companies listed below are highly influential in the Netherlands beer market, with a significant market share and a strong impact on industry developments.
- Warsteiner Brauerei Haus Cramer GmbH & Co KG
- Aldi Nederland BV
- Jumbo Supermarkten BV
- Heineken NV
- InBev Nederland NV
- Koninklijke Grolsch NV
- Swinkels Family Brewers NV
- Royal Ahold NV
- Duvel Moortgat NV
- Gulpener Bierbrouwerij BV
Frequently Asked Questions
Related Report
1. Market Segmentation
1.1. Research Scope
1.2. Research Methodology
1.3. Definitions and Assumptions
2. Executive Summary
3. Netherland Beer Market Policies, Regulations, and Standards
4. Netherland Beer Market Dynamics
4.1. Growth Factors
4.2. Challenges
4.3. Trends
4.4. Opportunities
5. Netherland Beer Market Statistics, 2022-2032F
5.1. Market Size & Growth Outlook
5.1.1.By Revenues in US$ Million
5.1.2.By Quantity Sold in Million Litres
5.2. Market Segmentation & Growth Outlook
5.2.1.By Product Type
5.2.1.1. Dark Beer- Market Insights and Forecast 2022-2032, USD Million
5.2.1.1.1. Ale- Market Insights and Forecast 2022-2032, USD Million
5.2.1.1.2. Sorghum Beer- Market Insights and Forecast 2022-2032, USD Million
5.2.1.1.3. Weissbier/Weizen/Wheat Beer- Market Insights and Forecast 2022-2032, USD Million
5.2.1.2. Lager- Market Insights and Forecast 2022-2032, USD Million
5.2.1.2.1. Flavoured/Mixed Lager- Market Insights and Forecast 2022-2032, USD Million
5.2.1.2.2. Standard Lager- Market Insights and Forecast 2022-2032, USD Million
5.2.1.2.2.1. Premium Lager- Market Insights and Forecast 2022-2032, USD Million
5.2.1.2.2.1.1. Domestic Premium Lager- Market Insights and Forecast 2022-2032, USD Million
5.2.1.2.2.1.2. Imported Premium Lager- Market Insights and Forecast 2022-2032, USD Million
5.2.1.2.2.2. Mid-Priced Lager- Market Insights and Forecast 2022-2032, USD Million
5.2.1.2.2.2.1. Domestic Mid-Priced Lager- Market Insights and Forecast 2022-2032, USD Million
5.2.1.2.2.2.2. Imported Mid-Priced Lager- Market Insights and Forecast 2022-2032, USD Million
5.2.1.2.2.3. Economy Lager- Market Insights and Forecast 2022-2032, USD Million
5.2.1.2.2.3.1. Domestic Economy Lager- Market Insights and Forecast 2022-2032, USD Million
5.2.1.2.2.3.2. Imported Economy Lager- Market Insights and Forecast 2022-2032, USD Million
5.2.1.3. Non/Low Alcohol Beer- Market Insights and Forecast 2022-2032, USD Million
5.2.1.3.1. Low Alcohol Beer- Market Insights and Forecast 2022-2032, USD Million
5.2.1.3.2. Non Alcoholic Beer- Market Insights and Forecast 2022-2032, USD Million
5.2.1.4. Stout- Market Insights and Forecast 2022-2032, USD Million
5.2.1.5. Others (Porter, Malt etc.) - Market Insights and Forecast 2022-2032, USD Million
5.2.2.By Production
5.2.2.1. Macro Brewery- Market Insights and Forecast 2022-2032, USD Million
5.2.2.2. Micro Brewery- Market Insights and Forecast 2022-2032, USD Million
5.2.2.3. Craft Brewery- Market Insights and Forecast 2022-2032, USD Million
5.2.3.By Packaging Type
5.2.3.1. Bottles- Market Insights and Forecast 2022-2032, USD Million
5.2.3.2. Cans- Market Insights and Forecast 2022-2032, USD Million
5.2.3.3. Others- Market Insights and Forecast 2022-2032, USD Million
5.2.4.By Sales Channel
5.2.4.1. On-Trade- Market Insights and Forecast 2022-2032, USD Million
5.2.4.2. Off-Trade- Market Insights and Forecast 2022-2032, USD Million
5.2.5.By Competitors
5.2.5.1. Competition Characteristics
5.2.5.2. Market Share & Analysis
6. Netherland Dark Beer Market Statistics, 2022-2032F
6.1. Market Size & Growth Outlook
6.1.1.By Revenues in US$ Million
6.1.2.By Quantity Sold in Million Litres
6.2. Market Segmentation & Growth Outlook
6.2.1.By Product Type- Market Insights and Forecast 2022-2032, USD Million
6.2.2.By Production- Market Insights and Forecast 2022-2032, USD Million
6.2.3.By Packaging Type- Market Insights and Forecast 2022-2032, USD Million
6.2.4.By Sales Channel- Market Insights and Forecast 2022-2032, USD Million
7. Netherland Lager Beer Market Statistics, 2022-2032F
7.1. Market Size & Growth Outlook
7.1.1.By Revenues in US$ Million
7.1.2.By Quantity Sold in Million Litres
7.2. Market Segmentation & Growth Outlook
7.2.1.By Product Type- Market Insights and Forecast 2022-2032, USD Million
7.2.2.By Production- Market Insights and Forecast 2022-2032, USD Million
7.2.3.By Packaging Type- Market Insights and Forecast 2022-2032, USD Million
7.2.4.By Sales Channel- Market Insights and Forecast 2022-2032, USD Million
8. Netherland Non/Low Alcohol Beer Market Statistics, 2022-2032F
8.1. Market Size & Growth Outlook
8.1.1.By Revenues in US$ Million
8.1.2.By Quantity Sold in Million Litres
8.2. Market Segmentation & Growth Outlook
8.2.1.By Production- Market Insights and Forecast 2022-2032, USD Million
8.2.2.By Packaging Type- Market Insights and Forecast 2022-2032, USD Million
8.2.3.By Sales Channel- Market Insights and Forecast 2022-2032, USD Million
9. Netherland Stout Beer Market Statistics, 2022-2032F
9.1. Market Size & Growth Outlook
9.1.1.By Revenues in US$ Million
9.1.2.By Quantity Sold in Million Litres
9.2. Market Segmentation & Growth Outlook
9.2.1.By Production- Market Insights and Forecast 2022-2032, USD Million
9.2.2.By Packaging Type- Market Insights and Forecast 2022-2032, USD Million
9.2.3.By Sales Channel- Market Insights and Forecast 2022-2032, USD Million
10. Competitive Outlook
10.1. Company Profiles
10.1.1. Heineken NV
10.1.1.1. Business Description
10.1.1.2. Product Portfolio
10.1.1.3. Collaborations & Alliances
10.1.1.4. Recent Developments
10.1.1.5. Financial Details
10.1.1.6. Others
10.1.2. InBev Nederland NV
10.1.2.1. Business Description
10.1.2.2. Product Portfolio
10.1.2.3. Collaborations & Alliances
10.1.2.4. Recent Developments
10.1.2.5. Financial Details
10.1.2.6. Others
10.1.3. Grolsch, Koninklijke NV
10.1.3.1. Business Description
10.1.3.2. Product Portfolio
10.1.3.3. Collaborations & Alliances
10.1.3.4. Recent Developments
10.1.3.5. Financial Details
10.1.3.6. Others
10.1.4. Swinkels Family Brewers NV
10.1.4.1. Business Description
10.1.4.2. Product Portfolio
10.1.4.3. Collaborations & Alliances
10.1.4.4. Recent Developments
10.1.4.5. Financial Details
10.1.4.6. Others
10.1.5. Royal Ahold NV
10.1.5.1. Business Description
10.1.5.2. Product Portfolio
10.1.5.3. Collaborations & Alliances
10.1.5.4. Recent Developments
10.1.5.5. Financial Details
10.1.5.6. Others
10.1.6. Warsteiner Brauerei Haus Cramer GmbH & Co KG
10.1.6.1. Business Description
10.1.6.2. Product Portfolio
10.1.6.3. Collaborations & Alliances
10.1.6.4. Recent Developments
10.1.6.5. Financial Details
10.1.6.6. Others
10.1.7. Aldi Nederland BV
10.1.7.1. Business Description
10.1.7.2. Product Portfolio
10.1.7.3. Collaborations & Alliances
10.1.7.4. Recent Developments
10.1.7.5. Financial Details
10.1.7.6. Others
10.1.8. Jumbo Supermarkten BV
10.1.8.1. Business Description
10.1.8.2. Product Portfolio
10.1.8.3. Collaborations & Alliances
10.1.8.4. Recent Developments
10.1.8.5. Financial Details
10.1.8.6. Others
10.1.9. Duvel Moortgat NV
10.1.9.1. Business Description
10.1.9.2. Product Portfolio
10.1.9.3. Collaborations & Alliances
10.1.9.4. Recent Developments
10.1.9.5. Financial Details
10.1.9.6. Others
10.1.10. Gulpener Bierbrouwerij BV
10.1.10.1.Business Description
10.1.10.2.Product Portfolio
10.1.10.3.Collaborations & Alliances
10.1.10.4.Recent Developments
10.1.10.5.Financial Details
10.1.10.6.Others
11. Disclaimer
| Segment | Sub-Segment |
|---|---|
| By Product Type |
|
| By Production |
|
| By Packaging Type |
|
| By Sales Channel |
|
Research Methodology
This study followed a structured approach comprising four key phases to assess the size and scope of the electro-oxidation market. The process began with thorough secondary research to collect data on the target market, related markets, and broader industry context. These findings, along with preliminary assumptions and estimates, were then validated through extensive primary research involving industry experts from across the value chain. To calculate the overall market size, both top-down and bottom-up methodologies were employed. Finally, market segmentation and data triangulation techniques were applied to refine and validate segment-level estimations.
Secondary Research
The secondary research phase involved gathering data from a wide range of credible and published sources. This step helped in identifying industry trends, defining market segmentation, and understanding the market landscape and value chain.
Sources consulted during this phase included:
- Company annual reports, investor presentations, and press releases
- Industry white papers and certified publications
- Trade directories and market-recognized databases
- Articles from authoritative authors and reputable journals
- Gold and silver standard websites
Secondary research was critical in mapping out the industry's value chain and monetary flow, identifying key market segments, understanding regional variations, and tracking significant industry developments.
Other key sources:
- Financial disclosures
- Industry associations and trade bodies
- News outlets and business magazines
- Academic journals and research studies
- Paid industry databases
Primary Research
To validate secondary data and gain deeper market insights, primary research was conducted with key stakeholders across both the supply and demand sides of the market.
On the demand side, participants included decision-makers and influencers from end-user industries—such as CIOs, CTOs, and CSOs—who provided first-hand perspectives on market needs, product usage, and future expectations.
On the supply side, interviews were conducted with manufacturers, industry associations, and institutional participants to gather insights into current offerings, product pipelines, and market challenges.
Primary interviews provided critical inputs such as:
- Market size and revenue data
- Product and service breakdowns
- Market forecasts
- Regional and application-specific trends
Stakeholders consulted included:
- Leading OEM and solution providers
- Channel and distribution partners
- End users across various applications
- Independent consultants and industry specialists
Market Size Estimation and Data Triangulation
- Identifying Key Market Participants (Secondary Research)
- Goal: To identify the major players or companies in the target market. This typically involves using publicly available data sources such as industry reports, market research publications, and financial statements of companies.
- Tools: Reports from firms like Gartner, Forrester, Euromonitor, Statista, IBISWorld, and others. Public financial statements, news articles, and press releases from top market players.
- Extracting Earnings of Key Market Participants
- Goal: To estimate the earnings generated from the product or service being analyzed. This step helps in understanding the revenue potential of each market player in a specific geography.
- Methods: Earnings data can be gathered from:
- Publicly available financial reports (for listed companies).
- Interviews and primary data sources from professionals, such as Directors, VPs, SVPs, etc. This is especially useful for understanding more nuanced, internal data that isn't publicly disclosed.
- Annual reports and investor presentations of key players.
- Data Collation and Development of a Relevant Data Model
- Goal: To collate inputs from both primary and secondary sources into a structured, data-driven model for market estimation. This model will incorporate key market KPIs and any independent variables relevant to the market.
- Key KPIs: These could include:
- Market size, growth rate, and demand drivers.
- Industry-specific metrics like market share, average revenue per customer (ARPC), or average deal size.
- External variables, such as economic growth rates, inflation rates, or commodity prices, that could affect the market.
- Data Modeling: Based on this data, the market forecasts are developed for the next 5 years. A combination of trend analysis, scenario modeling, and statistical regression might be used to generate projections.
- Scenario Analysis
- Goal: To test different assumptions and validate how sensitive the market is to changes in key variables (e.g., market demand, regulatory changes, technological disruptions).
- Types of Scenarios:
- Base Case: Based on current assumptions and historical data.
- Best-Case Scenario: Assuming favorable market conditions, regulatory environments, and technological advancements.
- Worst-Case Scenario: Accounting for adverse factors, such as economic downturns, stricter regulations, or unexpected disruptions.


