Peru Cards and Payments Market Report: Trends, Growth and Forecast (2026-2032)
ByInstrument Type (Cards (Debit Card, Charge Card, ATM Card, Pre-Paid Card, Credit Card, Store Card), Mobile Wallets, Cheques, Others), ByCard Type (Contact Smart Card, Contactless Smart Card, Non-Smart Card), ByType of Payments (B2B, B2C, C2C, C2B (E-commerce Shopping, Payment at POS Terminals)), ByTransaction Type (Domestic, Foreign), ByApplication (Food & Groceries, Health & Pharmacies, Travel & Tourism, Hospitality, Others (Media & Entertainment)) ... Read more
|
Major Players
|
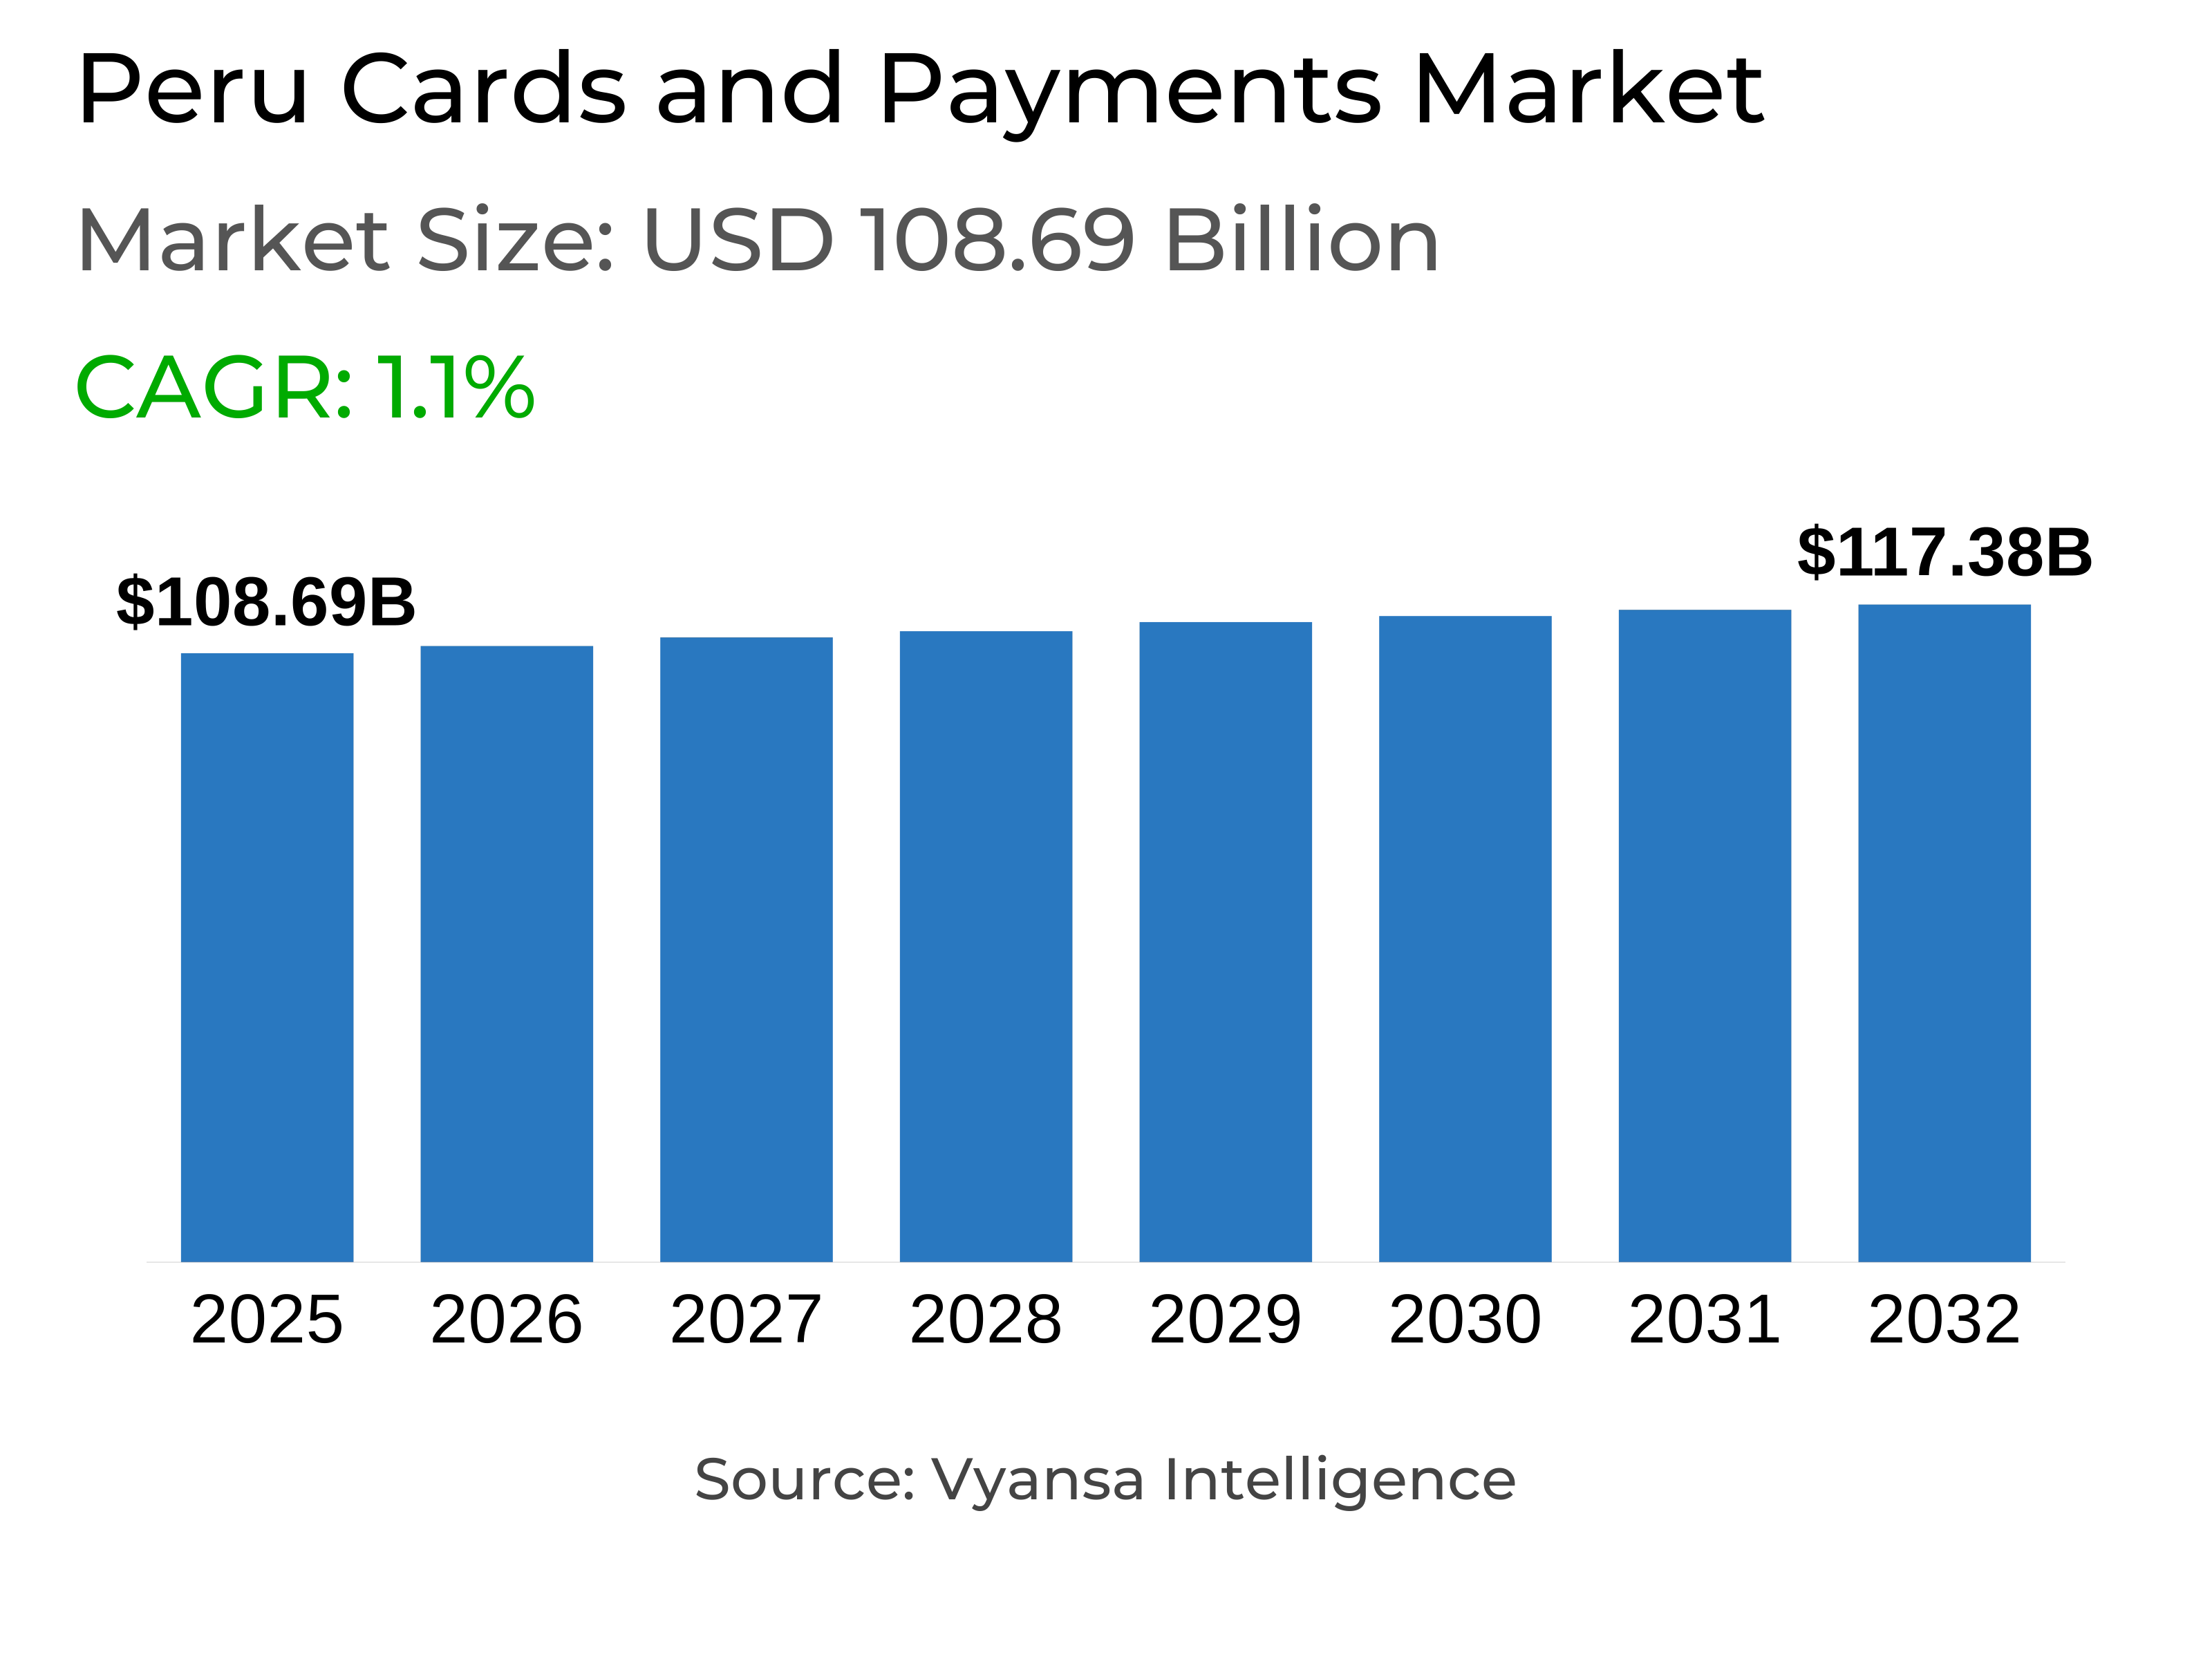
Peru Cards and Payments Market Statistics and Insights, 2026
- Market Size Statistics
- Cards and Payments in Peru is estimated at $ 108.69 Billion.
- The market size is expected to grow to $ 117.38 Billion by 2032.
- Market to register a CAGR of around 1.1% during 2026-32.
- Instrument Type Shares
- Cards grabbed market share of 90%.
- Cards to witness a volume CAGR of around 3.44%.
- Competition
- More than 15 companies are actively engaged in producing Cards and Payments in Peru.
- Top 5 companies acquired 70% of the market share.
- Scotiabank Perú SAA, Banco Ripley SA, EEDE Tarjetas Peruanas Prepago SA, Banco de Crédito del Perú, Banco BBVA Perú etc., are few of the top companies.
- Card Type
- Contactless Smart Card grabbed 90% of the market.
Peru Cards and Payments Market Outlook
The Peru cards and payments market is estimated at USD 108.69 billion and is expected to grow to USD 117.38 billion by 2032, registering a volume CAGR of around 3.44%. Growth will be supported by improving economic conditions, rising employment, and stronger end user purchasing power. As cash continues to lose ground, financial cards and digital payment methods are becoming increasingly popular, with end users appreciating the convenience, security, and contactless features of modern cards.
Debit and prepaid cards are expected to remain the most widely used, reflecting cautious end user attitudes toward debt following the 2023 recession. Prepaid cards will gain further traction as they expand in public transport services, with a single card for Metro, Metropolitano, and corridor networks in Lima set to boost adoption. Contactless smart cards, which already account for 90% of the market, will continue to dominate due to their ease of use and enhanced security against theft and fraud.
Technology will play a central role in shaping the market outlook. The adoption of NFC, Tap to Pay, and smartphone-based acceptance solutions will further drive digital transactions, while fintech companies are expected to intensify competition with innovative products and partnerships with banks. Interoperability of e-wallets will also support stronger penetration of digital payments across the country.
Looking ahead, declining reference rates from the Central Reserve Bank of Peru may gradually ease high credit card interest costs, improving usage. At the same time, financial institutions are expected to invest in stronger fraud prevention technologies to enhance trust. Combined with broader acceptance of cards at retail points nationwide, these factors will ensure sustained growth for Peru cards and payments market through 2032.

Peru Cards and Payments Market Growth Driver
Improvement of the Economic Environment
The growth of Peru cards and payments is strongly driven by the improvement of the national economy. With inflation levels within the target range, steady growth in production, and better job opportunities, end users are experiencing gradual increases in their income. This economic stability encourages higher consumption and creates a favorable environment for the adoption of different payment solutions, including financial cards and digital methods.
At the same time, the cautious approach of end users towards debt, due to the recent recession and difficulties in meeting payment commitments, has made debit and prepaid cards more attractive than credit cards. This shift in preference highlights how economic recovery not only boosts spending but also shapes end user choices, ultimately supporting the continued expansion of financial cards and payments across the country.
Peru Cards and Payments Market Trend
Growing Adoption of Contactless and Digital Payment Technologies
Technology plays a key role in shaping financial cards and payments in Peru, as it allows the introduction of modern and efficient products that boost the use of alternatives to cash. The incorporation of Near Field Communication (NFC) technology is widely accepted, with most end users using debit, credit, or prepaid cards in contactless form. This system is valued for its ease of use and security, as it avoids handing the card to a seller or cashier, reducing risks of theft or fraud in a country with high crime rates.
Alongside NFC, Tap to Pay and Tap to Phone (TTP) solutions are also gaining ground, enabling smartphones to function as points of sale and process payments through apps. The rise of fintech companies further strengthens this shift, as they collaborate with financial institutions to provide innovative solutions that expand access to digital payment methods and intensify competition.
Unlock Market Intelligence
Explore the market potential with our data-driven report
Peru Cards and Payments Market Opportunity
Growing Use of Prepaid Cards in Public Transport
The expansion of prepaid cards in public transport is creating a major opportunity in Peru cards and payments market. Prepaid cards are being implemented on more routes and are becoming available at a greater number of points of sale and recharge, making them easier for end users to access and use. This growing coverage encourages more people to adopt prepaid cards as a convenient payment option for daily travel.
In 2025, a single prepaid card is being introduced for use across Lima’s Metro, Metropolitano, and bus corridors. This unified solution removes the need for multiple cards and simplifies the payment process for commuters. By integrating different transport services into one card, prepaid cards become more practical and attractive to the mass population, positioning them as an essential tool for everyday mobility and expanding their role in the wider payments ecosystem.
Unlock Market Intelligence
Explore the market potential with our data-driven report
Peru Cards and Payments Market Segmentation Analysis

By Instrument Type
- Cards
- Mobile Wallets
- Cheques
- Others
The segment with the highest market share under the Instrument Type is Cards, which captured nearly 90% of the Peru cards and payments market. This dominance is supported by strong end user preference for debit and prepaid cards, as people remain cautious about credit card debt following the 2023 recession. Rising adoption of digital payments, combined with broader card acceptance at retail and service points, has further strengthened the use of cards. Prepaid cards, in particular, have gained momentum, as recharge options and usage points expand across the country.
Looking forward, cards are expected to register a volume CAGR of around 3.44%, reflecting steady growth despite competition from electronic wallets and mobile payments. The incorporation of NFC technology and the expansion of contactless solutions are reinforcing card usage, while government-backed financial inclusion initiatives continue to broaden access. This ensures that cards remain the leading instrument type in Peru payments landscape.
By Card Type
- Contact Smart Card
- Contactless Smart Card
- Non-Smart Card
The segment with the highest market share under the Card Type is Contactless Smart Card, which accounted for almost 90% of the Peru cards and payments market. These cards have seen rapid adoption due to their ease of use, speed, and enhanced security. End users value the ability to make payments without handing cards over to merchants, a feature particularly important in the context of rising crime rates. The growth of NFC-enabled cards, spanning debit, credit, and prepaid formats, has firmly positioned contactless smart cards as the most trusted and widely used type.
The popularity of contactless smart cards is also driven by the expansion of Tap to Pay and Tap to Phone technologies, which make everyday transactions more convenient. With increasing acceptance across points of sale and integration into transport systems, contactless smart cards are set to remain the dominant card type, complementing the broader rise of digital payments in Peru.
Top Companies in Peru Cards and Payments Market
The top companies operating in the market include Scotiabank Perú SAA, Banco Ripley SA, EEDE Tarjetas Peruanas Prepago SA, Banco de Crédito del Perú, Banco BBVA Perú, Banco Internacional del Perú SAA, Banco Falabella Perú SA, Financiera Oh! SA, Sodexo Perú SAC, Servitebca Perú SA, etc., are the top players operating in the Peru Cards and Payments Market.
Frequently Asked Questions
Related Report
1. Market Segmentation
1.1. Research Scope
1.2. Research Methodology
1.3. Definitions and Assumptions
2. Executive Summary
3. Peru Cards and Payments Market Policies, Regulations, and Standards
4. Peru Cards and Payments Market Dynamics
4.1. Growth Factors
4.2. Challenges
4.3. Trends
4.4. Opportunities
5. Peru Cards and Payments Market Statistics, 2022-2032F
5.1. Market Size & Growth Outlook
5.1.1. By Revenues in US$ Million
5.2. Market Segmentation & Growth Outlook
5.2.1. By Instrument Type
5.2.1.1. Cards- Market Insights and Forecast 2022-2032, USD Million
5.2.1.1.1. Debit Card- Market Insights and Forecast 2022-2032, USD Million
5.2.1.1.2. Charge Card- Market Insights and Forecast 2022-2032, USD Million
5.2.1.1.3. ATM Card- Market Insights and Forecast 2022-2032, USD Million
5.2.1.1.4. Pre-Paid Card- Market Insights and Forecast 2022-2032, USD Million
5.2.1.1.5. Credit Card- Market Insights and Forecast 2022-2032, USD Million
5.2.1.1.6. Store Card- Market Insights and Forecast 2022-2032, USD Million
5.2.1.2. Mobile Wallets- Market Insights and Forecast 2022-2032, USD Million
5.2.1.3. Cheques- Market Insights and Forecast 2022-2032, USD Million
5.2.1.4. Others- Market Insights and Forecast 2022-2032, USD Million
5.2.2. By Card Type
5.2.2.1. Contact Smart Card- Market Insights and Forecast 2022-2032, USD Million
5.2.2.2. Contactless Smart Card- Market Insights and Forecast 2022-2032, USD Million
5.2.2.3. Non-Smart Card- Market Insights and Forecast 2022-2032, USD Million
5.2.3. By Type of Payments
5.2.3.1. B2B- Market Insights and Forecast 2022-2032, USD Million
5.2.3.2. B2C- Market Insights and Forecast 2022-2032, USD Million
5.2.3.3. C2C- Market Insights and Forecast 2022-2032, USD Million
5.2.3.4. C2B- Market Insights and Forecast 2022-2032, USD Million
5.2.3.4.1. E-commerce Shopping- Market Insights and Forecast 2022-2032, USD Million
5.2.3.4.2. Payment at POS Terminals- Market Insights and Forecast 2022-2032, USD Million
5.2.4. By Transaction Type
5.2.4.1. Domestic- Market Insights and Forecast 2022-2032, USD Million
5.2.4.2. Foreign- Market Insights and Forecast 2022-2032, USD Million
5.2.5. By Application
5.2.5.1. Food & Groceries- Market Insights and Forecast 2022-2032, USD Million
5.2.5.2. Health & Pharmacies- Market Insights and Forecast 2022-2032, USD Million
5.2.5.3. Travel & Tourism- Market Insights and Forecast 2022-2032, USD Million
5.2.5.4. Hospitality- Market Insights and Forecast 2022-2032, USD Million
5.2.5.5. Others (Media & Entertainment)- Market Insights and Forecast 2022-2032, USD Million
5.2.6. By Competitors
5.2.6.1. Competition Characteristics
5.2.6.2. Market Share & Analysis
6. Peru Cards Market Statistics, 2022-2032F
6.1. Market Size & Growth Outlook
6.1.1. By Revenues in US$ Million
6.2. Market Segmentation & Growth Outlook
6.2.1. By Card Type- Market Insights and Forecast 2022-2032, USD Million
6.2.2. By Type of Payments- Market Insights and Forecast 2022-2032, USD Million
6.2.3. By Transaction Type- Market Insights and Forecast 2022-2032, USD Million
6.2.4. By Application- Market Insights and Forecast 2022-2032, USD Million
7. Peru Mobile Wallets Market Statistics, 2022-2032F
7.1. Market Size & Growth Outlook
7.1.1. By Revenues in US$ Million
7.2. Market Segmentation & Growth Outlook
7.2.1. By Type of Payments- Market Insights and Forecast 2022-2032, USD Million
7.2.2. By Transaction Type- Market Insights and Forecast 2022-2032, USD Million
7.2.3. By Application- Market Insights and Forecast 2022-2032, USD Million
8. Peru Cheques Market Statistics, 2022-2032F
8.1. Market Size & Growth Outlook
8.1.1. By Revenues in US$ Million
8.2. Market Segmentation & Growth Outlook
8.2.1. By Type of Payments- Market Insights and Forecast 2022-2032, USD Million
8.2.2. By Transaction Type- Market Insights and Forecast 2022-2032, USD Million
8.2.3. By Application- Market Insights and Forecast 2022-2032, USD Million
9. Competitive Outlook
9.1. Company Profiles
9.1.1. Banco de Crédito del Perú
9.1.1.1. Business Description
9.1.1.2. Product Portfolio
9.1.1.3. Collaborations & Alliances
9.1.1.4. Recent Developments
9.1.1.5. Financial Details
9.1.1.6. Others
9.1.2. Banco BBVA Perú
9.1.2.1. Business Description
9.1.2.2. Product Portfolio
9.1.2.3. Collaborations & Alliances
9.1.2.4. Recent Developments
9.1.2.5. Financial Details
9.1.2.6. Others
9.1.3. Banco Internacional del Perú SAA
9.1.3.1. Business Description
9.1.3.2. Product Portfolio
9.1.3.3. Collaborations & Alliances
9.1.3.4. Recent Developments
9.1.3.5. Financial Details
9.1.3.6. Others
9.1.4. Banco Falabella Perú SA
9.1.4.1. Business Description
9.1.4.2. Product Portfolio
9.1.4.3. Collaborations & Alliances
9.1.4.4. Recent Developments
9.1.4.5. Financial Details
9.1.4.6. Others
9.1.5. Financiera Oh! SA
9.1.5.1. Business Description
9.1.5.2. Product Portfolio
9.1.5.3. Collaborations & Alliances
9.1.5.4. Recent Developments
9.1.5.5. Financial Details
9.1.5.6. Others
9.1.6. Scotiabank Perú SAA
9.1.6.1. Business Description
9.1.6.2. Product Portfolio
9.1.6.3. Collaborations & Alliances
9.1.6.4. Recent Developments
9.1.6.5. Financial Details
9.1.6.6. Others
9.1.7. Banco Ripley SA
9.1.7.1. Business Description
9.1.7.2. Product Portfolio
9.1.7.3. Collaborations & Alliances
9.1.7.4. Recent Developments
9.1.7.5. Financial Details
9.1.7.6. Others
9.1.8. EEDE Tarjetas Peruanas Prepago SA
9.1.8.1. Business Description
9.1.8.2. Product Portfolio
9.1.8.3. Collaborations & Alliances
9.1.8.4. Recent Developments
9.1.8.5. Financial Details
9.1.8.6. Others
9.1.9. Sodexo Perú SAC
9.1.9.1. Business Description
9.1.9.2. Product Portfolio
9.1.9.3. Collaborations & Alliances
9.1.9.4. Recent Developments
9.1.9.5. Financial Details
9.1.9.6. Others
9.1.10. Servitebca Perú SA
9.1.10.1. Business Description
9.1.10.2. Product Portfolio
9.1.10.3. Collaborations & Alliances
9.1.10.4. Recent Developments
9.1.10.5. Financial Details
9.1.10.6. Others
10. Disclaimer
| Segment | Sub-Segment |
|---|---|
| By Instrument Type |
|
| By Card Type |
|
| By Type of Payments |
|
| By Transaction Type |
|
| By Application |
|
Research Methodology
This study followed a structured approach comprising four key phases to assess the size and scope of the electro-oxidation market. The process began with thorough secondary research to collect data on the target market, related markets, and broader industry context. These findings, along with preliminary assumptions and estimates, were then validated through extensive primary research involving industry experts from across the value chain. To calculate the overall market size, both top-down and bottom-up methodologies were employed. Finally, market segmentation and data triangulation techniques were applied to refine and validate segment-level estimations.
Secondary Research
The secondary research phase involved gathering data from a wide range of credible and published sources. This step helped in identifying industry trends, defining market segmentation, and understanding the market landscape and value chain.
Sources consulted during this phase included:
- Company annual reports, investor presentations, and press releases
- Industry white papers and certified publications
- Trade directories and market-recognized databases
- Articles from authoritative authors and reputable journals
- Gold and silver standard websites
Secondary research was critical in mapping out the industry's value chain and monetary flow, identifying key market segments, understanding regional variations, and tracking significant industry developments.
Other key sources:
- Financial disclosures
- Industry associations and trade bodies
- News outlets and business magazines
- Academic journals and research studies
- Paid industry databases
Primary Research
To validate secondary data and gain deeper market insights, primary research was conducted with key stakeholders across both the supply and demand sides of the market.
On the demand side, participants included decision-makers and influencers from end-user industries—such as CIOs, CTOs, and CSOs—who provided first-hand perspectives on market needs, product usage, and future expectations.
On the supply side, interviews were conducted with manufacturers, industry associations, and institutional participants to gather insights into current offerings, product pipelines, and market challenges.
Primary interviews provided critical inputs such as:
- Market size and revenue data
- Product and service breakdowns
- Market forecasts
- Regional and application-specific trends
Stakeholders consulted included:
- Leading OEM and solution providers
- Channel and distribution partners
- End users across various applications
- Independent consultants and industry specialists
Market Size Estimation and Data Triangulation
- Identifying Key Market Participants (Secondary Research)
- Goal: To identify the major players or companies in the target market. This typically involves using publicly available data sources such as industry reports, market research publications, and financial statements of companies.
- Tools: Reports from firms like Gartner, Forrester, Euromonitor, Statista, IBISWorld, and others. Public financial statements, news articles, and press releases from top market players.
- Extracting Earnings of Key Market Participants
- Goal: To estimate the earnings generated from the product or service being analyzed. This step helps in understanding the revenue potential of each market player in a specific geography.
- Methods: Earnings data can be gathered from:
- Publicly available financial reports (for listed companies).
- Interviews and primary data sources from professionals, such as Directors, VPs, SVPs, etc. This is especially useful for understanding more nuanced, internal data that isn't publicly disclosed.
- Annual reports and investor presentations of key players.
- Data Collation and Development of a Relevant Data Model
- Goal: To collate inputs from both primary and secondary sources into a structured, data-driven model for market estimation. This model will incorporate key market KPIs and any independent variables relevant to the market.
- Key KPIs: These could include:
- Market size, growth rate, and demand drivers.
- Industry-specific metrics like market share, average revenue per customer (ARPC), or average deal size.
- External variables, such as economic growth rates, inflation rates, or commodity prices, that could affect the market.
- Data Modeling: Based on this data, the market forecasts are developed for the next 5 years. A combination of trend analysis, scenario modeling, and statistical regression might be used to generate projections.
- Scenario Analysis
- Goal: To test different assumptions and validate how sensitive the market is to changes in key variables (e.g., market demand, regulatory changes, technological disruptions).
- Types of Scenarios:
- Base Case: Based on current assumptions and historical data.
- Best-Case Scenario: Assuming favorable market conditions, regulatory environments, and technological advancements.
- Worst-Case Scenario: Accounting for adverse factors, such as economic downturns, stricter regulations, or unexpected disruptions.


