Global PEG Esters Market Report: Trends, Growth and Forecast (2026-2032)
By Product Type (Polysorbate 80, Ceteareth-20, Ceteareth-12, PEG-10 Phytosterol, Olive Oil PEG Esters, PEG-10 Rapeseed Sterol, PEG-100 Stearate, PEG-120 Methyl Glucose Dioleate, PEG-14M, PEG-150 Distearate, PEG-150 Pentaerythrityl Tetrastearate, PEG-18 Glyceryl Oleate Cocoate, PEG-20 Glyceryl Triisostearate, C12-20 Acid PEG-8 Ester, Glycereth-26, PEG-20 Stearate, PEG-200 Hydrogenated Glyceryl Palmate, PEG-3 Distearate, PEG-30 Dipolyhydroxystearate, PEG-4 Laurate, PEG-4 Rapeseedamide, PEG-40 Hydrogenated Castor Oil, Methoxy PEG-10, Methyl Gluceth-10, Methyl Gluceth-20, PEG-33 Castor Oil, PEG-35 Castor Oil, PEG-40 Stearate, PEG-45M, PEG-55 Propylene Glycol Oleate, PEG-6 Caprylic/Capric Glycerides, PEG-60 Almond Glycerides, PEG-60 Hydrogenated Castor Oil, PEG-8 Isostearate, PEG-8 Laurate, Polysorbate 20, Polysorbate 60, Steareth-12 Stearate, Steareth-21, Trideceth-10), By End Users (Home Care, Personal Care (Body Care, Skin Care, Sun Care, Hair Care, Make-up, Face Masks, Moisturisers, Metal Working, Fragrances, Anti-Aging Creams), Food, Pharmaceuticals, Lubricants, Pigments, Coatings, Adhesives, Textiles), By Regions (North America, South America, Western Europe, Eastern Europe, APAC (excluding China), China, Middle East & Africa) ... Read more
|
Major Players
|
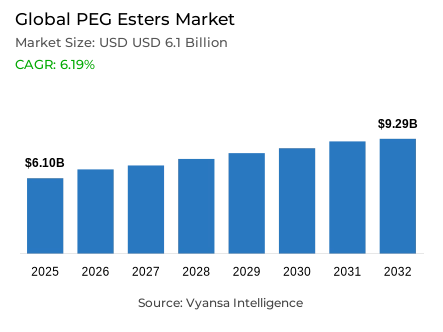
Global PEG Esters Market Statistics and Insights, 2026
- Market Size Statistics
- Global peg esters market is estimated at USD 6.1 billion in 2025.
- The market size is expected to grow to USD 9.29 billion by 2032.
- Market to register a CAGR of around 6.19% during 2026-32.
- Product Type Shares
- Polysorbate 80 grabbed market share of 25%.
- Competition
- Global peg esters market is currently being catered to by more than 20 companies.
- Top 10 companies acquired the maximum share of the market.
- B.C. Cosmetic and Food; Clariant; Croda; A&E Connock; Abitec etc., are few of the top companies.
- End Users
- Pharmaceuticals grabbed 40% of the market.
- Region
- Western Europe leads with a 35% share of the global market.
Global PEG Esters Market Outlook
The Global PEG Esters Market is estimated at USD 6.1 billion in 2025 and is projected to reach around USD 9.29 billion in 2032, registering a CAGR of about 6.19% between the year 2026 and 2032. The future expansion is largely supported by the changes in the structure, but not the temporary changes in demand. The increased demands on quality assurance in pharmaceutical excipients, following the revised World Health Organization Good Manufacturing Practices published in 2023–2024, have made excipient quality no longer a cost issue but a core compliance issue. PEG esters are finding their way into controlled drug manufacturing value chains as pharmaceutical manufacturers are increasingly relying on suppliers that demonstrate auditable GMP compliance, documented risk management, and batch-level traceability.
The growth in the production of pharmaceuticals in developed economies also supports the market perspective. The high growth in export-based production, particularly in Europe, maintains a steady volume demand of PEG ester excipients used in oral, topical, and injectable preparations. Pharmaceuticals constitute 40% of the overall end-user demand, which highlights the critical nature of PEG esters in improving solubility, stability, and bioavailability in modern drug products. The long-term supplier relationships are consolidated by high regulatory thresholds and audit-based procurement practices, which will assist in maintaining pricing stability and predictable demand until 2032.
The dynamics of product-mix also support consistent market growth. Polysorbate 80 alone has a market share of 25%, which is fuelled by its wide regulatory acceptance and essential use in vaccines, biologics, and parenteral formulations. Its proven use in the prevention of protein aggregation and formulation stability makes it a standard excipient in high-value therapies. PEG ester derivatives still serve to support diversified demand in non-pharmaceutical applications, thus expanding the market base.
From a regional perspective, Western Europe takes the lead with a 35% share of the overall market, driven by the presence of robust regulatory environments, sophisticated pharmaceutical infrastructure, and export-driven manufacturing. Although the mature markets are home to the majority of the market value, the growing biopharmaceutical capacity in emerging markets is a driving force behind the incremental volume growth, collectively sustaining a stable market outlook through 2032.

Global PEG Esters Market Growth Driver
Regulatory Quality Frameworks Reinforcing Pharmaceutical Excipient Demand
The tightening of quality assurance expectations of pharmaceutical excipients is a structural precondition of the Global PEG Esters Market development, which was triggered by the updated World Health Organization Good Manufacturing Practices promulgated between 2023 and 2024. These recommendations require extensive risk-management systems to cover contamination prevention, traceability, storage, and distribution of high-risk excipients, after WHO investigations into fatal cases of diethylene glycol and ethylene glycol contamination reported in 2023. As a result, the regulatory reaction has raised the quality of excipients beyond a procurement factor to a fundamental compliance issue, forcing pharmaceutical manufacturers to only deal with suppliers who can demonstrate auditable GMP compliance, documented risk evaluation, and batch-level control mechanisms. This change entrenches PEG ester excipients further into controlled pharmaceutical value chains, where quality-assurance credentials are becoming more and more the defining factor of supplier eligibility, not price competitiveness alone.
Simultaneously, the volume demand is supported by the continued growth of pharmaceutical production in developed economies. In 2024, the European Union registered a pharmaceutical trade surplus of EUR 194 billion, with exports increasing by 13.5 percent annually, indicating a high dependency on EU-manufactured medicines worldwide. With the increase in the volume of pharmaceutical production in solid, liquid, topical, and injectable dosage forms, the demand of PEG ester excipients with established regulatory acceptance is expected to be high until 2032.
Global PEG Esters Market Challenge
Compliance Intensity and Impurity Control Pressures Constraining Suppliers
Increased regulatory oversight poses a major operational risk in the Global PEG Esters Market, especially to manufacturers who do not have sophisticated compliance systems. The updates of WHO excipient GMP published in 2023-2024 need a lot of documentation, risk-based quality-management systems, and improved batch-level analytical testing, which significantly increases the complexity of production and fixed operating costs. This burden is further increased by the 2025 amendment of the Drugs and Cosmetics Rules in India, which requires the disclosure of the qualitative excipient on pharmaceutical labels, compelling the excipient suppliers and formulators to enhance traceability, validation, and audit preparedness. These demands lengthen development cycles and unfairly affect smaller or emerging-market manufacturers who cannot afford to incur increased compliance costs.
There are other limitations due to impurity-management requirements. The International Agency for Research on Cancer, operating under WHO oversight, categorizes ethylene oxide as carcinogenic and 1,4-dioxane as probably carcinogenic, requiring strict purification and residual solvent management of PEG-based materials. To comply with these standards, it is necessary to invest in sophisticated analytical tools and regulated manufacturing conditions, which increases entry barriers and restricts the ability to compete in the entire supplier environment.
Unlock Market Intelligence
Explore the market potential with our data-driven report
Global PEG Esters Market Trend
Biologics Manufacturing Expansion and Personalized Therapeutics Momentum
One of the obvious structural trends defining the Global PEG Esters Market is the fast growth of biologics production and personalized-medicine systems, especially in the Asia-Pacific region. In China, India, and South Korea, multilateral financing structures are supporting government-supported efforts to scale biopharmaceutical capacity. The long-term support of the World Bank to the National Biopharma Mission in India has led to the acceleration of the creation of vaccines, monoclonal antibodies, and advanced therapies, and the 2025 investment framework of UNCTAD focuses on the local production and supply of pharmaceuticals and the resilience of the supply chain in emerging markets. These efforts are transforming the geography of manufacturing in the world to distributed, regionally resilient manufacturing centers.
This change directly increases the need of specialized excipients with improved stability, solubility and biocompatibility profiles. PEG esters are essential functional groups in biologics that inhibit aggregation of proteins and enhance delivery efficiency. With the increase in biosimilar approvals and the enhancement of regulatory harmonization, end users are standardizing PEG ester use in complex formulations. The growing CDMO capacity and focused therapeutics pipeline in Asia-Pacific makes the region the key driver of incremental growth by 2032.
Global PEG Esters Market Opportunity
Infrastructure Investment and Quality-Led Supply Chain Localization
Healthcare-infrastructure investment in emerging markets is a promising opportunity in the global PEG esters market, especially to suppliers that are in line with WHO GMP requirements. The creation of compliant excipient ecosystems in Asia and Africa to decrease reliance on single-source imports is being encouraged by World Bank and UNCTAD frameworks that promote local pharmaceutical production. India exemplifies this opportunity by investing parallel in other chemical-intensive industries. Its water and wastewater treatment market was estimated to be USD 3.1 billion in 2024 and is expected to be over USD 5.3 billion in 2030, with government programmes like Jal Jeevan Mission, AMRUT, and the National Mission for Clean Ganga indirectly enhancing domestic specialty-chemical capacity.
At the same time, the 2025 excipient disclosure requirement in India establishes a favorable status of suppliers of quality-certified PEG-ester with full documentation and traceability. Compliant partners are becoming more popular with multinational pharmaceutical manufacturers in order to reduce regulatory and reputational risk. The suppliers who can deliver pharmaceutical-grade products and capitalize on the wider chemical-infrastructure investments are in a good position to experience disproportionate growth as the global supply chains become more diverse.
Global PEG Esters Market Regional Analysis

By Regions
- North America
- South America
- Western Europe
- Eastern Europe
- APAC (excluding China)
- China
- Middle East & Africa
Western Europe holds a commanding 35% share of the Global PEG Esters Market, underpinned by advanced pharmaceutical manufacturing infrastructure, stringent regulatory oversight, and high healthcare expenditure levels. Germany, France, Italy, and the United Kingdom function as core production and innovation hubs, with Germany maintaining particular prominence due to its extensive R&D ecosystem and clinical development capacity. The region’s pharmaceutical sector performance in 2024, marked by a €194 billion trade surplus and double-digit export growth, reinforces sustained demand for high-quality excipients integrated into export-oriented drug manufacturing.
Western Europe’s regulatory environment, aligned closely with European Medicines Agency requirements and WHO GMP standards, positions the region as the global benchmark for excipient quality compliance. While the remaining 65% market share spans North America, Asia-Pacific, and emerging regions, Asia-Pacific represents the fastest-growing geography due to government-backed biopharma investment and manufacturing expansion. This distribution reflects value concentration in mature markets and volume-driven growth momentum shifting eastward.
Unlock Market Intelligence
Explore the market potential with our data-driven report
Global PEG Esters Market Segmentation Analysis
By Product Type
- Polysorbate 80
- Ceteareth-20
- Ceteareth-12
- PEG-10 Phytosterol
- Olive Oil PEG Esters
- PEG-10 Rapeseed Sterol
- PEG-100 Stearate
- PEG-120 Methyl Glucose Dioleate
- PEG-14M
- PEG-150 Distearate
- PEG-150 Pentaerythrityl Tetrastearate
- PEG-18 Glyceryl Oleate Cocoate
- PEG-20 Glyceryl Triisostearate
- C12-20 Acid PEG-8 Ester
- Glycereth-26
- PEG-20 Stearate
- PEG-200 Hydrogenated Glyceryl Palmate
- PEG-3 Distearate
- PEG-30 Dipolyhydroxystearate
- PEG-4 Laurate
- PEG-4 Rapeseedamide
- PEG-40 Hydrogenated Castor Oil
- Methoxy PEG-10
- Methyl Gluceth-10
- Methyl Gluceth-20
- PEG-33 Castor Oil
- PEG-35 Castor Oil
- PEG-40 Stearate
- PEG-45M
- PEG-55 Propylene Glycol Oleate
- PEG-6 Caprylic/Capric Glycerides
- PEG-60 Almond Glycerides
- PEG-60 Hydrogenated Castor Oil
- PEG-8 Isostearate
- PEG-8 Laurate
- Polysorbate 20
- Polysorbate 60
- Steareth-12 Stearate
- Steareth-21
- Trideceth-10
Polysorbate 80 dominates the Global PEG Esters Market product landscape, accounting for 25% market share and reflecting its critical role in regulated pharmaceutical and biopharmaceutical applications. As PEG-20 sorbitan monooleate, polysorbate 80 is widely used as a solubilizer and stabilizer in parenteral formulations, vaccines, and biologics due to its strong biocompatibility profile and extensive regulatory acceptance by authorities such as the FDA and European Medicines Agency. Its proven ability to prevent protein aggregation and enhance bioavailability has established it as a formulation standard for high-value injectable and complex therapies. This entrenched regulatory familiarity significantly lowers adoption barriers for pharmaceutical end users.
The remaining 75% of the product segment includes PEG stearates, olive oil PEG esters, and other specialized derivatives serving cosmetics, food, and industrial applications. PEG stearates, validated as safe by the Cosmetic Ingredient Review Expert Panel, maintain strong usage in personal care formulations. Product diversity underscores the platform versatility of PEG esters, supporting incremental growth beyond polysorbate-dominated pharmaceutical demand.

By End Users
- Home Care
- Personal Care
- Body Care
- Skin Care
- Sun Care
- Hair Care
- Make-up
- Face Masks
- Moisturisers
- Metal Working
- Fragrances
- Anti-Aging Creams
- Food
- Pharmaceuticals
- Lubricants
- Pigments
- Coatings
- Adhesives
- Textiles
Pharmaceutical end users represent the largest demand center within the Global PEG Esters Market, accounting for 40% market share and reflecting the excipients’ essential role in addressing solubility and stability challenges of modern drug formulations. PEG esters are integral across oral, topical, and injectable dosage forms, supporting bioavailability enhancement and product consistency. PEGylation techniques have become standard practice, with more than 30 FDA-approved PEGylated medicines currently marketed, reinforcing long-term reliance on PEG-based excipients within regulated therapeutic pipelines. High regulatory barriers, stringent quality requirements, and audit-driven procurement models further consolidate pharmaceutical end users as the highest-value segment.
The remaining 60% of demand is distributed across cosmetics, personal care, food, industrial processing, and water treatment applications. These segments typically utilize alternative specification grades under distinct regulatory frameworks. While individually significant, they operate at lower margins compared to pharmaceutical applications. This segmentation structure highlights pharmaceuticals as the strategic anchor segment, underpinning profitability, pricing power, and supplier concentration through 2032.
Market Players in Global PEG Esters Market
These market players maintain a significant presence in the Global peg esters market sector and contribute to its ongoing evolution.
- B.C. Cosmetic and Food
- Clariant
- Croda
- A&E Connock
- Abitec
- AkzoNobel
- Ashaland
- BASF
- Dow Chemicals
- DuPont
- Erca Wilmar
- Essential Ingredients
- Evonik
- Ethox
- Gattefosse
Frequently Asked Questions
Related Report
1. Market Segmentation
1.1. Research Scope
1.2. Research Methodology
1.3. Definitions and Assumptions
2. Executive Summary
3. Global PEG Esters Market Policies, Regulations, and Standards
4. Global PEG Esters Market Dynamics
4.1. Growth Factors
4.2. Challenges
4.3. Trends
4.4. Opportunities
5. Global PEG Esters Market Statistics, 2022-2032F
5.1. Market Size & Growth Outlook
5.1.1.By Revenues in USD Million
5.1.2.By Quantity Sold (Thousand Tons)
5.2. Market Segmentation & Growth Outlook
5.2.1.By Product Type
5.2.1.1. Polysorbate 80- Market Insights and Forecast 2022-2032, USD Million
5.2.1.2. Ceteareth-20- Market Insights and Forecast 2022-2032, USD Million
5.2.1.3. Ceteareth-12- Market Insights and Forecast 2022-2032, USD Million
5.2.1.4. PEG-10 Phytosterol- Market Insights and Forecast 2022-2032, USD Million
5.2.1.5. Olive Oil PEG Esters- Market Insights and Forecast 2022-2032, USD Million
5.2.1.6. PEG-10 Rapeseed Sterol- Market Insights and Forecast 2022-2032, USD Million
5.2.1.7. PEG-100 Stearate- Market Insights and Forecast 2022-2032, USD Million
5.2.1.8. PEG-120 Methyl Glucose Dioleate- Market Insights and Forecast 2022-2032, USD Million
5.2.1.9. PEG-14M- Market Insights and Forecast 2022-2032, USD Million
5.2.1.10. PEG-150 Distearate- Market Insights and Forecast 2022-2032, USD Million
5.2.1.11. PEG-150 Pentaerythrityl Tetrastearate- Market Insights and Forecast 2022-2032, USD Million
5.2.1.12. PEG-18 Glyceryl Oleate Cocoate- Market Insights and Forecast 2022-2032, USD Million
5.2.1.13. PEG-20 Glyceryl Triisostearate- Market Insights and Forecast 2022-2032, USD Million
5.2.1.14. C12-20 Acid PEG-8 Ester- Market Insights and Forecast 2022-2032, USD Million
5.2.1.15. Glycereth-26- Market Insights and Forecast 2022-2032, USD Million
5.2.1.16. PEG-20 Stearate- Market Insights and Forecast 2022-2032, USD Million
5.2.1.17. PEG-200 Hydrogenated Glyceryl Palmate- Market Insights and Forecast 2022-2032, USD Million
5.2.1.18. PEG-3 Distearate- Market Insights and Forecast 2022-2032, USD Million
5.2.1.19. PEG-30 Dipolyhydroxystearate- Market Insights and Forecast 2022-2032, USD Million
5.2.1.20. PEG-4 Laurate- Market Insights and Forecast 2022-2032, USD Million
5.2.1.21. PEG-4 Rapeseedamide- Market Insights and Forecast 2022-2032, USD Million
5.2.1.22. PEG-40 Hydrogenated Castor Oil- Market Insights and Forecast 2022-2032, USD Million
5.2.1.23. Methoxy PEG-10- Market Insights and Forecast 2022-2032, USD Million
5.2.1.24. Methyl Gluceth-10- Market Insights and Forecast 2022-2032, USD Million
5.2.1.25. Methyl Gluceth-20- Market Insights and Forecast 2022-2032, USD Million
5.2.1.26. PEG-33 Castor Oil- Market Insights and Forecast 2022-2032, USD Million
5.2.1.27. PEG-35 Castor Oil- Market Insights and Forecast 2022-2032, USD Million
5.2.1.28. PEG-40 Stearate- Market Insights and Forecast 2022-2032, USD Million
5.2.1.29. PEG-45M- Market Insights and Forecast 2022-2032, USD Million
5.2.1.30. PEG-55 Propylene Glycol Oleate- Market Insights and Forecast 2022-2032, USD Million
5.2.1.31. PEG-6 Caprylic/Capric Glycerides- Market Insights and Forecast 2022-2032, USD Million
5.2.1.32. PEG-60 Almond Glycerides- Market Insights and Forecast 2022-2032, USD Million
5.2.1.33. PEG-60 Hydrogenated Castor Oil- Market Insights and Forecast 2022-2032, USD Million
5.2.1.34. PEG-8 Isostearate- Market Insights and Forecast 2022-2032, USD Million
5.2.1.35. PEG-8 Laurate- Market Insights and Forecast 2022-2032, USD Million
5.2.1.36. Polysorbate 20- Market Insights and Forecast 2022-2032, USD Million
5.2.1.37. Polysorbate 60- Market Insights and Forecast 2022-2032, USD Million
5.2.1.38. Steareth-12 Stearate- Market Insights and Forecast 2022-2032, USD Million
5.2.1.39. Steareth-21- Market Insights and Forecast 2022-2032, USD Million
5.2.1.40. Trideceth-10- Market Insights and Forecast 2022-2032, USD Million
5.2.2.By End Users
5.2.2.1. Home Care- Market Insights and Forecast 2022-2032, USD Million
5.2.2.2. Personal Care- Market Insights and Forecast 2022-2032, USD Million
5.2.2.2.1. Body Care- Market Insights and Forecast 2022-2032, USD Million
5.2.2.2.2. Skin Care- Market Insights and Forecast 2022-2032, USD Million
5.2.2.2.3. Sun Care - Market Insights and Forecast 2022-2032, USD Million
5.2.2.2.4. Hair Care- Market Insights and Forecast 2022-2032, USD Million
5.2.2.2.5. Make-up- Market Insights and Forecast 2022-2032, USD Million
5.2.2.2.6. Face Masks- Market Insights and Forecast 2022-2032, USD Million
5.2.2.2.7. Moisturisers - Market Insights and Forecast 2022-2032, USD Million
5.2.2.2.8. Metal Working- Market Insights and Forecast 2022-2032, USD Million
5.2.2.2.9. Fragrances - Market Insights and Forecast 2022-2032, USD Million
5.2.2.2.10. Anti-Aging Creams - Market Insights and Forecast 2022-2032, USD Million
5.2.2.3. Food- Market Insights and Forecast 2022-2032, USD Million
5.2.2.4. Pharmaceuticals- Market Insights and Forecast 2022-2032, USD Million
5.2.2.5. Lubricants- Market Insights and Forecast 2022-2032, USD Million
5.2.2.6. Pigments - Market Insights and Forecast 2022-2032, USD Million
5.2.2.7. Coatings- Market Insights and Forecast 2022-2032, USD Million
5.2.2.8. Adhesives - Market Insights and Forecast 2022-2032, USD Million
5.2.2.9. Textiles- Market Insights and Forecast 2022-2032, USD Million
5.2.3.By Regions
5.2.3.1. North America
5.2.3.2. South America
5.2.3.3. Western Europe
5.2.3.4. Eastern Europe
5.2.3.5. APAC (excluding China)
5.2.3.6. China
5.2.3.7. Middle East & Africa
5.2.4.By Competitors
5.2.4.1. Competition Characteristics
5.2.4.2. Market Share & Analysis
6. North America PEG Esters Market Statistics, 2022-2032F
6.1. Market Size & Growth Outlook
6.1.1.By Revenues in USD Million
6.1.2.By Quantity Sold (Thousand Tons)
6.2. Market Segmentation & Growth Outlook
6.2.1.By Product Type- Market Insights and Forecast 2022-2032, USD Million
6.2.2.By End Users- Market Insights and Forecast 2022-2032, USD Million
7. South America PEG Esters Market Statistics, 2022-2032F
7.1. Market Size & Growth Outlook
7.1.1.By Revenues in USD Million
7.1.2.By Quantity Sold (Thousand Tons)
7.2. Market Segmentation & Growth Outlook
7.2.1.By Product Type- Market Insights and Forecast 2022-2032, USD Million
7.2.2.By End Users- Market Insights and Forecast 2022-2032, USD Million
8. Western Europe PEG Esters Market Statistics, 2022-2032F
8.1. Market Size & Growth Outlook
8.1.1.By Revenues in USD Million
8.1.2.By Quantity Sold (Thousand Tons)
8.2. Market Segmentation & Growth Outlook
8.2.1.By Product Type- Market Insights and Forecast 2022-2032, USD Million
8.2.2.By End Users- Market Insights and Forecast 2022-2032, USD Million
9. Eastern Europe PEG Esters Market Statistics, 2022-2032F
9.1. Market Size & Growth Outlook
9.1.1.By Revenues in USD Million
9.1.2.By Quantity Sold (Thousand Tons)
9.2. Market Segmentation & Growth Outlook
9.2.1.By Product Type- Market Insights and Forecast 2022-2032, USD Million
9.2.2.By End Users- Market Insights and Forecast 2022-2032, USD Million
10. APAC (excluding China) PEG Esters Market Statistics, 2022-2032F
10.1. Market Size & Growth Outlook
10.1.1. By Revenues in USD Million
10.1.2. By Quantity Sold (Thousand Tons)
10.2. Market Segmentation & Growth Outlook
10.2.1. By Product Type- Market Insights and Forecast 2022-2032, USD Million
10.2.2. By End Users- Market Insights and Forecast 2022-2032, USD Million
11. China PEG Esters Market Statistics, 2022-2032F
11.1. Market Size & Growth Outlook
11.1.1. By Revenues in USD Million
11.1.2. By Quantity Sold (Thousand Tons)
11.2. Market Segmentation & Growth Outlook
11.2.1. By Product Type- Market Insights and Forecast 2022-2032, USD Million
11.2.2. By End Users- Market Insights and Forecast 2022-2032, USD Million
12. Middle East & Africa PEG Esters Market Statistics, 2022-2032F
12.1. Market Size & Growth Outlook
12.1.1. By Revenues in USD Million
12.1.2. By Quantity Sold (Thousand Tons)
12.2. Market Segmentation & Growth Outlook
12.2.1. By Product Type- Market Insights and Forecast 2022-2032, USD Million
12.2.2. By End Users- Market Insights and Forecast 2022-2032, USD Million
13. Competitive Outlook
13.1. Company Profiles
13.1.1. A&E Connock
13.1.1.1. Business Description
13.1.1.2. Product Portfolio
13.1.1.3. Collaborations & Alliances
13.1.1.4. Recent Developments
13.1.1.5. Financial Details
13.1.1.6. Others
13.1.2. Abitec
13.1.2.1. Business Description
13.1.2.2. Product Portfolio
13.1.2.3. Collaborations & Alliances
13.1.2.4. Recent Developments
13.1.2.5. Financial Details
13.1.2.6. Others
13.1.3. AkzoNobel
13.1.3.1. Business Description
13.1.3.2. Product Portfolio
13.1.3.3. Collaborations & Alliances
13.1.3.4. Recent Developments
13.1.3.5. Financial Details
13.1.3.6. Others
13.1.4. Ashaland
13.1.4.1. Business Description
13.1.4.2. Product Portfolio
13.1.4.3. Collaborations & Alliances
13.1.4.4. Recent Developments
13.1.4.5. Financial Details
13.1.4.6. Others
13.1.5. BASF
13.1.5.1. Business Description
13.1.5.2. Product Portfolio
13.1.5.3. Collaborations & Alliances
13.1.5.4. Recent Developments
13.1.5.5. Financial Details
13.1.5.6. Others
13.1.6. B.C. Cosmetic and Food
13.1.6.1. Business Description
13.1.6.2. Product Portfolio
13.1.6.3. Collaborations & Alliances
13.1.6.4. Recent Developments
13.1.6.5. Financial Details
13.1.6.6. Others
13.1.7. Clariant
13.1.7.1. Business Description
13.1.7.2. Product Portfolio
13.1.7.3. Collaborations & Alliances
13.1.7.4. Recent Developments
13.1.7.5. Financial Details
13.1.7.6. Others
13.1.8. Croda
13.1.8.1. Business Description
13.1.8.2. Product Portfolio
13.1.8.3. Collaborations & Alliances
13.1.8.4. Recent Developments
13.1.8.5. Financial Details
13.1.8.6. Others
13.1.9. Dow Chemicals
13.1.9.1. Business Description
13.1.9.2. Product Portfolio
13.1.9.3. Collaborations & Alliances
13.1.9.4. Recent Developments
13.1.9.5. Financial Details
13.1.9.6. Others
13.1.10. DuPont
13.1.10.1.Business Description
13.1.10.2.Product Portfolio
13.1.10.3.Collaborations & Alliances
13.1.10.4.Recent Developments
13.1.10.5.Financial Details
13.1.10.6.Others
13.1.11. Erca Wilmar
13.1.11.1.Business Description
13.1.11.2.Product Portfolio
13.1.11.3.Collaborations & Alliances
13.1.11.4.Recent Developments
13.1.11.5.Financial Details
13.1.11.6.Others
13.1.12. Essential Ingredients
13.1.12.1.Business Description
13.1.12.2.Product Portfolio
13.1.12.3.Collaborations & Alliances
13.1.12.4.Recent Developments
13.1.12.5.Financial Details
13.1.12.6.Others
13.1.13. Evonik
13.1.13.1.Business Description
13.1.13.2.Product Portfolio
13.1.13.3.Collaborations & Alliances
13.1.13.4.Recent Developments
13.1.13.5.Financial Details
13.1.13.6.Others
13.1.14. Ethox
13.1.14.1.Business Description
13.1.14.2.Product Portfolio
13.1.14.3.Collaborations & Alliances
13.1.14.4.Recent Developments
13.1.14.5.Financial Details
13.1.14.6.Others
13.1.15. Gattefosse
13.1.15.1.Business Description
13.1.15.2.Product Portfolio
13.1.15.3.Collaborations & Alliances
13.1.15.4.Recent Developments
13.1.15.5.Financial Details
13.1.15.6.Others
13.1.16. Guangzhou Tinci Materials
13.1.16.1.Business Description
13.1.16.2.Product Portfolio
13.1.16.3.Collaborations & Alliances
13.1.16.4.Recent Developments
13.1.16.5.Financial Details
13.1.16.6.Others
13.1.17. Hallstar
13.1.17.1.Business Description
13.1.17.2.Product Portfolio
13.1.17.3.Collaborations & Alliances
13.1.17.4.Recent Developments
13.1.17.5.Financial Details
13.1.17.6.Others
13.1.18. Hytop
13.1.18.1.Business Description
13.1.18.2.Product Portfolio
13.1.18.3.Collaborations & Alliances
13.1.18.4.Recent Developments
13.1.18.5.Financial Details
13.1.18.6.Others
13.1.19. Jeen International
13.1.19.1.Business Description
13.1.19.2.Product Portfolio
13.1.19.3.Collaborations & Alliances
13.1.19.4.Recent Developments
13.1.19.5.Financial Details
13.1.19.6.Others
13.1.20. Lamberti S.p.A
13.1.20.1.Business Description
13.1.20.2.Product Portfolio
13.1.20.3.Collaborations & Alliances
13.1.20.4.Recent Developments
13.1.20.5.Financial Details
13.1.20.6.Others
13.1.21. Lonza
13.1.21.1.Business Description
13.1.21.2.Product Portfolio
13.1.21.3.Collaborations & Alliances
13.1.21.4.Recent Developments
13.1.21.5.Financial Details
13.1.21.6.Others
13.1.22. Lubrizol
13.1.22.1.Business Description
13.1.22.2.Product Portfolio
13.1.22.3.Collaborations & Alliances
13.1.22.4.Recent Developments
13.1.22.5.Financial Details
13.1.22.6.Others
13.1.23. Meisei Chemical Works
13.1.23.1.Business Description
13.1.23.2.Product Portfolio
13.1.23.3.Collaborations & Alliances
13.1.23.4.Recent Developments
13.1.23.5.Financial Details
13.1.23.6.Others
13.1.24. Mohini
13.1.24.1.Business Description
13.1.24.2.Product Portfolio
13.1.24.3.Collaborations & Alliances
13.1.24.4.Recent Developments
13.1.24.5.Financial Details
13.1.24.6.Others
13.1.25. Mosselman SA
13.1.25.1.Business Description
13.1.25.2.Product Portfolio
13.1.25.3.Collaborations & Alliances
13.1.25.4.Recent Developments
13.1.25.5.Financial Details
13.1.25.6.Others
13.1.26. Nikko Chemicals
13.1.26.1.Business Description
13.1.26.2.Product Portfolio
13.1.26.3.Collaborations & Alliances
13.1.26.4.Recent Developments
13.1.26.5.Financial Details
13.1.26.6.Others
13.1.27. Nihon Emulsion
13.1.27.1.Business Description
13.1.27.2.Product Portfolio
13.1.27.3.Collaborations & Alliances
13.1.27.4.Recent Developments
13.1.27.5.Financial Details
13.1.27.6.Others
13.1.28. Olive Oil PEG Esters
13.1.28.1.Business Description
13.1.28.2.Product Portfolio
13.1.28.3.Collaborations & Alliances
13.1.28.4.Recent Developments
13.1.28.5.Financial Details
13.1.28.6.Others
13.1.29. Protameen Chemicals
13.1.29.1.Business Description
13.1.29.2.Product Portfolio
13.1.29.3.Collaborations & Alliances
13.1.29.4.Recent Developments
13.1.29.5.Financial Details
13.1.29.6.Others
13.1.30. PCC
13.1.30.1.Business Description
13.1.30.2.Product Portfolio
13.1.30.3.Collaborations & Alliances
13.1.30.4.Recent Developments
13.1.30.5.Financial Details
13.1.30.6.Others
13.1.31. Rita Corporation
13.1.31.1.Business Description
13.1.31.2.Product Portfolio
13.1.31.3.Collaborations & Alliances
13.1.31.4.Recent Developments
13.1.31.5.Financial Details
13.1.31.6.Others
13.1.32. Res Pharma
13.1.32.1.Business Description
13.1.32.2.Product Portfolio
13.1.32.3.Collaborations & Alliances
13.1.32.4.Recent Developments
13.1.32.5.Financial Details
13.1.32.6.Others
13.1.33. SEPPIC
13.1.33.1.Business Description
13.1.33.2.Product Portfolio
13.1.33.3.Collaborations & Alliances
13.1.33.4.Recent Developments
13.1.33.5.Financial Details
13.1.33.6.Others
13.1.34. Sabo SPA
13.1.34.1.Business Description
13.1.34.2.Product Portfolio
13.1.34.3.Collaborations & Alliances
13.1.34.4.Recent Developments
13.1.34.5.Financial Details
13.1.34.6.Others
13.1.35. Solvay
13.1.35.1.Business Description
13.1.35.2.Product Portfolio
13.1.35.3.Collaborations & Alliances
13.1.35.4.Recent Developments
13.1.35.5.Financial Details
13.1.35.6.Others
13.1.36. Spak Orgochem
13.1.36.1.Business Description
13.1.36.2.Product Portfolio
13.1.36.3.Collaborations & Alliances
13.1.36.4.Recent Developments
13.1.36.5.Financial Details
13.1.36.6.Others
13.1.37. Stearinerie Dubois Fils
13.1.37.1.Business Description
13.1.37.2.Product Portfolio
13.1.37.3.Collaborations & Alliances
13.1.37.4.Recent Developments
13.1.37.5.Financial Details
13.1.37.6.Others
13.1.38. Toho
13.1.38.1.Business Description
13.1.38.2.Product Portfolio
13.1.38.3.Collaborations & Alliances
13.1.38.4.Recent Developments
13.1.38.5.Financial Details
13.1.38.6.Others
13.1.39. Universal PreservAChem
13.1.39.1.Business Description
13.1.39.2.Product Portfolio
13.1.39.3.Collaborations & Alliances
13.1.39.4.Recent Developments
13.1.39.5.Financial Details
13.1.39.6.Others
13.1.40. Vantage
13.1.40.1.Business Description
13.1.40.2.Product Portfolio
13.1.40.3.Collaborations & Alliances
13.1.40.4.Recent Developments
13.1.40.5.Financial Details
13.1.40.6.Others
13.1.41. Vevy
13.1.41.1.Business Description
13.1.41.2.Product Portfolio
13.1.41.3.Collaborations & Alliances
13.1.41.4.Recent Developments
13.1.41.5.Financial Details
13.1.41.6.Others
14. Disclaimer
| Segment | Sub-Segment |
|---|---|
| By Product Type |
|
| By End Users |
|
| By Regions |
|
Research Methodology
This study followed a structured approach comprising four key phases to assess the size and scope of the electro-oxidation market. The process began with thorough secondary research to collect data on the target market, related markets, and broader industry context. These findings, along with preliminary assumptions and estimates, were then validated through extensive primary research involving industry experts from across the value chain. To calculate the overall market size, both top-down and bottom-up methodologies were employed. Finally, market segmentation and data triangulation techniques were applied to refine and validate segment-level estimations.
Secondary Research
The secondary research phase involved gathering data from a wide range of credible and published sources. This step helped in identifying industry trends, defining market segmentation, and understanding the market landscape and value chain.
Sources consulted during this phase included:
- Company annual reports, investor presentations, and press releases
- Industry white papers and certified publications
- Trade directories and market-recognized databases
- Articles from authoritative authors and reputable journals
- Gold and silver standard websites
Secondary research was critical in mapping out the industry's value chain and monetary flow, identifying key market segments, understanding regional variations, and tracking significant industry developments.
Other key sources:
- Financial disclosures
- Industry associations and trade bodies
- News outlets and business magazines
- Academic journals and research studies
- Paid industry databases
Primary Research
To validate secondary data and gain deeper market insights, primary research was conducted with key stakeholders across both the supply and demand sides of the market.
On the demand side, participants included decision-makers and influencers from end-user industries—such as CIOs, CTOs, and CSOs—who provided first-hand perspectives on market needs, product usage, and future expectations.
On the supply side, interviews were conducted with manufacturers, industry associations, and institutional participants to gather insights into current offerings, product pipelines, and market challenges.
Primary interviews provided critical inputs such as:
- Market size and revenue data
- Product and service breakdowns
- Market forecasts
- Regional and application-specific trends
Stakeholders consulted included:
- Leading OEM and solution providers
- Channel and distribution partners
- End users across various applications
- Independent consultants and industry specialists
Market Size Estimation and Data Triangulation
- Identifying Key Market Participants (Secondary Research)
- Goal: To identify the major players or companies in the target market. This typically involves using publicly available data sources such as industry reports, market research publications, and financial statements of companies.
- Tools: Reports from firms like Gartner, Forrester, Euromonitor, Statista, IBISWorld, and others. Public financial statements, news articles, and press releases from top market players.
- Extracting Earnings of Key Market Participants
- Goal: To estimate the earnings generated from the product or service being analyzed. This step helps in understanding the revenue potential of each market player in a specific geography.
- Methods: Earnings data can be gathered from:
- Publicly available financial reports (for listed companies).
- Interviews and primary data sources from professionals, such as Directors, VPs, SVPs, etc. This is especially useful for understanding more nuanced, internal data that isn't publicly disclosed.
- Annual reports and investor presentations of key players.
- Data Collation and Development of a Relevant Data Model
- Goal: To collate inputs from both primary and secondary sources into a structured, data-driven model for market estimation. This model will incorporate key market KPIs and any independent variables relevant to the market.
- Key KPIs: These could include:
- Market size, growth rate, and demand drivers.
- Industry-specific metrics like market share, average revenue per customer (ARPC), or average deal size.
- External variables, such as economic growth rates, inflation rates, or commodity prices, that could affect the market.
- Data Modeling: Based on this data, the market forecasts are developed for the next 5 years. A combination of trend analysis, scenario modeling, and statistical regression might be used to generate projections.
- Scenario Analysis
- Goal: To test different assumptions and validate how sensitive the market is to changes in key variables (e.g., market demand, regulatory changes, technological disruptions).
- Types of Scenarios:
- Base Case: Based on current assumptions and historical data.
- Best-Case Scenario: Assuming favorable market conditions, regulatory environments, and technological advancements.
- Worst-Case Scenario: Accounting for adverse factors, such as economic downturns, stricter regulations, or unexpected disruptions.


