Global Nickel Nitrate Market Report: Trends, Growth and Forecast (2026-2032)
By Purity Grade (Battery Grade, Industrial Grade), By Application (Electroplating, Catalysts, Batteries), By Region (North America, Latin America, Europe, Middle East & Africa, Asia Pacific) ... Read more
|
Major Players
|
Global Nickel Nitrate Market Statistics and Insights, 2026
- Market Size Statistics
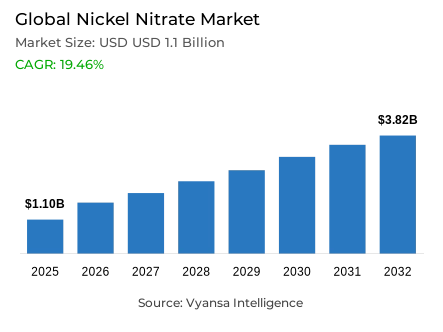
- Global nickel nitrate market is estimated at USD 1.1 billion in 2025.
- The market size is expected to grow to USD 3.82 billion by 2032.
- Market to register a CAGR of around 19.46% during 2026-32.
- Purity Grade Shares
- Battery grade grabbed market share of 60%.
- Competition
- Global nickel nitrate market is currently being catered to by more than 25 companies.
- Top 5 companies acquired around 60% of the market share.
- Tanaka Chemical; Resonac Holdings; L&F Co.; Umicore; Todini Chemicals etc., are few of the top companies.
- Application
- Batteries grabbed 40% of the market.
- Region
- Asia Pacific leads with a 50% share of the global market.
Global Nickel Nitrate Market Outlook
The Global nickel nitrate market is estimated to be USD 1.1 billion in 2025 and is expected to grow vigorously to about USD 3.82 billion by 2032, with a CAGR of approximately 19.46% between 2026-32. This growth perspective is closely associated with the increasing electrification of transport and stationary energy storage systems. The current battery production already takes a large portion of primary nickel in the world, and the increasing use of electric vehicles is still increasing the demand of high-nickel cathode chemistries. With battery producers focusing on energy density, safety, and long driving range, nickel nitrate is an important high-purity precursor that facilitates uniform electrochemical behavior and adherence to high safety standards.
The most noticeable demand momentum is in battery-related applications, which constitute approximately 40% of the overall market consumption. Nickel nitrate battery-grade contains approximately 60% of the purity, highlighting its essential contribution to lithium-ion battery manufacturing where impurity control directly affects cycle life and safety. Although the increasing use of lithium iron phosphate batteries is leveling the increase in volume in cost-sensitive segments, high-nickel chemistries remain prevalent in high-end and long-range electric vehicles. This has directed the demand of nickel nitrate to high-specification, specialized battery production and not just volume-based growth.
Geographic concentration and policy controls influence the medium-term perspective on the supply side. The control of mined nickel production by Indonesia and its scheduled ore quotas have an impact on the availability of feedstock and cost structures of refined nickel products. Simultaneously, reduced nickel prices have limited short-term investment incentives, limiting the speedy growth of supply. These dynamics facilitate a more balanced position as the downstream battery demand keeps scaling.
The Asia Pacific region is the leader region with about 50% of the world market, which is backed by its mining, refining and battery production ecosystem. The domestic value addition and downstream processing focus of the region supports the long-term growth visibility of nickel nitrate in the 2026-32 period.

Global Nickel Nitrate Market Growth Driver
Structural Expansion of Battery Manufacturing Drives Nickel Nitrate Consumption
The pace of electrification of transportation and stationary energy storage systems remains the main structural force of the global nickel nitrate market. In 2024, the battery industry made up about 14-15% of the total primary nickel usage worldwide, and some 384,000 metric tonnes of nickel was used in battery production. According to the International Energy Agency, the world battery demand was estimated at about 1 terawatt hour in 2024, which is about 25% per year of increase, with much of it being driven by the implementation of electric-vehicles. NMC and NCA cathode chemistries continue to dominate performance-oriented vehicle segments, where energy density, thermal stability, and driving range are non-negotiable technical requirements to end users.
Nickel nitrate holds a strategic role as a high-purity precursor in the production of cathode active materials, with impurity limits and crystallographic uniformity having a direct impact on battery safety and cycle life. In contrast to lower-grade nickel compounds, battery-grade nickel nitrate forms the basis of predictable electrochemical behavior, thus allowing manufacturers to meet more demanding safety certifications and warranty requirements. This structural dependence on high-purity materials supports long-term demand that is independent of short-term commodity-price cycles, which supports long-term growth of nickel-nitrate suppliers in line with battery end-use markets.
Global Nickel Nitrate Market Challenge
Supply Concentration and Policy Driven Output Controls Limit Market Flexibility
Supply-side constraints are a major structural issue in the global nickel nitrate market due to high levels of geographic concentration. In 2024, Indonesia produced over 56% of the world nickel production, and has declared its intention to cut ore-mining quotas by about 34% in 2026, to 250 million tonnes compared to 379 million tonnes in 2025. These policy choices, which are supported by the Ministry of Energy and Mineral Resources, are meant to maintain the availability of resources in the long run and speed up the domestic downstream processing. These actions have a direct effect on the supply and price formation of refined nickel feedstock needed to make nickel-nitrate.
Investment incentives are also complicated by market conditions. In 2024, a world nickel surplus of about 150 kilotonnes helped to drive down prices, and London Metal Exchange nickel prices fell sharply on an annual basis. The reduction in prices squeezes producer margins and deters near-term capital investment in new refining and purification capacity, especially beyond China and Indonesia where operating costs are structurally higher. This policy restriction and poor pricing inhibits the elasticity of supply hence restricting the market to respond promptly to the rapidly increasing downstream demand.
Unlock Market Intelligence
Explore the market potential with our data-driven report
Global Nickel Nitrate Market Trend
Rapid Adoption of Alternative Battery Chemistries Reshapes Demand Patterns
One of the structural trends that are affecting the global nickel nitrate market is the fast uptake of lithium-iron-phosphate batteries. The International Energy Agency estimates that in 2024, LFP chemistries had almost half of the global electric-vehicle battery demand, a significant increase over less than 10% in 2020. LFP batteries do not use nickel, which provides direct displacement pressure on nickel-dependent chemistries, especially in mass-market vehicles and grid-scale storage. The Chinese manufacturers, who own most of the world LFP capacity, have led to massive cost cuts, and the adoption has been accelerated in Southeast Asia, India and Brazil.
Even with this change, high-nickel cathode chemistries are still essential to high-end and long-range electric vehicles where weight, volume efficiency and performance are still important to the end user. This has created a bifurcated battery-market system, with nickel-free chemistries controlling cost-optimised markets, and nickel-intensive chemistries maintaining demand in performance-oriented markets. As a result, the demand of nickel-nitrate is more and more oriented towards specialised, high-specification battery production, as opposed to growth based on uniform volume.
Global Nickel Nitrate Market Opportunity
Downstream Refining and High Purity Processing Create Long Term Upside
The global nickel nitrate market has a great opportunity to expand downstream refining capacity. In 2024, high-grade nickel production increased to about 1.4 million tonnes, with Class 1 nickel production at about 1 million tonnes, indicating investment in purification and cathode-material infrastructure, especially in China and Indonesia. Indonesia is experiencing a rapid shift to value addition of ore to nickel matte and mixed hydroxide precipitate due to regulatory incentives that are enhancing the availability of refined feedstock that can be used to produce high-purity nickel-nitrate.
In addition to batteries, diversified industrial end-use industries enhance the visibility of opportunities. Nickel-based compounds with predictable chemical behavior are used in electroplating, specialty alloys, aerospace components, petrochemical catalysts and hydrogen-production infrastructure. The industrial demand of specialty alloys was strong in 2024, which will help to maintain a stable consumption base without any dependence on the volatility of the battery-sector. With the growing electrification targets in the next decade and the constrained supply of refined nickel under sustained policy measures, manufacturers with advanced purification facilities are in a good position to gain margin and long-term contracting prospects.
Global Nickel Nitrate Market Regional Analysis

By Region
- North America
- Latin America
- Europe
- Middle East & Africa
- Asia Pacific
Asia Pacific accounts for approximately 50% of the Global nickel nitrate market, reflecting the region’s integrated dominance across mining, refining, and end use manufacturing. Indonesia leads global mined nickel production with over 56% share, while China represents the largest battery manufacturing and electric vehicle demand center. The concentration of refining capacity and cathode material production within the region ensures proximity between raw material supply and downstream processing, lowering logistics costs and enhancing supply chain coordination for nickel nitrate producers.
Regional policy frameworks further reinforce this dominance. Indonesia, China, and India increasingly prioritize domestic value addition through refining and chemical processing rather than raw material exports. These strategies attract multinational battery manufacturers and material processors seeking secure access to high purity nickel compounds. As a result, Asia Pacific continues to influence global pricing, investment decisions, and supply availability, positioning the region as the primary determinant of long term growth trajectories for the Global nickel nitrate market.
Unlock Market Intelligence
Explore the market potential with our data-driven report
Global Nickel Nitrate Market Segmentation Analysis
By Purity Grade
- Battery Grade
- Industrial Grade
Battery grade nickel nitrate accounts for approximately 60% of the Global nickel nitrate market by purity classification, reflecting its indispensable role in lithium ion battery manufacturing. Battery grade material requires purity levels exceeding 99.8%, with tightly controlled metal impurities, moisture content, and particle morphology to ensure cathode stability and electrochemical reliability. These specifications are mandatory for compliance with automotive safety standards and long term performance warranties demanded by electric vehicle and energy storage end users. As a result, lower purity alternatives cannot substitute battery grade material without compromising functionality and regulatory approval.
Non battery grade purity segments represent the remaining 40% of market demand, serving electroplating baths, catalyst formulations, and metallurgical applications where tolerance thresholds are less restrictive. Electroplating demand remains structurally stable across automotive components, electronics manufacturing, and industrial equipment, providing a dependable consumption base. This balanced purity structure enhances overall market resilience, as mature industrial applications help offset periods of battery sector cyclicality while preserving premium pricing for high purity battery grade nickel nitrate.

By Application
- Electroplating
- Catalysts
- Batteries
Batteries represent roughly 40% of application level demand within the Global nickel nitrate market, supported by the consumption of approximately 0.5 million tonnes of primary nickel by battery manufacturers in 2024. High nickel cathode chemistries require substantial volumes of nickel nitrate as a precursor, particularly in NMC and NCA formulations used in long range electric vehicles. Battery applications are characterized by strict quality requirements, rapid capacity expansion, and sensitivity to supply reliability, prompting producers to invest in dedicated high purity production lines.
The remaining 60% of application demand is distributed across stainless steel production, specialty alloys, electroplating, and chemical processing. Stainless steel remains the largest absolute nickel consuming sector globally, absorbing more than two million tonnes of primary nickel annually. While these applications utilize nickel nitrate less intensively than batteries, their scale and continuity provide structural demand stability. This diversified application mix reduces overreliance on electric vehicle sales cycles and supports more balanced long term market dynamics.
Market Players in Global Nickel Nitrate Market
These market players maintain a significant presence in the Global nickel nitrate market sector and contribute to its ongoing evolution.
- Tanaka Chemical
- Resonac Holdings
- L&F Co.
- Umicore
- Todini Chemicals
- Mitsubishi Chemical Holdings
- BASF SE
- Sumitomo Metal Mining
- JFE Chemical
- 3M
- Honeywell
- BAE Systems
- Royal Ten Cate
- Koninklijke DSM
- Dow Chemical
Market News & Updates
- L&F Co., 2025:
L&F Co. received the Prime Minister's Award at South Korea's 2025 Korea Green Packaging Technology Fair on December 3, 2025, for its ultra-high-nickel NCM(A) cathode active material technology featuring 95% nickel content or higher. The technology represents the first commercially scaled production of such ultra-high-nickel content materials, developed through a five-year phased roadmap initiated in October 2019. The material incorporates a composite design combining polycrystalline and single-crystal cathode matrices, delivering improved energy density, extended battery life, enhanced safety metrics, and reduced gas generation.
- Umicore, 2025:
Umicore's Specialty Materials Business Group continues to serve as a worldwide supplier of nickel nitrate and related specialty chemicals used in electroplating, catalyst applications, metal finishing, and advanced materials manufacturing. The H1 2025 adjusted EBITDA of €59 million reflects sustained demand for specialty chemical products and successful implementation of operational efficiency measures across the Specialty Materials segment, positioning the company as a critical supplier for nickel-dependent industrial applications.
Frequently Asked Questions
Related Report
1. Market Segmentation
1.1. Research Scope
1.2. Research Methodology
1.3. Definitions and Assumptions
2. Executive Summary
3. Global Nickel Nitrate Market Policies, Regulations, and Standards
4. Global Nickel Nitrate Market Dynamics
4.1. Growth Factors
4.2. Challenges
4.3. Trends
4.4. Opportunities
5. Global Nickel Nitrate Market Statistics, 2022-2032F
5.1. Market Size & Growth Outlook
5.1.1.By Revenues in USD Million
5.2. Market Segmentation & Growth Outlook
5.2.1.By Purity Grade
5.2.1.1. Battery Grade- Market Insights and Forecast 2022-2032, USD Million
5.2.1.2. Industrial Grade- Market Insights and Forecast 2022-2032, USD Million
5.2.2.By Application
5.2.2.1. Electroplating- Market Insights and Forecast 2022-2032, USD Million
5.2.2.2. Catalysts- Market Insights and Forecast 2022-2032, USD Million
5.2.2.3. Batteries- Market Insights and Forecast 2022-2032, USD Million
5.2.3.By Region
5.2.3.1. North America
5.2.3.2. Latin America
5.2.3.3. Europe
5.2.3.4. Middle East & Africa
5.2.3.5. Asia Pacific
5.2.4.By Competitors
5.2.4.1. Competition Characteristics
5.2.4.2. Market Share & Analysis
6. North America Nickel Nitrate Market Statistics, 2022-2032F
6.1. Market Size & Growth Outlook
6.1.1.By Revenues in USD Million
6.2. Market Segmentation & Growth Outlook
6.2.1.By Purity Grade- Market Insights and Forecast 2022-2032, USD Million
6.2.2.By Application- Market Insights and Forecast 2022-2032, USD Million
6.2.3.By Country
6.2.3.1. US
6.2.3.2. Canada
6.2.3.3. Mexico
6.2.3.4. Rest of North America
6.3. US Nickel Nitrate Market Statistics, 2022-2032F
6.3.1.Market Size & Growth Outlook
6.3.1.1. By Revenues in USD Million
6.3.2.Market Segmentation & Growth Outlook
6.3.2.1. By Purity Grade- Market Insights and Forecast 2022-2032, USD Million
6.3.2.2. By Application- Market Insights and Forecast 2022-2032, USD Million
6.4. Canada Nickel Nitrate Market Statistics, 2022-2032F
6.4.1.Market Size & Growth Outlook
6.4.1.1. By Revenues in USD Million
6.4.2.Market Segmentation & Growth Outlook
6.4.2.1. By Purity Grade- Market Insights and Forecast 2022-2032, USD Million
6.4.2.2. By Application- Market Insights and Forecast 2022-2032, USD Million
6.5. Mexico Nickel Nitrate Market Statistics, 2022-2032F
6.5.1.Market Size & Growth Outlook
6.5.1.1. By Revenues in USD Million
6.5.2.Market Segmentation & Growth Outlook
6.5.2.1. By Purity Grade- Market Insights and Forecast 2022-2032, USD Million
6.5.2.2. By Application- Market Insights and Forecast 2022-2032, USD Million
7. Latin America Nickel Nitrate Market Statistics, 2022-2032F
7.1. Market Size & Growth Outlook
7.1.1.By Revenues in USD Million
7.2. Market Segmentation & Growth Outlook
7.2.1.By Purity Grade- Market Insights and Forecast 2022-2032, USD Million
7.2.2.By Application- Market Insights and Forecast 2022-2032, USD Million
7.2.3.By Country
7.2.3.1. Brazil
7.2.3.2. Rest of Latin America
7.3. Brazil Nickel Nitrate Market Statistics, 2022-2032F
7.3.1.Market Size & Growth Outlook
7.3.1.1. By Revenues in USD Million
7.3.2.Market Segmentation & Growth Outlook
7.3.2.1. By Purity Grade- Market Insights and Forecast 2022-2032, USD Million
7.3.2.2. By Application- Market Insights and Forecast 2022-2032, USD Million
8. Europe Nickel Nitrate Market Statistics, 2022-2032F
8.1. Market Size & Growth Outlook
8.1.1.By Revenues in USD Million
8.2. Market Segmentation & Growth Outlook
8.2.1.By Purity Grade- Market Insights and Forecast 2022-2032, USD Million
8.2.2.By Application- Market Insights and Forecast 2022-2032, USD Million
8.2.3.By Country
8.2.3.1. Germany
8.2.3.2. Russia
8.2.3.3. France
8.2.3.4. UK
8.2.3.5. Italy
8.2.3.6. Spain
8.2.3.7. Netherlands
8.2.3.8. Belgium
8.2.3.9. Poland
8.2.3.10. Turkey
8.2.3.11. Rest of Europe
8.3. Germany Nickel Nitrate Market Statistics, 2022-2032F
8.3.1.Market Size & Growth Outlook
8.3.1.1. By Revenues in USD Million
8.3.2.Market Segmentation & Growth Outlook
8.3.2.1. By Purity Grade- Market Insights and Forecast 2022-2032, USD Million
8.3.2.2. By Application- Market Insights and Forecast 2022-2032, USD Million
8.4. Russia Nickel Nitrate Market Statistics, 2022-2032F
8.4.1.Market Size & Growth Outlook
8.4.1.1. By Revenues in USD Million
8.4.2.Market Segmentation & Growth Outlook
8.4.2.1. By Purity Grade- Market Insights and Forecast 2022-2032, USD Million
8.4.2.2. By Application- Market Insights and Forecast 2022-2032, USD Million
8.5. France Nickel Nitrate Market Statistics, 2022-2032F
8.5.1.Market Size & Growth Outlook
8.5.1.1. By Revenues in USD Million
8.5.2.Market Segmentation & Growth Outlook
8.5.2.1. By Purity Grade- Market Insights and Forecast 2022-2032, USD Million
8.5.2.2. By Application- Market Insights and Forecast 2022-2032, USD Million
8.6. UK Nickel Nitrate Market Statistics, 2022-2032F
8.6.1.Market Size & Growth Outlook
8.6.1.1. By Revenues in USD Million
8.6.2.Market Segmentation & Growth Outlook
8.6.2.1. By Purity Grade- Market Insights and Forecast 2022-2032, USD Million
8.6.2.2. By Application- Market Insights and Forecast 2022-2032, USD Million
8.7. Italy Nickel Nitrate Market Statistics, 2022-2032F
8.7.1.Market Size & Growth Outlook
8.7.1.1. By Revenues in USD Million
8.7.2.Market Segmentation & Growth Outlook
8.7.2.1. By Purity Grade- Market Insights and Forecast 2022-2032, USD Million
8.7.2.2. By Application- Market Insights and Forecast 2022-2032, USD Million
8.8. Spain Nickel Nitrate Market Statistics, 2022-2032F
8.8.1.Market Size & Growth Outlook
8.8.1.1. By Revenues in USD Million
8.8.2.Market Segmentation & Growth Outlook
8.8.2.1. By Purity Grade- Market Insights and Forecast 2022-2032, USD Million
8.8.2.2. By Application- Market Insights and Forecast 2022-2032, USD Million
8.9. Netherlands Nickel Nitrate Market Statistics, 2022-2032F
8.9.1.Market Size & Growth Outlook
8.9.1.1. By Revenues in USD Million
8.9.2.Market Segmentation & Growth Outlook
8.9.2.1. By Purity Grade- Market Insights and Forecast 2022-2032, USD Million
8.9.2.2. By Application- Market Insights and Forecast 2022-2032, USD Million
8.10. Belgium Nickel Nitrate Market Statistics, 2022-2032F
8.10.1. Market Size & Growth Outlook
8.10.1.1. By Revenues in USD Million
8.10.2. Market Segmentation & Growth Outlook
8.10.2.1. By Purity Grade- Market Insights and Forecast 2022-2032, USD Million
8.10.2.2. By Application- Market Insights and Forecast 2022-2032, USD Million
8.11. Poland Nickel Nitrate Market Statistics, 2022-2032F
8.11.1. Market Size & Growth Outlook
8.11.1.1. By Revenues in USD Million
8.11.2. Market Segmentation & Growth Outlook
8.11.2.1. By Purity Grade- Market Insights and Forecast 2022-2032, USD Million
8.11.2.2. By Application- Market Insights and Forecast 2022-2032, USD Million
8.12. Turkey Nickel Nitrate Market Statistics, 2022-2032F
8.12.1. Market Size & Growth Outlook
8.12.1.1. By Revenues in USD Million
8.12.2. Market Segmentation & Growth Outlook
8.12.2.1. By Purity Grade- Market Insights and Forecast 2022-2032, USD Million
8.12.2.2. By Application- Market Insights and Forecast 2022-2032, USD Million
9. Middle East & Africa Nickel Nitrate Market Statistics, 2022-2032F
9.1. Market Size & Growth Outlook
9.1.1.By Revenues in USD Million
9.2. Market Segmentation & Growth Outlook
9.2.1.By Purity Grade- Market Insights and Forecast 2022-2032, USD Million
9.2.2.By Application- Market Insights and Forecast 2022-2032, USD Million
9.2.3.By Country
9.2.3.1. Saudi Arabia
9.2.3.2. UAE
9.2.3.3. Rest of Middle East & Africa
9.3. Saudi Arabia Nickel Nitrate Market Statistics, 2022-2032F
9.3.1.Market Size & Growth Outlook
9.3.1.1. By Revenues in USD Million
9.3.2.Market Segmentation & Growth Outlook
9.3.2.1. By Purity Grade- Market Insights and Forecast 2022-2032, USD Million
9.3.2.2. By Application- Market Insights and Forecast 2022-2032, USD Million
9.4. UAE Nickel Nitrate Market Statistics, 2022-2032F
9.4.1.Market Size & Growth Outlook
9.4.1.1. By Revenues in USD Million
9.4.2.Market Segmentation & Growth Outlook
9.4.2.1. By Purity Grade- Market Insights and Forecast 2022-2032, USD Million
9.4.2.2. By Application- Market Insights and Forecast 2022-2032, USD Million
10. Asia Pacific Nickel Nitrate Market Statistics, 2022-2032F
10.1. Market Size & Growth Outlook
10.1.1. By Revenues in USD Million
10.2. Market Segmentation & Growth Outlook
10.2.1. By Purity Grade- Market Insights and Forecast 2022-2032, USD Million
10.2.2. By Application- Market Insights and Forecast 2022-2032, USD Million
10.2.3. By Country
10.2.3.1. China
10.2.3.2. Japan
10.2.3.3. South Korea
10.2.3.4. India
10.2.3.5. Australia
10.2.3.6. Thailand
10.2.3.7. Rest of Asia Pacific
10.3. China Nickel Nitrate Market Statistics, 2022-2032F
10.3.1. Market Size & Growth Outlook
10.3.1.1. By Revenues in USD Million
10.3.2. Market Segmentation & Growth Outlook
10.3.2.1. By Purity Grade- Market Insights and Forecast 2022-2032, USD Million
10.3.2.2. By Application- Market Insights and Forecast 2022-2032, USD Million
10.4. Japan Nickel Nitrate Market Statistics, 2022-2032F
10.4.1. Market Size & Growth Outlook
10.4.1.1. By Revenues in USD Million
10.4.2. Market Segmentation & Growth Outlook
10.4.2.1. By Purity Grade- Market Insights and Forecast 2022-2032, USD Million
10.4.2.2. By Application- Market Insights and Forecast 2022-2032, USD Million
10.5. South Korea Nickel Nitrate Market Statistics, 2022-2032F
10.5.1. Market Size & Growth Outlook
10.5.1.1. By Revenues in USD Million
10.5.2. Market Segmentation & Growth Outlook
10.5.2.1. By Purity Grade- Market Insights and Forecast 2022-2032, USD Million
10.5.2.2. By Application- Market Insights and Forecast 2022-2032, USD Million
10.6. India Nickel Nitrate Market Statistics, 2022-2032F
10.6.1. Market Size & Growth Outlook
10.6.1.1. By Revenues in USD Million
10.6.2. Market Segmentation & Growth Outlook
10.6.2.1. By Purity Grade- Market Insights and Forecast 2022-2032, USD Million
10.6.2.2. By Application- Market Insights and Forecast 2022-2032, USD Million
10.7. Australia Nickel Nitrate Market Statistics, 2022-2032F
10.7.1. Market Size & Growth Outlook
10.7.1.1. By Revenues in USD Million
10.7.2. Market Segmentation & Growth Outlook
10.7.2.1. By Purity Grade- Market Insights and Forecast 2022-2032, USD Million
10.7.2.2. By Application- Market Insights and Forecast 2022-2032, USD Million
10.8. Thailand Nickel Nitrate Market Statistics, 2022-2032F
10.8.1. Market Size & Growth Outlook
10.8.1.1. By Revenues in USD Million
10.8.2. Market Segmentation & Growth Outlook
10.8.2.1. By Purity Grade- Market Insights and Forecast 2022-2032, USD Million
10.8.2.2. By Application- Market Insights and Forecast 2022-2032, USD Million
11. Competitive Outlook
11.1. Company Profiles
11.1.1. Umicore
11.1.1.1. Business Description
11.1.1.2. Product Portfolio
11.1.1.3. Collaborations & Alliances
11.1.1.4. Recent Developments
11.1.1.5. Financial Details
11.1.1.6. Others
11.1.2. Todini Chemicals
11.1.2.1. Business Description
11.1.2.2. Product Portfolio
11.1.2.3. Collaborations & Alliances
11.1.2.4. Recent Developments
11.1.2.5. Financial Details
11.1.2.6. Others
11.1.3. Mitsubishi Chemical Holdings
11.1.3.1. Business Description
11.1.3.2. Product Portfolio
11.1.3.3. Collaborations & Alliances
11.1.3.4. Recent Developments
11.1.3.5. Financial Details
11.1.3.6. Others
11.1.4. BASF SE
11.1.4.1. Business Description
11.1.4.2. Product Portfolio
11.1.4.3. Collaborations & Alliances
11.1.4.4. Recent Developments
11.1.4.5. Financial Details
11.1.4.6. Others
11.1.5. Sumitomo Metal Mining
11.1.5.1. Business Description
11.1.5.2. Product Portfolio
11.1.5.3. Collaborations & Alliances
11.1.5.4. Recent Developments
11.1.5.5. Financial Details
11.1.5.6. Others
11.1.6. Tanaka Chemical
11.1.6.1. Business Description
11.1.6.2. Product Portfolio
11.1.6.3. Collaborations & Alliances
11.1.6.4. Recent Developments
11.1.6.5. Financial Details
11.1.6.6. Others
11.1.7. Resonac Holdings
11.1.7.1. Business Description
11.1.7.2. Product Portfolio
11.1.7.3. Collaborations & Alliances
11.1.7.4. Recent Developments
11.1.7.5. Financial Details
11.1.7.6. Others
11.1.8. L&F Co.
11.1.8.1. Business Description
11.1.8.2. Product Portfolio
11.1.8.3. Collaborations & Alliances
11.1.8.4. Recent Developments
11.1.8.5. Financial Details
11.1.8.6. Others
11.1.9. JFE Chemical
11.1.9.1. Business Description
11.1.9.2. Product Portfolio
11.1.9.3. Collaborations & Alliances
11.1.9.4. Recent Developments
11.1.9.5. Financial Details
11.1.9.6. Others
11.1.10. 3M
11.1.10.1.Business Description
11.1.10.2.Product Portfolio
11.1.10.3.Collaborations & Alliances
11.1.10.4.Recent Developments
11.1.10.5.Financial Details
11.1.10.6.Others
11.1.11. Honeywell
11.1.11.1.Business Description
11.1.11.2.Product Portfolio
11.1.11.3.Collaborations & Alliances
11.1.11.4.Recent Developments
11.1.11.5.Financial Details
11.1.11.6.Others
11.1.12. BAE Systems
11.1.12.1.Business Description
11.1.12.2.Product Portfolio
11.1.12.3.Collaborations & Alliances
11.1.12.4.Recent Developments
11.1.12.5.Financial Details
11.1.12.6.Others
11.1.13. Royal Ten Cate
11.1.13.1.Business Description
11.1.13.2.Product Portfolio
11.1.13.3.Collaborations & Alliances
11.1.13.4.Recent Developments
11.1.13.5.Financial Details
11.1.13.6.Others
11.1.14. Koninklijke DSM
11.1.14.1.Business Description
11.1.14.2.Product Portfolio
11.1.14.3.Collaborations & Alliances
11.1.14.4.Recent Developments
11.1.14.5.Financial Details
11.1.14.6.Others
11.1.15. Dow Chemical
11.1.15.1.Business Description
11.1.15.2.Product Portfolio
11.1.15.3.Collaborations & Alliances
11.1.15.4.Recent Developments
11.1.15.5.Financial Details
11.1.15.6.Others
12. Disclaimer
| Segment | Sub-Segment |
|---|---|
| By Purity Grade |
|
| By Application |
|
| By Region |
|
Research Methodology
This study followed a structured approach comprising four key phases to assess the size and scope of the electro-oxidation market. The process began with thorough secondary research to collect data on the target market, related markets, and broader industry context. These findings, along with preliminary assumptions and estimates, were then validated through extensive primary research involving industry experts from across the value chain. To calculate the overall market size, both top-down and bottom-up methodologies were employed. Finally, market segmentation and data triangulation techniques were applied to refine and validate segment-level estimations.
Secondary Research
The secondary research phase involved gathering data from a wide range of credible and published sources. This step helped in identifying industry trends, defining market segmentation, and understanding the market landscape and value chain.
Sources consulted during this phase included:
- Company annual reports, investor presentations, and press releases
- Industry white papers and certified publications
- Trade directories and market-recognized databases
- Articles from authoritative authors and reputable journals
- Gold and silver standard websites
Secondary research was critical in mapping out the industry's value chain and monetary flow, identifying key market segments, understanding regional variations, and tracking significant industry developments.
Other key sources:
- Financial disclosures
- Industry associations and trade bodies
- News outlets and business magazines
- Academic journals and research studies
- Paid industry databases
Primary Research
To validate secondary data and gain deeper market insights, primary research was conducted with key stakeholders across both the supply and demand sides of the market.
On the demand side, participants included decision-makers and influencers from end-user industries—such as CIOs, CTOs, and CSOs—who provided first-hand perspectives on market needs, product usage, and future expectations.
On the supply side, interviews were conducted with manufacturers, industry associations, and institutional participants to gather insights into current offerings, product pipelines, and market challenges.
Primary interviews provided critical inputs such as:
- Market size and revenue data
- Product and service breakdowns
- Market forecasts
- Regional and application-specific trends
Stakeholders consulted included:
- Leading OEM and solution providers
- Channel and distribution partners
- End users across various applications
- Independent consultants and industry specialists
Market Size Estimation and Data Triangulation
- Identifying Key Market Participants (Secondary Research)
- Goal: To identify the major players or companies in the target market. This typically involves using publicly available data sources such as industry reports, market research publications, and financial statements of companies.
- Tools: Reports from firms like Gartner, Forrester, Euromonitor, Statista, IBISWorld, and others. Public financial statements, news articles, and press releases from top market players.
- Extracting Earnings of Key Market Participants
- Goal: To estimate the earnings generated from the product or service being analyzed. This step helps in understanding the revenue potential of each market player in a specific geography.
- Methods: Earnings data can be gathered from:
- Publicly available financial reports (for listed companies).
- Interviews and primary data sources from professionals, such as Directors, VPs, SVPs, etc. This is especially useful for understanding more nuanced, internal data that isn't publicly disclosed.
- Annual reports and investor presentations of key players.
- Data Collation and Development of a Relevant Data Model
- Goal: To collate inputs from both primary and secondary sources into a structured, data-driven model for market estimation. This model will incorporate key market KPIs and any independent variables relevant to the market.
- Key KPIs: These could include:
- Market size, growth rate, and demand drivers.
- Industry-specific metrics like market share, average revenue per customer (ARPC), or average deal size.
- External variables, such as economic growth rates, inflation rates, or commodity prices, that could affect the market.
- Data Modeling: Based on this data, the market forecasts are developed for the next 5 years. A combination of trend analysis, scenario modeling, and statistical regression might be used to generate projections.
- Scenario Analysis
- Goal: To test different assumptions and validate how sensitive the market is to changes in key variables (e.g., market demand, regulatory changes, technological disruptions).
- Types of Scenarios:
- Base Case: Based on current assumptions and historical data.
- Best-Case Scenario: Assuming favorable market conditions, regulatory environments, and technological advancements.
- Worst-Case Scenario: Accounting for adverse factors, such as economic downturns, stricter regulations, or unexpected disruptions.


