Global Calcium Carbonate Market Report: Trends, Growth and Forecast (2026-2032)
By Product Type (Ground Calcium Carbonate, Precipitated Calcium Carbonate), By End-Use Industry (Building & Construction, Agriculture & Agronomy, Paper & Pulp, Paints & Coatings, Adhesives & Sealants, Plastics & Composites, Rubber & Elastomers, Glass & Ceramics, Pharmaceuticals, Others), By Application (Food, Beverages, Dietary Supplements, Pharmaceuticals, Manufacturing, Mining & Mineral Processing), By Region (North America, South America, Europe, Middle East & Africa, Asia Pacific) ... Read more
|
Major Players
|
Global Calcium Carbonate Market Statistics and Insights, 2026
- Market Size Statistics
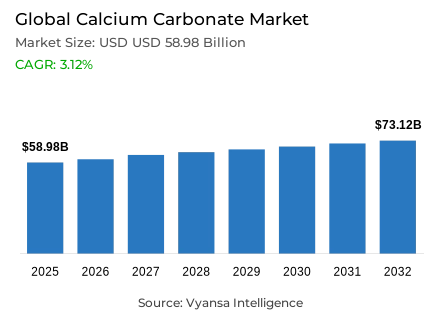
- Global calcium carbonate market is estimated at USD 58.98 billion in 2025.
- The market size is expected to grow to USD 73.12 billion by 2032.
- Market to register a CAGR of around 3.12% during 2026-32.
- Product Type Shares
- Ground calcium carbonate grabbed market share of 60%.
- Competition
- Global calcium carbonate market is currently being catered to by more than 25 companies.
- Top 5 companies acquired around 60% of the market share.
- Carmeuse Group; Graymont Limited; Sibelco; Omya AG; Imerys S.A. etc., are few of the top companies.
- End-Use Industry
- Building & construction grabbed 35% of the market.
- Region
- Asia Pacific leads with a 45% share of the global market.
Global Calcium Carbonate Market Outlook
The Global calcium carbonate market is estimated at USD 58.98 billion in 2025 and is projected to reach USD 73.12 billion in 2032, with a CAGR of about 3.12% in the period 2026-2032. This consistent growth pattern is well supported by the sustained development of infrastructure and building across the world. The World Bank Infrastructure Monitor 2024 reports that in 2023, the global investment in infrastructure by the private sector amounted to USD 380 billion, and the global construction increased by almost 5 billion square metres of floor area. Since calcium carbonate is a fundamental ingredient of lime, cement and concrete, its demand is directly correlated with the construction activity and infrastructure investment cycles.
The largest end-use sector is building and construction, which contributes approximately 35% of the total demand. The size of the sector is reflected in its contribution of 32% of the world energy demand and 34% of energy-related CO₂ emissions, highlighting the ongoing intensity of construction across regions. The necessity of calcium carbonate as a key raw material in cement manufacturing makes it non-substitutable in most construction works. Its low cost, broad availability, and structural binding characteristics guarantee uniform utilization in residential, commercial, and infrastructure projects, thus maintaining a stable base demand over the forecast period.
In terms of product type, ground calcium carbonate is the most dominant with a market share of 60%. Its leadership is motivated by its wide application in bulk construction materials and industrial applications where large volumes and cost efficiency are paramount. Although with a smaller portion, precipitated calcium carbonate serves performance-sensitive applications in paper, pharmaceuticals, and plastics, which add to the overall market value growth in addition to volume-based demand in construction.
Asia Pacific controls a 45% share of the Global calcium carbonate market. This hegemony is indicative of the rich limestone deposits, high production capacity, and high demand by infrastructure, industrial, and chemical industries. Combined extraction and processing, together with continued government-led construction activity, makes the region the major production and consumption centre by 2026-2032.

Global Calcium Carbonate Market Growth Driver
Infrastructure and Building Activity Sustaining Material Demand
The growth of the world infrastructure and construction is still supporting the demand in the Global calcium carbonate market. The World Bank Infrastructure Monitor 2024 reports that the world has increased its investment in infrastructure privately by 10% to USD 380 billion in 2023, indicating a continued capital investment in major markets. The scale of construction activity in the world is evidenced by the fact that the buildings industry contributes 34% of all energy-related CO₂ emissions and 32% of all energy consumption. In 2023 alone, the world construction sector contributed about 5 billion square metres of floor space, which supports strong cement and concrete input demand in developed and emerging economies. The main active component in the lime production, calcium carbonate, with a total of 420,000 thousand metric tons worldwide in 2024 according to the USGS, is still required to satisfy the material demands of infrastructure.
Its indispensable use in cement, concrete and construction materials directly correlates the consumption of calcium carbonate with the infrastructure investment and real-estate development cycles. The cost effectiveness and structural binding properties of the mineral justify its further application in residential, commercial, and infrastructure projects. With the growth of construction activity in the global markets, the demand of calcium carbonate is structurally consistent with the level of cement production, thus guaranteeing the market momentum over the forecast period.
Global Calcium Carbonate Market Challenge
Cost Escalation and Structural Supply Constraints
Increasing environmental and operational expenses create material limitations along calcium carbonate supply chains. The USGS Mineral Commodity Summaries 2024-2025 shows that quicklime prices have risen to USD 190 per ton in 2024, compared to USD 183.1 per ton in 2023, and hydrated lime prices have risen to USD 240 per ton in 2024, compared to USD 235 in 2023. These growths are indicative of increased energy use, environmental compliance, and labour expenses incurred in the production and calcination of lime. This cost increase has a direct effect on the price of calcium carbonate to the end users.
Market constraints are further enhanced by supply concentration. According to the USGS data, China contributed 72% of the world lime production in 2024 with 310 000 thousand metric tons, which posed regional concentration risks. The dislocation between the reserve sites and the consumption centres raises the cost of transportation and exposes the end users to disruptions in the logistics. Together with environmental pressures on mining activities in the developed markets, these factors present pricing volatility and margin pressure throughout the global calcium carbonate value chain.
Unlock Market Intelligence
Explore the market potential with our data-driven report
Global Calcium Carbonate Market Trend
Decarbonized Cement Technologies Redefining Material Use
The use of low-carbon cement technologies is transforming the use of calcium carbonate in the construction markets. In 2024, the American Council for an Energy-Efficient Economy reported that limestone-calcined clay cement can reduce CO₂ emissions by up to 40% relative to traditional Portland cement and save 25% of production costs. Further scenarios of decarbonisation show that with the integration of limestone-based formulations with renewable-powered electrification technologies, the reduction of emissions is 70-75% higher, which increases the strategic value of calcium carbonate in low-carbon construction systems.
The magnitude of impact is indicated in government procurement data. Replacing half of U.S. federal, state, and local cement with limestone-calcined clay cement would remove 7.3 million metric tons of CO₂ each year, or 1.7 million gasoline-powered vehicles off the road. These trends suggest that the use of limestone is no longer a choice but rather a growing part of the regulatory and economic systems, thus redefining the specification and processing of calcium carbonate in the construction markets of the world.
Global Calcium Carbonate Market Opportunity
High-Purity and Advanced Application Expansion
The use of calcium carbonate is growing beyond its conventional applications in construction due to advanced and specialty applications. The growing functional demand is reflected in the emerging use of nano-calcium carbonate in pharmaceutical preparations, biodegradable plastics, and novel composite materials. The high-purity calcium carbonate forms are used in industries that are sustainability-oriented such as medical equipment, food additives, and environmental cleanup technologies, where regulatory compliance and material performance standards are high.
These applications are lower volumes than construction-grade material, but they show higher growth rates and greater margin potential. Surface-modified and nano-scale calcium carbonate innovation allows improving the performance of automotive composites, packaging materials, and pharmaceutical delivery systems. These trends make high-tech calcium carbonate a strategic resource that can be used to facilitate the implementation of a circular economy and sustainability-driven manufacturing directions.
Global Calcium Carbonate Market Regional Analysis

By Region
- North America
- South America
- Europe
- Middle East & Africa
- Asia Pacific
Asia Pacific holds approximately 45% share of the Global calcium carbonate market, establishing itself as the largest regional producer and consumer. This dominance reflects abundant limestone reserves, cost-competitive manufacturing infrastructure, and strong demand from construction, packaging, industrial, and chemical sectors across major economies. Government-led infrastructure investment and urbanization initiatives across the region continue to support robust calcium carbonate consumption.
The region benefits from integrated limestone extraction and processing operations, enabling efficient supply chains serving both domestic and export markets. Proximity to high-growth end users, combined with established manufacturing capacity, reinforces Asia-Pacific’s leadership position. These structural advantages support the region’s continued role as the central hub for global calcium carbonate production and consumption through the 2026-2032 forecast period.
Unlock Market Intelligence
Explore the market potential with our data-driven report
Global Calcium Carbonate Market Segmentation Analysis
By Product Type
- Ground Calcium Carbonate
- Precipitated Calcium Carbonate
Ground calcium carbonate accounts for approximately 60% of the Global calcium carbonate market, establishing it as the dominant product type. Its leadership reflects extensive use in cement production, construction aggregate blending, and bulk industrial applications where cost efficiency and consistent supply are critical. Ground calcium carbonate benefits from abundant availability, straightforward grinding processes, and widespread acceptance across construction standards supporting infrastructure and housing development.
Precipitated calcium carbonate represents the remaining 40% market share, serving applications requiring controlled particle size and higher purity, including paper coating, pharmaceutical formulations, and high-performance plastics. While ground calcium carbonate drives overall market volume, precipitated calcium carbonate supports performance-critical applications commanding premium pricing. Together, these product types define the market’s balance between volume-driven and specification-driven demand.

By End-Use Industry
- Building & Construction
- Agriculture & Agronomy
- Paper & Pulp
- Paints & Coatings
- Adhesives & Sealants
- Plastics & Composites
- Rubber & Elastomers
- Glass & Ceramics
- Pharmaceuticals
- Others
Building and construction accounts for approximately 35% of global calcium carbonate end-use demand, positioning it as the leading application sector. Calcium carbonate is fundamental to Portland cement production, where limestone calcination generates calcium oxide inputs essential to all cement formulations. Demand within this sector directly reflects infrastructure investment levels, urbanization trends, and commercial construction activity. The addition of approximately 5 billion square meters of global floor area in 2023 underscores the sector’s sustained material intensity.
Secondary end-use industries, including paper and pulp, chemical processing, pharmaceutical manufacturing, plastics production, and water treatment, collectively account for the remaining 65% of consumption. Despite this diversity, construction maintains dominance due to its scale and non-substitutable material requirements. This structural reliance ensures consistent baseline demand for calcium carbonate as infrastructure expansion and decarbonization-aligned construction standards advance globally.
Market Players in Global Calcium Carbonate Market
These market players maintain a significant presence in the Global calcium carbonate market sector and contribute to its ongoing evolution.
- Carmeuse Group
- Graymont Limited
- Sibelco
- Omya AG
- Imerys S.A.
- Minerals Technologies Inc.
- Huber Engineered Materials (J.M. Huber Corporation)
- Mississippi Lime Company
- Nordkalk Corporation
- Calcinor SA
- GLC Minerals LLC
- Excalibar Minerals LLC
- Gulshan Polyols Ltd.
- Maruo Calcium Co. Ltd.
- Provencale SA
Market News & Updates
- MIDROC Investment Group, 2025:
MIDROC Investment Group inaugurated Ethiopia’s first coated calcium carbonate production plant in Awash 7 Kilo, Afar Region, marking a significant step in the country’s industrial materials ecosystem. The facility is designed to manufacture coated calcium carbonate for applications across plastics, water pipes, pharmaceuticals, shoe soles, sponges, and cable products. By localising production of a key industrial input, the project is expected to reduce import dependence, support downstream manufacturing, and contribute to Ethiopia’s broader industrial development and value-addition objectives.
- CarbonFree, 2025:
CarbonFree began construction of a carbon-capture system at U.S. Steel’s Gary, Indiana facility to produce carbon-neutral calcium carbonate from steel plant CO₂ emissions. Using its SkyCycle™ process, the system converts flue gas into high-purity CaCO₃ through reactions involving magnesium hydroxide and calcium-containing slag. This initiative positions calcium carbonate as a circular, low-carbon material suitable for paints, coatings, adhesives, plastics, and food applications, while also supporting industrial decarbonisation goals.
Frequently Asked Questions
Related Report
1. Market Segmentation
1.1. Research Scope
1.2. Research Methodology
1.3. Definitions and Assumptions
2. Executive Summary
3. Global Calcium Carbonate Market Policies, Regulations, and Standards
4. Global Calcium Carbonate Market Dynamics
4.1. Growth Factors
4.2. Challenges
4.3. Trends
4.4. Opportunities
5. Global Calcium Carbonate Market Statistics, 2022-2032F
5.1. Market Size & Growth Outlook
5.1.1.By Revenues in USD Million
5.1.2.By Volume (Thousand Tons)
5.2. Market Segmentation & Growth Outlook
5.2.1.By Product Type
5.2.1.1. Ground Calcium Carbonate- Market Insights and Forecast 2022-2032, USD Million
5.2.1.2. Precipitated Calcium Carbonate- Market Insights and Forecast 2022-2032, USD Million
5.2.2.By End-Use Industry
5.2.2.1. Building & Construction- Market Insights and Forecast 2022-2032, USD Million
5.2.2.2. Agriculture & Agronomy- Market Insights and Forecast 2022-2032, USD Million
5.2.2.3. Paper & Pulp- Market Insights and Forecast 2022-2032, USD Million
5.2.2.4. Paints & Coatings- Market Insights and Forecast 2022-2032, USD Million
5.2.2.5. Adhesives & Sealants- Market Insights and Forecast 2022-2032, USD Million
5.2.2.6. Plastics & Composites- Market Insights and Forecast 2022-2032, USD Million
5.2.2.7. Rubber & Elastomers- Market Insights and Forecast 2022-2032, USD Million
5.2.2.8. Glass & Ceramics- Market Insights and Forecast 2022-2032, USD Million
5.2.2.9. Pharmaceuticals- Market Insights and Forecast 2022-2032, USD Million
5.2.2.10. Others- Market Insights and Forecast 2022-2032, USD Million
5.2.3.By Application
5.2.3.1. Food- Market Insights and Forecast 2022-2032, USD Million
5.2.3.2. Beverages- Market Insights and Forecast 2022-2032, USD Million
5.2.3.3. Dietary Supplements- Market Insights and Forecast 2022-2032, USD Million
5.2.3.4. Pharmaceuticals- Market Insights and Forecast 2022-2032, USD Million
5.2.3.5. Manufacturing- Market Insights and Forecast 2022-2032, USD Million
5.2.3.6. Mining & Mineral Processing- Market Insights and Forecast 2022-2032, USD Million
5.2.4.By Region
5.2.4.1. North America
5.2.4.2. South America
5.2.4.3. Europe
5.2.4.4. Middle East & Africa
5.2.4.5. Asia Pacific
5.2.5.By Competitors
5.2.5.1. Competition Characteristics
5.2.5.2. Market Share & Analysis
6. North America Calcium Carbonate Market Statistics, 2022-2032F
6.1. Market Size & Growth Outlook
6.1.1.By Revenues in USD Million
6.1.2.By Volume (Thousand Tons)
6.2. Market Segmentation & Growth Outlook
6.2.1.By Product Type- Market Insights and Forecast 2022-2032, USD Million
6.2.2.By End-Use Industry- Market Insights and Forecast 2022-2032, USD Million
6.2.3.By Application- Market Insights and Forecast 2022-2032, USD Million
6.2.4.By Country
6.2.4.1. US
6.2.4.2. Canada
6.2.4.3. Mexico
6.2.4.4. Rest of North America
6.3. US Calcium Carbonate Market Statistics, 2022-2032F
6.3.1.Market Size & Growth Outlook
6.3.1.1. By Revenues in USD Million
6.3.1.2. By Volume (Thousand Tons)
6.3.2.Market Segmentation & Growth Outlook
6.3.2.1. By Product Type- Market Insights and Forecast 2022-2032, USD Million
6.3.2.2. By End-Use Industry- Market Insights and Forecast 2022-2032, USD Million
6.3.2.3. By Application- Market Insights and Forecast 2022-2032, USD Million
6.4. Canada Calcium Carbonate Market Statistics, 2022-2032F
6.4.1.Market Size & Growth Outlook
6.4.1.1. By Revenues in USD Million
6.4.1.2. By Volume (Thousand Tons)
6.4.2.Market Segmentation & Growth Outlook
6.4.2.1. By Product Type- Market Insights and Forecast 2022-2032, USD Million
6.4.2.2. By End-Use Industry- Market Insights and Forecast 2022-2032, USD Million
6.4.2.3. By Application- Market Insights and Forecast 2022-2032, USD Million
6.5. Mexico Calcium Carbonate Market Statistics, 2022-2032F
6.5.1.Market Size & Growth Outlook
6.5.1.1. By Revenues in USD Million
6.5.1.2. By Volume (Thousand Tons)
6.5.2.Market Segmentation & Growth Outlook
6.5.2.1. By Product Type- Market Insights and Forecast 2022-2032, USD Million
6.5.2.2. By End-Use Industry- Market Insights and Forecast 2022-2032, USD Million
6.5.2.3. By Application- Market Insights and Forecast 2022-2032, USD Million
7. South America Calcium Carbonate Market Statistics, 2022-2032F
7.1. Market Size & Growth Outlook
7.1.1.By Revenues in USD Million
7.1.2.By Volume (Thousand Tons)
7.2. Market Segmentation & Growth Outlook
7.2.1.By Product Type- Market Insights and Forecast 2022-2032, USD Million
7.2.2.By End-Use Industry- Market Insights and Forecast 2022-2032, USD Million
7.2.3.By Application- Market Insights and Forecast 2022-2032, USD Million
7.2.4.By Country
7.2.4.1. Brazil
7.2.4.2. Argentina
7.2.4.3. Rest of South America
7.3. Brazil Calcium Carbonate Market Statistics, 2022-2032F
7.3.1.Market Size & Growth Outlook
7.3.1.1. By Revenues in USD Million
7.3.1.2. By Volume (Thousand Tons)
7.3.2.Market Segmentation & Growth Outlook
7.3.2.1. By Product Type- Market Insights and Forecast 2022-2032, USD Million
7.3.2.2. By End-Use Industry- Market Insights and Forecast 2022-2032, USD Million
7.3.2.3. By Application- Market Insights and Forecast 2022-2032, USD Million
7.4. Argentina Calcium Carbonate Market Statistics, 2022-2032F
7.4.1.Market Size & Growth Outlook
7.4.1.1. By Revenues in USD Million
7.4.1.2. By Volume (Thousand Tons)
7.4.2.Market Segmentation & Growth Outlook
7.4.2.1. By Product Type- Market Insights and Forecast 2022-2032, USD Million
7.4.2.2. By End-Use Industry- Market Insights and Forecast 2022-2032, USD Million
7.4.2.3. By Application- Market Insights and Forecast 2022-2032, USD Million
8. Europe Calcium Carbonate Market Statistics, 2022-2032F
8.1. Market Size & Growth Outlook
8.1.1.By Revenues in USD Million
8.1.2.By Volume (Thousand Tons)
8.2. Market Segmentation & Growth Outlook
8.2.1.By Product Type- Market Insights and Forecast 2022-2032, USD Million
8.2.2.By End-Use Industry- Market Insights and Forecast 2022-2032, USD Million
8.2.3.By Application- Market Insights and Forecast 2022-2032, USD Million
8.2.4.By Country
8.2.4.1. UK
8.2.4.2. Germany
8.2.4.3. France
8.2.4.4. Italy
8.2.4.5. Spain
8.2.4.6. Rest of Europe
8.3. UK Calcium Carbonate Market Statistics, 2022-2032F
8.3.1.Market Size & Growth Outlook
8.3.1.1. By Revenues in USD Million
8.3.1.2. By Volume (Thousand Tons)
8.3.2.Market Segmentation & Growth Outlook
8.3.2.1. By Product Type- Market Insights and Forecast 2022-2032, USD Million
8.3.2.2. By End-Use Industry- Market Insights and Forecast 2022-2032, USD Million
8.3.2.3. By Application- Market Insights and Forecast 2022-2032, USD Million
8.4. Germany Calcium Carbonate Market Statistics, 2022-2032F
8.4.1.Market Size & Growth Outlook
8.4.1.1. By Revenues in USD Million
8.4.1.2. By Volume (Thousand Tons)
8.4.2.Market Segmentation & Growth Outlook
8.4.2.1. By Product Type- Market Insights and Forecast 2022-2032, USD Million
8.4.2.2. By End-Use Industry- Market Insights and Forecast 2022-2032, USD Million
8.4.2.3. By Application- Market Insights and Forecast 2022-2032, USD Million
8.5. France Calcium Carbonate Market Statistics, 2022-2032F
8.5.1.Market Size & Growth Outlook
8.5.1.1. By Revenues in USD Million
8.5.1.2. By Volume (Thousand Tons)
8.5.2.Market Segmentation & Growth Outlook
8.5.2.1. By Product Type- Market Insights and Forecast 2022-2032, USD Million
8.5.2.2. By End-Use Industry- Market Insights and Forecast 2022-2032, USD Million
8.5.2.3. By Application- Market Insights and Forecast 2022-2032, USD Million
8.6. Italy Calcium Carbonate Market Statistics, 2022-2032F
8.6.1.Market Size & Growth Outlook
8.6.1.1. By Revenues in USD Million
8.6.1.2. By Volume (Thousand Tons)
8.6.2.Market Segmentation & Growth Outlook
8.6.2.1. By Product Type- Market Insights and Forecast 2022-2032, USD Million
8.6.2.2. By End-Use Industry- Market Insights and Forecast 2022-2032, USD Million
8.6.2.3. By Application- Market Insights and Forecast 2022-2032, USD Million
8.7. Spain Calcium Carbonate Market Statistics, 2022-2032F
8.7.1.Market Size & Growth Outlook
8.7.1.1. By Revenues in USD Million
8.7.1.2. By Volume (Thousand Tons)
8.7.2.Market Segmentation & Growth Outlook
8.7.2.1. By Product Type- Market Insights and Forecast 2022-2032, USD Million
8.7.2.2. By End-Use Industry- Market Insights and Forecast 2022-2032, USD Million
8.7.2.3. By Application- Market Insights and Forecast 2022-2032, USD Million
9. Middle East & Africa Calcium Carbonate Market Statistics, 2022-2032F
9.1. Market Size & Growth Outlook
9.1.1.By Revenues in USD Million
9.1.2.By Volume (Thousand Tons)
9.2. Market Segmentation & Growth Outlook
9.2.1.By Product Type- Market Insights and Forecast 2022-2032, USD Million
9.2.2.By End-Use Industry- Market Insights and Forecast 2022-2032, USD Million
9.2.3.By Application- Market Insights and Forecast 2022-2032, USD Million
9.2.4.By Country
9.2.4.1. Saudi Arabia
9.2.4.2. UAE
9.2.4.3. South Africa
9.2.4.4. Rest of Middle East & Africa
9.3. Saudi Arabia Calcium Carbonate Market Statistics, 2022-2032F
9.3.1.Market Size & Growth Outlook
9.3.1.1. By Revenues in USD Million
9.3.1.2. By Volume (Thousand Tons)
9.3.2.Market Segmentation & Growth Outlook
9.3.2.1. By Product Type- Market Insights and Forecast 2022-2032, USD Million
9.3.2.2. By End-Use Industry- Market Insights and Forecast 2022-2032, USD Million
9.3.2.3. By Application- Market Insights and Forecast 2022-2032, USD Million
9.4. UAE Calcium Carbonate Market Statistics, 2022-2032F
9.4.1.Market Size & Growth Outlook
9.4.1.1. By Revenues in USD Million
9.4.1.2. By Volume (Thousand Tons)
9.4.2.Market Segmentation & Growth Outlook
9.4.2.1. By Product Type- Market Insights and Forecast 2022-2032, USD Million
9.4.2.2. By End-Use Industry- Market Insights and Forecast 2022-2032, USD Million
9.4.2.3. By Application- Market Insights and Forecast 2022-2032, USD Million
9.5. South Africa Calcium Carbonate Market Statistics, 2022-2032F
9.5.1.Market Size & Growth Outlook
9.5.1.1. By Revenues in USD Million
9.5.1.2. By Volume (Thousand Tons)
9.5.2.Market Segmentation & Growth Outlook
9.5.2.1. By Product Type- Market Insights and Forecast 2022-2032, USD Million
9.5.2.2. By End-Use Industry- Market Insights and Forecast 2022-2032, USD Million
9.5.2.3. By Application- Market Insights and Forecast 2022-2032, USD Million
10. Asia Pacific Calcium Carbonate Market Statistics, 2022-2032F
10.1. Market Size & Growth Outlook
10.1.1. By Revenues in USD Million
10.1.2. By Volume (Thousand Tons)
10.2. Market Segmentation & Growth Outlook
10.2.1. By Product Type- Market Insights and Forecast 2022-2032, USD Million
10.2.2. By End-Use Industry- Market Insights and Forecast 2022-2032, USD Million
10.2.3. By Application- Market Insights and Forecast 2022-2032, USD Million
10.2.4. By Country
10.2.4.1. China
10.2.4.2. Japan
10.2.4.3. South Korea
10.2.4.4. India
10.2.4.5. Australia
10.2.4.6. Rest of Asia Pacific
10.3. China Calcium Carbonate Market Statistics, 2022-2032F
10.3.1. Market Size & Growth Outlook
10.3.1.1. By Revenues in USD Million
10.3.1.2. By Volume (Thousand Tons)
10.3.2. Market Segmentation & Growth Outlook
10.3.2.1. By Product Type- Market Insights and Forecast 2022-2032, USD Million
10.3.2.2. By End-Use Industry- Market Insights and Forecast 2022-2032, USD Million
10.3.2.3. By Application- Market Insights and Forecast 2022-2032, USD Million
10.4. Japan Calcium Carbonate Market Statistics, 2022-2032F
10.4.1. Market Size & Growth Outlook
10.4.1.1. By Revenues in USD Million
10.4.1.2. By Volume (Thousand Tons)
10.4.2. Market Segmentation & Growth Outlook
10.4.2.1. By Product Type- Market Insights and Forecast 2022-2032, USD Million
10.4.2.2. By End-Use Industry- Market Insights and Forecast 2022-2032, USD Million
10.4.2.3. By Application- Market Insights and Forecast 2022-2032, USD Million
10.5. South Korea Calcium Carbonate Market Statistics, 2022-2032F
10.5.1. Market Size & Growth Outlook
10.5.1.1. By Revenues in USD Million
10.5.1.2. By Volume (Thousand Tons)
10.5.2. Market Segmentation & Growth Outlook
10.5.2.1. By Product Type- Market Insights and Forecast 2022-2032, USD Million
10.5.2.2. By End-Use Industry- Market Insights and Forecast 2022-2032, USD Million
10.5.2.3. By Application- Market Insights and Forecast 2022-2032, USD Million
10.6. India Calcium Carbonate Market Statistics, 2022-2032F
10.6.1. Market Size & Growth Outlook
10.6.1.1. By Revenues in USD Million
10.6.1.2. By Volume (Thousand Tons)
10.6.2. Market Segmentation & Growth Outlook
10.6.2.1. By Product Type- Market Insights and Forecast 2022-2032, USD Million
10.6.2.2. By End-Use Industry- Market Insights and Forecast 2022-2032, USD Million
10.6.2.3. By Application- Market Insights and Forecast 2022-2032, USD Million
10.7. Australia Calcium Carbonate Market Statistics, 2022-2032F
10.7.1. Market Size & Growth Outlook
10.7.1.1. By Revenues in USD Million
10.7.1.2. By Volume (Thousand Tons)
10.7.2. Market Segmentation & Growth Outlook
10.7.2.1. By Product Type- Market Insights and Forecast 2022-2032, USD Million
10.7.2.2. By End-Use Industry- Market Insights and Forecast 2022-2032, USD Million
10.7.2.3. By Application- Market Insights and Forecast 2022-2032, USD Million
11. Competitive Outlook
11.1. Company Profiles
11.1.1. Omya AG
11.1.1.1. Business Description
11.1.1.2. Product Portfolio
11.1.1.3. Collaborations & Alliances
11.1.1.4. Recent Developments
11.1.1.5. Financial Details
11.1.1.6. Others
11.1.2. Imerys S.A.
11.1.2.1. Business Description
11.1.2.2. Product Portfolio
11.1.2.3. Collaborations & Alliances
11.1.2.4. Recent Developments
11.1.2.5. Financial Details
11.1.2.6. Others
11.1.3. Minerals Technologies Inc.
11.1.3.1. Business Description
11.1.3.2. Product Portfolio
11.1.3.3. Collaborations & Alliances
11.1.3.4. Recent Developments
11.1.3.5. Financial Details
11.1.3.6. Others
11.1.4. Huber Engineered Materials (J.M. Huber Corporation)
11.1.4.1. Business Description
11.1.4.2. Product Portfolio
11.1.4.3. Collaborations & Alliances
11.1.4.4. Recent Developments
11.1.4.5. Financial Details
11.1.4.6. Others
11.1.5. Mississippi Lime Company
11.1.5.1. Business Description
11.1.5.2. Product Portfolio
11.1.5.3. Collaborations & Alliances
11.1.5.4. Recent Developments
11.1.5.5. Financial Details
11.1.5.6. Others
11.1.6. Carmeuse Group
11.1.6.1. Business Description
11.1.6.2. Product Portfolio
11.1.6.3. Collaborations & Alliances
11.1.6.4. Recent Developments
11.1.6.5. Financial Details
11.1.6.6. Others
11.1.7. Graymont Limited
11.1.7.1. Business Description
11.1.7.2. Product Portfolio
11.1.7.3. Collaborations & Alliances
11.1.7.4. Recent Developments
11.1.7.5. Financial Details
11.1.7.6. Others
11.1.8. Sibelco
11.1.8.1. Business Description
11.1.8.2. Product Portfolio
11.1.8.3. Collaborations & Alliances
11.1.8.4. Recent Developments
11.1.8.5. Financial Details
11.1.8.6. Others
11.1.9. Nordkalk Corporation
11.1.9.1. Business Description
11.1.9.2. Product Portfolio
11.1.9.3. Collaborations & Alliances
11.1.9.4. Recent Developments
11.1.9.5. Financial Details
11.1.9.6. Others
11.1.10. Calcinor SA
11.1.10.1.Business Description
11.1.10.2.Product Portfolio
11.1.10.3.Collaborations & Alliances
11.1.10.4.Recent Developments
11.1.10.5.Financial Details
11.1.10.6.Others
11.1.11. GLC Minerals LLC
11.1.11.1.Business Description
11.1.11.2.Product Portfolio
11.1.11.3.Collaborations & Alliances
11.1.11.4.Recent Developments
11.1.11.5.Financial Details
11.1.11.6.Others
11.1.12. Excalibar Minerals LLC
11.1.12.1.Business Description
11.1.12.2.Product Portfolio
11.1.12.3.Collaborations & Alliances
11.1.12.4.Recent Developments
11.1.12.5.Financial Details
11.1.12.6.Others
11.1.13. Gulshan Polyols Ltd.
11.1.13.1.Business Description
11.1.13.2.Product Portfolio
11.1.13.3.Collaborations & Alliances
11.1.13.4.Recent Developments
11.1.13.5.Financial Details
11.1.13.6.Others
11.1.14. Maruo Calcium Co. Ltd.
11.1.14.1.Business Description
11.1.14.2.Product Portfolio
11.1.14.3.Collaborations & Alliances
11.1.14.4.Recent Developments
11.1.14.5.Financial Details
11.1.14.6.Others
11.1.15. Provencale SA
11.1.15.1.Business Description
11.1.15.2.Product Portfolio
11.1.15.3.Collaborations & Alliances
11.1.15.4.Recent Developments
11.1.15.5.Financial Details
11.1.15.6.Others
12. Disclaimer
| Segment | Sub-Segment |
|---|---|
| By Product Type |
|
| By End-Use Industry |
|
| By Application |
|
| By Region |
|
Research Methodology
This study followed a structured approach comprising four key phases to assess the size and scope of the electro-oxidation market. The process began with thorough secondary research to collect data on the target market, related markets, and broader industry context. These findings, along with preliminary assumptions and estimates, were then validated through extensive primary research involving industry experts from across the value chain. To calculate the overall market size, both top-down and bottom-up methodologies were employed. Finally, market segmentation and data triangulation techniques were applied to refine and validate segment-level estimations.
Secondary Research
The secondary research phase involved gathering data from a wide range of credible and published sources. This step helped in identifying industry trends, defining market segmentation, and understanding the market landscape and value chain.
Sources consulted during this phase included:
- Company annual reports, investor presentations, and press releases
- Industry white papers and certified publications
- Trade directories and market-recognized databases
- Articles from authoritative authors and reputable journals
- Gold and silver standard websites
Secondary research was critical in mapping out the industry's value chain and monetary flow, identifying key market segments, understanding regional variations, and tracking significant industry developments.
Other key sources:
- Financial disclosures
- Industry associations and trade bodies
- News outlets and business magazines
- Academic journals and research studies
- Paid industry databases
Primary Research
To validate secondary data and gain deeper market insights, primary research was conducted with key stakeholders across both the supply and demand sides of the market.
On the demand side, participants included decision-makers and influencers from end-user industries—such as CIOs, CTOs, and CSOs—who provided first-hand perspectives on market needs, product usage, and future expectations.
On the supply side, interviews were conducted with manufacturers, industry associations, and institutional participants to gather insights into current offerings, product pipelines, and market challenges.
Primary interviews provided critical inputs such as:
- Market size and revenue data
- Product and service breakdowns
- Market forecasts
- Regional and application-specific trends
Stakeholders consulted included:
- Leading OEM and solution providers
- Channel and distribution partners
- End users across various applications
- Independent consultants and industry specialists
Market Size Estimation and Data Triangulation
- Identifying Key Market Participants (Secondary Research)
- Goal: To identify the major players or companies in the target market. This typically involves using publicly available data sources such as industry reports, market research publications, and financial statements of companies.
- Tools: Reports from firms like Gartner, Forrester, Euromonitor, Statista, IBISWorld, and others. Public financial statements, news articles, and press releases from top market players.
- Extracting Earnings of Key Market Participants
- Goal: To estimate the earnings generated from the product or service being analyzed. This step helps in understanding the revenue potential of each market player in a specific geography.
- Methods: Earnings data can be gathered from:
- Publicly available financial reports (for listed companies).
- Interviews and primary data sources from professionals, such as Directors, VPs, SVPs, etc. This is especially useful for understanding more nuanced, internal data that isn't publicly disclosed.
- Annual reports and investor presentations of key players.
- Data Collation and Development of a Relevant Data Model
- Goal: To collate inputs from both primary and secondary sources into a structured, data-driven model for market estimation. This model will incorporate key market KPIs and any independent variables relevant to the market.
- Key KPIs: These could include:
- Market size, growth rate, and demand drivers.
- Industry-specific metrics like market share, average revenue per customer (ARPC), or average deal size.
- External variables, such as economic growth rates, inflation rates, or commodity prices, that could affect the market.
- Data Modeling: Based on this data, the market forecasts are developed for the next 5 years. A combination of trend analysis, scenario modeling, and statistical regression might be used to generate projections.
- Scenario Analysis
- Goal: To test different assumptions and validate how sensitive the market is to changes in key variables (e.g., market demand, regulatory changes, technological disruptions).
- Types of Scenarios:
- Base Case: Based on current assumptions and historical data.
- Best-Case Scenario: Assuming favorable market conditions, regulatory environments, and technological advancements.
- Worst-Case Scenario: Accounting for adverse factors, such as economic downturns, stricter regulations, or unexpected disruptions.


