Paraguay Alcoholic Drinks Market Report: Trends, Growth and Forecast (2026-2032)
By Type (Beer, Cider/Perry, RTDs, Spirits, Wine), By Alcohol Content (High, Medium, Low), By Flavor (Unflavored, Flavored), By Packaging Type (Glass Bottles, Tins, Plastic Bottles, Others), By Sales Channel (On-Trade, Off-Trade (Retail Offline, Retail Online)) ... Read more

|
Major Players
|
Paraguay Alcoholic Drinks Market Statistics and Insights, 2026
- Market Size Statistics
- Alcoholic Drinks in Paraguay is estimated at $ 1.91 Billion.
- The market size is expected to grow to $ 2.29 Billion by 2032.
- Market to register a CAGR of around 2.63% during 2026-32.
- Type Shares
- Beer grabbed market share of 60%.
- Beer to witness a volume CAGR of around 1.67%.
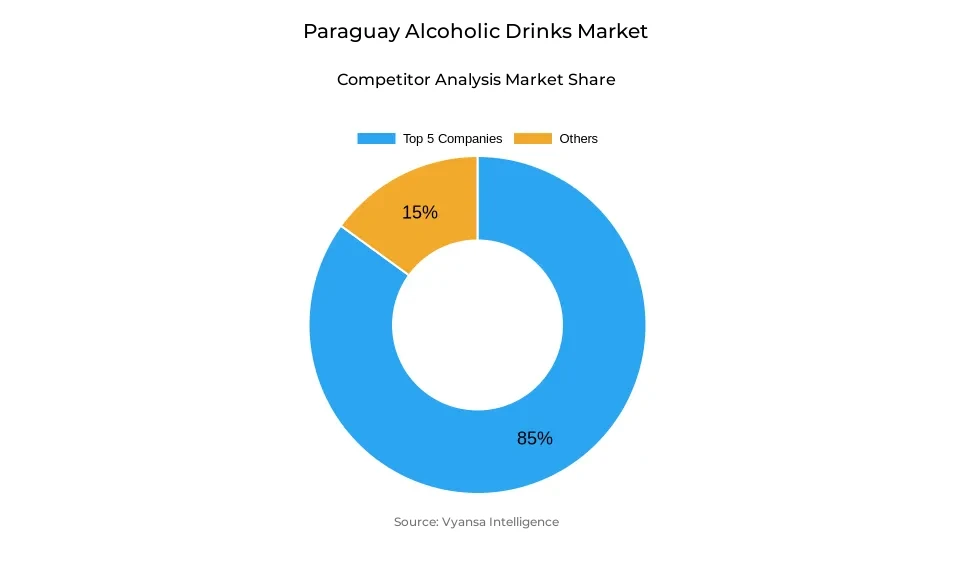
- Competition
- More than 10 companies are actively engaged in producing Alcoholic Drinks in Paraguay.
- Top 5 companies acquired 85% of the market share.
- CIA Compañía Embotelladora Tres Leones, Ovinto SA, Diageo Plc, Anheuser-Busch InBev NV, Grupo Riquelme etc., are few of the top companies.
- Sales Channel
- Off-Trade grabbed 55% of the market.
Paraguay Alcoholic Drinks Market Outlook
Paraguay Alcoholic Drinks Market are anticipated to increase steadily during the forecast period. The market, worth $1.91 billion in 2025, is estimated to become $2.29 billion by 2032. Stable economic conditions, increasing household income, and a growing middle class will drive growth. The biggest category, beer, is estimated to experience a volume CAGR of approximately 1.67%, led by both local and foreign brands. Lighter Pilsen beers will persist to be the leaders, with craft and premium beer varieties expected to become popular with younger end users looking for more refined and varied options.
Off-trade channels, now representing 55% of the market, will remain the preponderant route for distribution. Supermarkets, hypermarkets, small neighborhood grocery stores, and convenience chain stores like Biggie will grow in coverage, supplying a wide range of products that adapt to evolving lifestyles. Retail e-commerce will also develop in a big way, especially in cities, as increasingly end users, including older end users, start buying alcoholic drinks online.
Ready-to-Drink (RTD) drinks, and spirits like bitters, vodka, and tequila, will be dynamic categories that will benefit from changing end user preferences and increased popularity of homemade cocktails. Non-alcoholic and low-strength versions will also keep on gaining significance as there is a move towards healthier living and sensible drinking habits, particularly among the youth.
Product development and packaging innovation will continue to define the market. Economies of scale and marketing appeal will lead firms to launch sustainable, recyclable packs and smaller premium variants, targeting end users that value product quality over quantity. Overall, Paraguay's Alcoholic Drinks market is poised for steady expansion with a boost from economic stability, changing consumption patterns, and widening retail channels.
Paraguay Alcoholic Drinks Market Growth Driver
Economic stability and increasing disposable income
Strong economic stability in Paraguay is boosting household spending and increasing disposable incomes, fueling growth in alcoholic drinks consumption. Stable GDP growth and managed inflation urge end users to spend more on alcoholic drinks, especially in major categories such as beer and wine. Investment in the market also finds a pleasing economic climate, allowing businesses to increase output and launch new products that respond to changing end user tastes.
Beer continues to be the most consumed category, with lighter Pilsen-style and lower-alcohol versions gaining mainstream support. Both domestic production and imports contribute to growth in the market, enabling more brands and ranges to find their way into end user hands. Such a blend of economic resilience and diversified markets drives overall market performance and fosters a favorable environment to ensure growth over the long term.
Paraguay Alcoholic Drinks Market Challenge
Cross-border and private imports that are illegal
The market is confronted with a major threat from illegal cross-border and private imports, especially from border nations. Lower quality and lower-priced perception of imported wines and spirits make them attractive alternatives for end users outside legal channels. Weak enforcement of border control enables repeat private imports that undermine local sales and affect revenue for home-based manufacturers.
Changing currency rates in bordering nations also affect the movement of illicit products. With weaker foreign currencies, illegal alcohol rises, bringing uncertainty for local businesses. The issue impacts the market structure as a whole, forcing participants to come up with methods to battle less expensive and conveniently available illicit substitutes while retaining customer loyalty to lawfully produced brands.
Unlock Market Intelligence
Explore the market potential with our data-driven report
Paraguay Alcoholic Drinks Market Trend
Move towards healthier and lower-strength variants
End userss are increasingly opting for lower-alcohol and healthier beverages, reflecting shifting preferences in the alcoholic drinks segment. End users, especially younger ages, more and more tend to have non-alcoholic and low-alcohol beverages such as Munich Ultra, Stella Artois 0.0, and Corona 0.0, which respond to lifestyle transformation and restraint drinking attitudes.
The market also experiences innovation within product formats and recipes like gluten-free beer and lower-calorie beverages. The trend is driven by increased awareness of health and wellness, as well as the need to partake in social drinking activity without drinking alcohol. The trend towards healthier options informs product development and leads to companies broadening their portfolios to accommodate changing end user tastes.
Paraguay Alcoholic Drinks Market Opportunity
Development of Craft and Premium Beer
The Paraguay Alcoholic Drinks Market offers a chance for the development of craft and premium beer. Growing demand for artisanal making and quality inputs provides an opportunity for companies to introduce small-batch, gourmet product, which end users are willing to pay more for premium offerings.
Younger end users exhibit strong affinity toward craft beers and bitters of distinctive flavors, presenting opportunities for local businesses to innovate and differentiate their products. During the forecast period, this segment will expand, driving total market growth. Businesses can capitalize on it by marketing new flavors, limited production runs, and eco-friendly packaging to appeal to quality-conscious customers and build brand loyalty.
Unlock Market Intelligence
Explore the market potential with our data-driven report
Paraguay Alcoholic Drinks Market Segmentation Analysis

By Type
- Beer
- Cider/Perry
- RTDs
- Spirits
- Wine
The segment with highest market share under Type segment is held by the beer, which makes up 60% of the Paraguay Alcoholic Drinks market. Beer remains unrivaled because of its widespread demand, affordability, and multitude, especially lighter Pilsen beers, whose demand cuts across a wide spectrum of clients. Both national and imported beer labels have deepened their presence by launching new offerings, including Michelob Ultra, Munich Ultra, and Munich Ultra gluten-free, in addition to upscale imported options such as Cerveza Imperio.
During the forecast period, beer will see a volume CAGR of approximately 1.67% backed by constant innovation, craft beer, and health-related offerings like non-alcoholic beer. Young end users, particularly Generation Z, are placing pressure on low-alcohol and low-calorie offerings, whereas conventional beer continues to be a routine consumption staple, providing consistent growth in the market.
By Sales Channel
- On-Trade
- Off-Trade
The segment with highest market share under Sales Channel is off-trade, accounting for 55% of the Paraguay Alcoholic Drinks market. Off-trade is still the most favored channel because of convenience, greater availability of products, and price competitiveness, especially through supermarkets, hypermarkets, and modern grocery stores. Local chains like Superseis, Cadena Real, Casa Rica, and the fast-growing Biggie chain have improved off-trade sales through appealing store formats, promotion campaigns, and longer opening hours.
During the forecasting period, off-trade will continue to drive market growth, fueled by retail e-commerce platforms and convenience store expansion. E-commerce, aided by such platforms as Mercado Libre and specialist drinks retailers, is increasingly popular among urban and younger demographics. This will be supplemented by a rising middle class and increasing incomes, further entrenching the off-trade channel's dominance in Paraguay.
Top Companies in Paraguay Alcoholic Drinks Market
The top companies operating in the market include CIA Compañía Embotelladora Tres Leones, Ovinto SA, Diageo Plc, Anheuser-Busch InBev NV, Grupo Riquelme, Grupo AJ Vierci SA, Molson Coors Brewing Co, Fortin SA, Cañas Paraguayas SA, Heineken NV, etc., are the top players operating in the Paraguay Alcoholic Drinks Market.
Frequently Asked Questions
Related Report
1. Market Segmentation
1.1. Research Scope
1.2. Research Methodology
1.3. Definitions and Assumptions
2. Executive Summary
3. Paraguay Alcoholic Drinks Market Policies, Regulations, and Standards
4. Paraguay Alcoholic Drinks Market Dynamics
4.1. Growth Factors
4.2. Challenges
4.3. Trends
4.4. Opportunities
5. Paraguay Alcoholic Drinks Market Statistics, 2022-2032F
5.1. Market Size & Growth Outlook
5.1.1. By Revenues in US$ Million
5.1.2. By Quantity Sold in Million Litres
5.2. Market Segmentation & Growth Outlook
5.2.1. By Type
5.2.1.1. Beer- Market Insights and Forecast 2022-2032, USD Million
5.2.1.2. Cider/Perry- Market Insights and Forecast 2022-2032, USD Million
5.2.1.3. RTDs- Market Insights and Forecast 2022-2032, USD Million
5.2.1.4. Spirits- Market Insights and Forecast 2022-2032, USD Million
5.2.1.5. Wine- Market Insights and Forecast 2022-2032, USD Million
5.2.2. By Alcohol Content
5.2.2.1. High- Market Insights and Forecast 2022-2032, USD Million
5.2.2.2. Medium- Market Insights and Forecast 2022-2032, USD Million
5.2.2.3. Low- Market Insights and Forecast 2022-2032, USD Million
5.2.3. By Flavor
5.2.3.1. Unflavored- Market Insights and Forecast 2022-2032, USD Million
5.2.3.2. Flavored- Market Insights and Forecast 2022-2032, USD Million
5.2.4. By Packaging Type
5.2.4.1. Glass Bottles- Market Insights and Forecast 2022-2032, USD Million
5.2.4.2. Tins- Market Insights and Forecast 2022-2032, USD Million
5.2.4.3. Plastic Bottles- Market Insights and Forecast 2022-2032, USD Million
5.2.4.4. Others- Market Insights and Forecast 2022-2032, USD Million
5.2.5. By Sales Channel
5.2.5.1. On-Trade- Market Insights and Forecast 2022-2032, USD Million
5.2.5.2. Off-Trade- Market Insights and Forecast 2022-2032, USD Million
5.2.5.2.1. Retail Offline- Market Insights and Forecast 2022-2032, USD Million
5.2.5.2.2. Retail Online- Market Insights and Forecast 2022-2032, USD Million
5.2.6. By Competitors
5.2.6.1. Competition Characteristics
5.2.6.2. Market Share & Analysis
6. Paraguay Beer Market Statistics, 2022-2032F
6.1. Market Size & Growth Outlook
6.1.1. By Revenues in US$ Million
6.1.2. By Quantity Sold in Million Litres
6.2. Market Segmentation & Growth Outlook
6.2.1. By Alcohol Content- Market Insights and Forecast 2022-2032, USD Million
6.2.2. By Flavor- Market Insights and Forecast 2022-2032, USD Million
6.2.3. By Packaging Type- Market Insights and Forecast 2022-2032, USD Million
6.2.4. By Sales Channel- Market Insights and Forecast 2022-2032, USD Million
7. Paraguay Cider/Perry Market Statistics, 2022-2032F
7.1. Market Size & Growth Outlook
7.1.1. By Revenues in US$ Million
7.1.2. By Quantity Sold in Million Litres
7.2. Market Segmentation & Growth Outlook
7.2.1. By Alcohol Content- Market Insights and Forecast 2022-2032, USD Million
7.2.2. By Flavor- Market Insights and Forecast 2022-2032, USD Million
7.2.3. By Packaging Type- Market Insights and Forecast 2022-2032, USD Million
7.2.4. By Sales Channel- Market Insights and Forecast 2022-2032, USD Million
8. Paraguay Ready-to-Drink Market Statistics, 2022-2032F
8.1. Market Size & Growth Outlook
8.1.1. By Revenues in US$ Million
8.1.2. By Quantity Sold in Million Litres
8.2. Market Segmentation & Growth Outlook
8.2.1. By Alcohol Content- Market Insights and Forecast 2022-2032, USD Million
8.2.2. By Flavor- Market Insights and Forecast 2022-2032, USD Million
8.2.3. By Packaging Type- Market Insights and Forecast 2022-2032, USD Million
8.2.4. By Sales Channel- Market Insights and Forecast 2022-2032, USD Million
9. Paraguay Spirits Market Statistics, 2022-2032F
9.1. Market Size & Growth Outlook
9.1.1. By Revenues in US$ Million
9.1.2. By Quantity Sold in Million Litres
9.2. Market Segmentation & Growth Outlook
9.2.1. By Alcohol Content- Market Insights and Forecast 2022-2032, USD Million
9.2.2. By Flavor- Market Insights and Forecast 2022-2032, USD Million
9.2.3. By Packaging Type- Market Insights and Forecast 2022-2032, USD Million
9.2.4. By Sales Channel- Market Insights and Forecast 2022-2032, USD Million
10. Paraguay Wine Market Statistics, 2022-2032F
10.1.Market Size & Growth Outlook
10.1.1. By Revenues in US$ Million
10.1.2. By Quantity Sold in Million Litres
10.2.Market Segmentation & Growth Outlook
10.2.1. By Alcohol Content- Market Insights and Forecast 2022-2032, USD Million
10.2.2. By Flavor- Market Insights and Forecast 2022-2032, USD Million
10.2.3. By Packaging Type- Market Insights and Forecast 2022-2032, USD Million
10.2.4. By Sales Channel- Market Insights and Forecast 2022-2032, USD Million
11. Competitive Outlook
11.1.Company Profiles
11.1.1. Anheuser-Busch InBev NV
11.1.1.1. Business Description
11.1.1.2. Product Portfolio
11.1.1.3. Collaborations & Alliances
11.1.1.4. Recent Developments
11.1.1.5. Financial Details
11.1.1.6. Others
11.1.2. Grupo Riquelme
11.1.2.1. Business Description
11.1.2.2. Product Portfolio
11.1.2.3. Collaborations & Alliances
11.1.2.4. Recent Developments
11.1.2.5. Financial Details
11.1.2.6. Others
11.1.3. Grupo AJ Vierci SA
11.1.3.1. Business Description
11.1.3.2. Product Portfolio
11.1.3.3. Collaborations & Alliances
11.1.3.4. Recent Developments
11.1.3.5. Financial Details
11.1.3.6. Others
11.1.4. Molson Coors Brewing Co
11.1.4.1. Business Description
11.1.4.2. Product Portfolio
11.1.4.3. Collaborations & Alliances
11.1.4.4. Recent Developments
11.1.4.5. Financial Details
11.1.4.6. Others
11.1.5. Fortin SA
11.1.5.1. Business Description
11.1.5.2. Product Portfolio
11.1.5.3. Collaborations & Alliances
11.1.5.4. Recent Developments
11.1.5.5. Financial Details
11.1.5.6. Others
11.1.6. CIA Compañía Embotelladora Tres Leones Ovinto SA
11.1.6.1. Business Description
11.1.6.2. Product Portfolio
11.1.6.3. Collaborations & Alliances
11.1.6.4. Recent Developments
11.1.6.5. Financial Details
11.1.6.6. Others
11.1.7. Diageo Plc
11.1.7.1. Business Description
11.1.7.2. Product Portfolio
11.1.7.3. Collaborations & Alliances
11.1.7.4. Recent Developments
11.1.7.5. Financial Details
11.1.7.6. Others
11.1.8. Cañas Paraguayas SA
11.1.8.1. Business Description
11.1.8.2. Product Portfolio
11.1.8.3. Collaborations & Alliances
11.1.8.4. Recent Developments
11.1.8.5. Financial Details
11.1.8.6. Others
11.1.9. Heineken NV
11.1.9.1. Business Description
11.1.9.2. Product Portfolio
11.1.9.3. Collaborations & Alliances
11.1.9.4. Recent Developments
11.1.9.5. Financial Details
11.1.9.6. Others
12. Disclaimer
| Segment | Sub-Segment |
|---|---|
| By Type |
|
| By Alcohol Content |
|
| By Flavor |
|
| By Packaging Type |
|
| By Sales Channel |
|
Research Methodology
This study followed a structured approach comprising four key phases to assess the size and scope of the electro-oxidation market. The process began with thorough secondary research to collect data on the target market, related markets, and broader industry context. These findings, along with preliminary assumptions and estimates, were then validated through extensive primary research involving industry experts from across the value chain. To calculate the overall market size, both top-down and bottom-up methodologies were employed. Finally, market segmentation and data triangulation techniques were applied to refine and validate segment-level estimations.
Secondary Research
The secondary research phase involved gathering data from a wide range of credible and published sources. This step helped in identifying industry trends, defining market segmentation, and understanding the market landscape and value chain.
Sources consulted during this phase included:
- Company annual reports, investor presentations, and press releases
- Industry white papers and certified publications
- Trade directories and market-recognized databases
- Articles from authoritative authors and reputable journals
- Gold and silver standard websites
Secondary research was critical in mapping out the industry's value chain and monetary flow, identifying key market segments, understanding regional variations, and tracking significant industry developments.
Other key sources:
- Financial disclosures
- Industry associations and trade bodies
- News outlets and business magazines
- Academic journals and research studies
- Paid industry databases
Primary Research
To validate secondary data and gain deeper market insights, primary research was conducted with key stakeholders across both the supply and demand sides of the market.
On the demand side, participants included decision-makers and influencers from end-user industries—such as CIOs, CTOs, and CSOs—who provided first-hand perspectives on market needs, product usage, and future expectations.
On the supply side, interviews were conducted with manufacturers, industry associations, and institutional participants to gather insights into current offerings, product pipelines, and market challenges.
Primary interviews provided critical inputs such as:
- Market size and revenue data
- Product and service breakdowns
- Market forecasts
- Regional and application-specific trends
Stakeholders consulted included:
- Leading OEM and solution providers
- Channel and distribution partners
- End users across various applications
- Independent consultants and industry specialists
Market Size Estimation and Data Triangulation
- Identifying Key Market Participants (Secondary Research)
- Goal: To identify the major players or companies in the target market. This typically involves using publicly available data sources such as industry reports, market research publications, and financial statements of companies.
- Tools: Reports from firms like Gartner, Forrester, Euromonitor, Statista, IBISWorld, and others. Public financial statements, news articles, and press releases from top market players.
- Extracting Earnings of Key Market Participants
- Goal: To estimate the earnings generated from the product or service being analyzed. This step helps in understanding the revenue potential of each market player in a specific geography.
- Methods: Earnings data can be gathered from:
- Publicly available financial reports (for listed companies).
- Interviews and primary data sources from professionals, such as Directors, VPs, SVPs, etc. This is especially useful for understanding more nuanced, internal data that isn't publicly disclosed.
- Annual reports and investor presentations of key players.
- Data Collation and Development of a Relevant Data Model
- Goal: To collate inputs from both primary and secondary sources into a structured, data-driven model for market estimation. This model will incorporate key market KPIs and any independent variables relevant to the market.
- Key KPIs: These could include:
- Market size, growth rate, and demand drivers.
- Industry-specific metrics like market share, average revenue per customer (ARPC), or average deal size.
- External variables, such as economic growth rates, inflation rates, or commodity prices, that could affect the market.
- Data Modeling: Based on this data, the market forecasts are developed for the next 5 years. A combination of trend analysis, scenario modeling, and statistical regression might be used to generate projections.
- Scenario Analysis
- Goal: To test different assumptions and validate how sensitive the market is to changes in key variables (e.g., market demand, regulatory changes, technological disruptions).
- Types of Scenarios:
- Base Case: Based on current assumptions and historical data.
- Best-Case Scenario: Assuming favorable market conditions, regulatory environments, and technological advancements.
- Worst-Case Scenario: Accounting for adverse factors, such as economic downturns, stricter regulations, or unexpected disruptions.


