Norway Alcoholic Drinks Market Report: Trends, Growth and Forecast (2026-2032)
By Type (Beer, Cider/Perry, RTDs, Spirits, Wine), By Alcohol Content (High, Medium, Low), By Flavor (Unflavored, Flavored), By Packaging Type (Glass Bottles, Tins, Plastic Bottles, Others), By Sales Channel (On-Trade, Off-Trade (Retail Offline, Retail Online)) ... Read more

|
Major Players
|
Norway Alcoholic Drinks Market Statistics and Insights, 2026
- Market Size Statistics
- Alcoholic Drinks in Norway is estimated at $ 7.11 Billion.
- The market size is expected to grow to $ 7.62 Billion by 2032.
- Market to register a CAGR of around 0.99% during 2026-32.
- Type Shares
- Beer grabbed market share of 45%.
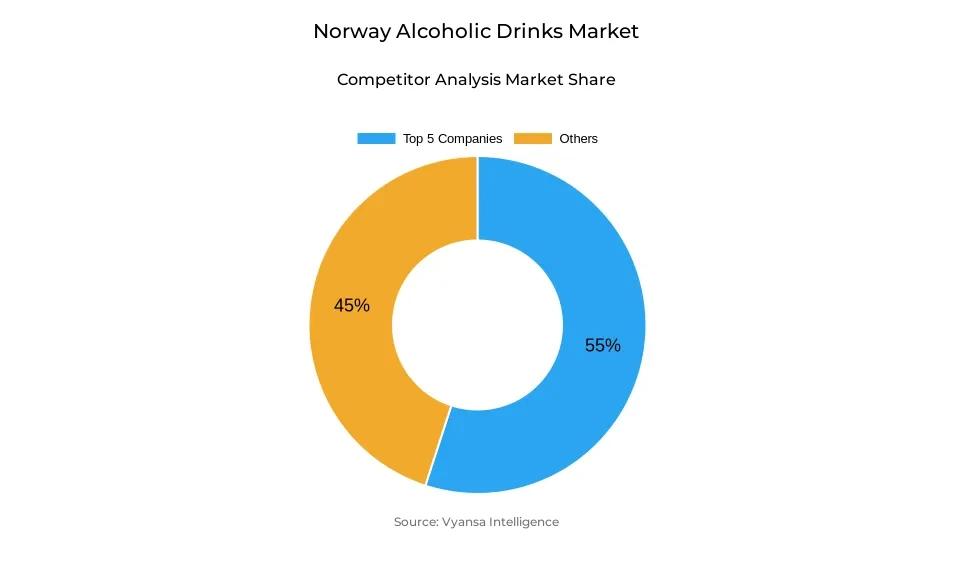
- Competition
- More than 10 companies are actively engaged in producing Alcoholic Drinks in Norway.
- Top 5 companies acquired 55% of the market share.
- Aass, P Ltz AS, Heineken NV, Anheuser-Busch InBev NV, Carlsberg A/S, Hansa Borg Bryggerier AS etc., are few of the top companies.
- Sales Channel
- Off -Trade grabbed 60% of the market.
Norway Alcoholic Drinks Market Outlook
The Norway Alcoholic Drinks Market is projected at $7.11 billion in 2025 and will expand to $7.41 billion by 2032. Off-trade is the leading sales channel, holding 60% of the market share, and is sustained by grocery retailers and Vinmonopolet's wide range of products. Convenience, availability, and premium product range remain important to end userss, and off-trade remains a steady driving force for sales.
Health-aware and responsible drinking patterns are set to influence market growth during the forecast period. Sales of non- and low-alcohol beer, cider, and Ready-to-Drink (RTD) products will continue to increase, particularly with younger adult urban shoppers. Innovation in these segments, including low-calorie, sugar-free, and vegan-friendly products, will be a principal growth driver, as well as convenient and single-serve packaging formats.
Beer is forecast to remain the largest category, but total volumes will continue to be under pressure from pricing and cross-border trade. Within beer, non-alcoholic and flavoured/mixed lagers, with Radler a leading example, will remain popular. Cider and RTDs will be the most dynamic categories, however, powered by premium ingredients, cocktail-inspired tastes, and the no- and low-alcohol trend. Wine and spirits will experience steady growth, with lighter options and lower ABV products continuing to make gains.
The sober curious trend, purchasing power for health, and changing end users preferences for lighter, craft, and artisanal drinks will lead product innovation and marketing strategies. Players that concentrate on non/low alcohol innovation, enhanced quality, and broader availability will gain the most, with the market experiencing modest growth and stability in the next eight years.
Norway Alcoholic Drinks Market Growth Driver
Taxation Influences end users Choices
Norway high alcohol tax continues to influence the market through its impact on end users buying habits. The heavy taxation on products with higher ABV pushes end users toward lower-ABV and non-alcoholic variants. This creates demand for lower-priced and healthier alternatives, leading manufacturers to develop new products and extend their ranges to meet changing end users tastes.
Indirectly, taxes also affect cross-border buying, with end users comparing prices at home with those across borders. The price sensitivity provokes producers to emphasis product differentiation and value-added products, for example, low-strength or non-alcoholic beer, cider, and RTDs. Through such fiscal accommodation, companies can remain competitive while keeping abreast of end users attitudes towards responsible drinking.
Norway Alcoholic Drinks Market Trend
Rise of Low- and No-Alcohol Options
The Norway market evidences a strong trend towards low- and non-alcoholic drinks underpinned by healthy living individuals and the "sober curious" end users. Young adults increasingly enjoy less intense, tasty drinks in place of mainstream beer and spirits. The trend influences innovation with RTDs, non-alcoholic beers, and low-ABV ciders experiencing growth through quality ingredients and easy consumption formats.
Non-alcoholic Radlers, craft ciders, and seasonal low-alcohol variants show high market uptake. Across age groups, particularly younger adults, are adopting these products as part of a responsible lifestyle. Manufacturers are thus actively growing their portfolios, introducing new flavors and convenient single-serve formats to respond to changing end users tastes and take advantage of increasing demand for healthier alternatives.
Unlock Market Intelligence
Explore the market potential with our data-driven report
Norway Alcoholic Drinks Market Opportunity
Innovation in RTDs and Craft Cider
Significant growth is anticipated in Ready-to-Drink and craft cider segments, with scope for innovative offerings and the introduction of premium products. There is scope for the manufacturers to extend non-alcoholic, low-ABV, and flavoured variants to address increasing demand among young adults for healthier, convenient, and artisanal drinks.
New product introductions, including seasonal hard seltzers, fruit ciders, and cocktail-flavored RTDs, will enable companies to make their products stand out. It is also possible to raise distribution across urban locations, balancing premium positioning with increased availability. Through a high focus on innovation, variety, and lifestyle-oriented products, the players can capitalize on evolving end users tastes, build brand presence, and accelerate development in non-alcoholic and low-alcohol categories.
Unlock Market Intelligence
Explore the market potential with our data-driven report
Norway Alcoholic Drinks Market Segmentation Analysis

By Type
- Beer
- Cider/Perry
- RTDs
- Spirits
- Wine
The segment with highest market share under type segment is beer, holding 45% of the Norwegian alcohol beverages market. Beer is the most drunk alcoholic drink, led by demand for mid-range lagers, light and refreshing drinks, and the popularity of existing brands. Of the beer category, flavoured and mixed lagers like Radler, including the non-alcoholic version, are becoming increasingly popular, particularly with health-conscious shoppers and young adults. Non-alcoholic beers are also experiencing robust growth as drinkers increasingly opt for low-ABV and responsible drinking options.
Wine remains a notable segment, with red wine holding the top spot by volume. However, the end users trend is leaning towards lighter versions like white, rosé, and non-alcoholic wines. Established wine-producing nations are losing share as emerging markets gain strength, indicative of changing tastes and increasing popularity of lighter, flavorful drinks.
By Sales Channel
- On-Trade
- Off-Trade
The segment with the highest market share under the Sales Channel is the off-trade segment, accounting for 60% of the Norway Alcoholic Drinks Market. Grocery stores and Vinmonopolet are still the main distribution outlets, with extensive availability, convenience, and strategic on-shelf positioning. Beer and RTDs are easily available in grocery stores, facilitating every-day and impulse purchasing, whereas premium wines, spirits, and products of high ABV are more commonly sold through Vinmonopolet. Promotions at seasonal times and product availability further enhance the strength of the off-trade channel.
Shoppers remain favoring lighter, low-ABV and non-alcoholic choices, stimulating off-trade demand. Vinmonopolet emphasizes premium products, building ranges in low-alcohol and non-alcoholic drinks, and grocery retailers promote convenience and availability, meaning end users can quickly buy their chosen product for everyday use.
Top Companies in Norway Alcoholic Drinks Market
The top companies operating in the market include Aass, P Ltz AS, Heineken NV, Anheuser-Busch InBev NV, Carlsberg A/S, Hansa Borg Bryggerier AS, Reitangruppen AS, Macks Ølbryggeri AS, Anora Group Oyj, Diageo Plc, Oetker-Gruppe, etc., are the top players operating in the Norway Alcoholic Drinks Market.
Frequently Asked Questions
Related Report
1. Market Segmentation
1.1. Research Scope
1.2. Research Methodology
1.3. Definitions and Assumptions
2. Executive Summary
3. Norway Alcoholic Drinks Market Policies, Regulations, and Standards
4. Norway Alcoholic Drinks Market Dynamics
4.1. Growth Factors
4.2. Challenges
4.3. Trends
4.4. Opportunities
5. Norway Alcoholic Drinks Market Statistics, 2022-2032F
5.1. Market Size & Growth Outlook
5.1.1. By Revenues in US$ Million
5.1.2. By Quantity Sold in Million Litres
5.2. Market Segmentation & Growth Outlook
5.2.1. By Type
5.2.1.1. Beer- Market Insights and Forecast 2022-2032, USD Million
5.2.1.2. Cider/Perry- Market Insights and Forecast 2022-2032, USD Million
5.2.1.3. RTDs- Market Insights and Forecast 2022-2032, USD Million
5.2.1.4. Spirits- Market Insights and Forecast 2022-2032, USD Million
5.2.1.5. Wine- Market Insights and Forecast 2022-2032, USD Million
5.2.2. By Alcohol Content
5.2.2.1. High- Market Insights and Forecast 2022-2032, USD Million
5.2.2.2. Medium- Market Insights and Forecast 2022-2032, USD Million
5.2.2.3. Low- Market Insights and Forecast 2022-2032, USD Million
5.2.3. By Flavor
5.2.3.1. Unflavored- Market Insights and Forecast 2022-2032, USD Million
5.2.3.2. Flavored- Market Insights and Forecast 2022-2032, USD Million
5.2.4. By Packaging Type
5.2.4.1. Glass Bottles- Market Insights and Forecast 2022-2032, USD Million
5.2.4.2. Tins- Market Insights and Forecast 2022-2032, USD Million
5.2.4.3. Plastic Bottles- Market Insights and Forecast 2022-2032, USD Million
5.2.4.4. Others- Market Insights and Forecast 2022-2032, USD Million
5.2.5. By Sales Channel
5.2.5.1. On-Trade- Market Insights and Forecast 2022-2032, USD Million
5.2.5.2. Off-Trade- Market Insights and Forecast 2022-2032, USD Million
5.2.5.2.1. Retail Offline- Market Insights and Forecast 2022-2032, USD Million
5.2.5.2.2. Retail Online- Market Insights and Forecast 2022-2032, USD Million
5.2.6. By Competitors
5.2.6.1. Competition Characteristics
5.2.6.2. Market Share & Analysis
6. Norway Beer Market Statistics, 2022-2032F
6.1. Market Size & Growth Outlook
6.1.1. By Revenues in US$ Million
6.1.2. By Quantity Sold in Million Litres
6.2. Market Segmentation & Growth Outlook
6.2.1. By Alcohol Content- Market Insights and Forecast 2022-2032, USD Million
6.2.2. By Flavor- Market Insights and Forecast 2022-2032, USD Million
6.2.3. By Packaging Type- Market Insights and Forecast 2022-2032, USD Million
6.2.4. By Sales Channel- Market Insights and Forecast 2022-2032, USD Million
7. Norway Cider/Perry Market Statistics, 2022-2032F
7.1. Market Size & Growth Outlook
7.1.1. By Revenues in US$ Million
7.1.2. By Quantity Sold in Million Litres
7.2. Market Segmentation & Growth Outlook
7.2.1. By Alcohol Content- Market Insights and Forecast 2022-2032, USD Million
7.2.2. By Flavor- Market Insights and Forecast 2022-2032, USD Million
7.2.3. By Packaging Type- Market Insights and Forecast 2022-2032, USD Million
7.2.4. By Sales Channel- Market Insights and Forecast 2022-2032, USD Million
8. Norway Ready-to-Drink Market Statistics, 2022-2032F
8.1. Market Size & Growth Outlook
8.1.1. By Revenues in US$ Million
8.1.2. By Quantity Sold in Million Litres
8.2. Market Segmentation & Growth Outlook
8.2.1. By Alcohol Content- Market Insights and Forecast 2022-2032, USD Million
8.2.2. By Flavor- Market Insights and Forecast 2022-2032, USD Million
8.2.3. By Packaging Type- Market Insights and Forecast 2022-2032, USD Million
8.2.4. By Sales Channel- Market Insights and Forecast 2022-2032, USD Million
9. Norway Spirits Market Statistics, 2022-2032F
9.1. Market Size & Growth Outlook
9.1.1. By Revenues in US$ Million
9.1.2. By Quantity Sold in Million Litres
9.2. Market Segmentation & Growth Outlook
9.2.1. By Alcohol Content- Market Insights and Forecast 2022-2032, USD Million
9.2.2. By Flavor- Market Insights and Forecast 2022-2032, USD Million
9.2.3. By Packaging Type- Market Insights and Forecast 2022-2032, USD Million
9.2.4. By Sales Channel- Market Insights and Forecast 2022-2032, USD Million
10. Norway Wine Market Statistics, 2022-2032F
10.1.Market Size & Growth Outlook
10.1.1. By Revenues in US$ Million
10.1.2. By Quantity Sold in Million Litres
10.2.Market Segmentation & Growth Outlook
10.2.1. By Alcohol Content- Market Insights and Forecast 2022-2032, USD Million
10.2.2. By Flavor- Market Insights and Forecast 2022-2032, USD Million
10.2.3. By Packaging Type- Market Insights and Forecast 2022-2032, USD Million
10.2.4. By Sales Channel- Market Insights and Forecast 2022-2032, USD Million
11. Competitive Outlook
11.1.Company Profiles
11.1.1. Carlsberg A/S
11.1.1.1. Business Description
11.1.1.2. Product Portfolio
11.1.1.3. Collaborations & Alliances
11.1.1.4. Recent Developments
11.1.1.5. Financial Details
11.1.1.6. Others
11.1.2. Hansa Borg Bryggerier AS
11.1.2.1. Business Description
11.1.2.2. Product Portfolio
11.1.2.3. Collaborations & Alliances
11.1.2.4. Recent Developments
11.1.2.5. Financial Details
11.1.2.6. Others
11.1.3. Reitangruppen AS
11.1.3.1. Business Description
11.1.3.2. Product Portfolio
11.1.3.3. Collaborations & Alliances
11.1.3.4. Recent Developments
11.1.3.5. Financial Details
11.1.3.6. Others
11.1.4. Macks Ølbryggeri AS
11.1.4.1. Business Description
11.1.4.2. Product Portfolio
11.1.4.3. Collaborations & Alliances
11.1.4.4. Recent Developments
11.1.4.5. Financial Details
11.1.4.6. Others
11.1.5. Anora Group Oyj
11.1.5.1. Business Description
11.1.5.2. Product Portfolio
11.1.5.3. Collaborations & Alliances
11.1.5.4. Recent Developments
11.1.5.5. Financial Details
11.1.5.6. Others
11.1.6. Aass, P Ltz AS
11.1.6.1. Business Description
11.1.6.2. Product Portfolio
11.1.6.3. Collaborations & Alliances
11.1.6.4. Recent Developments
11.1.6.5. Financial Details
11.1.6.6. Others
11.1.7. Heineken NV
11.1.7.1. Business Description
11.1.7.2. Product Portfolio
11.1.7.3. Collaborations & Alliances
11.1.7.4. Recent Developments
11.1.7.5. Financial Details
11.1.7.6. Others
11.1.8. Anheuser-Busch InBev NV
11.1.8.1. Business Description
11.1.8.2. Product Portfolio
11.1.8.3. Collaborations & Alliances
11.1.8.4. Recent Developments
11.1.8.5. Financial Details
11.1.8.6. Others
11.1.9. Diageo Plc
11.1.9.1. Business Description
11.1.9.2. Product Portfolio
11.1.9.3. Collaborations & Alliances
11.1.9.4. Recent Developments
11.1.9.5. Financial Details
11.1.9.6. Others
11.1.10. Oetker-Gruppe
11.1.10.1. Business Description
11.1.10.2. Product Portfolio
11.1.10.3. Collaborations & Alliances
11.1.10.4. Recent Developments
11.1.10.5. Financial Details
11.1.10.6. Others
12. Disclaimer
| Segment | Sub-Segment |
|---|---|
| By Type |
|
| By Alcohol Content |
|
| By Flavor |
|
| By Packaging Type |
|
| By Sales Channel |
|
Research Methodology
This study followed a structured approach comprising four key phases to assess the size and scope of the electro-oxidation market. The process began with thorough secondary research to collect data on the target market, related markets, and broader industry context. These findings, along with preliminary assumptions and estimates, were then validated through extensive primary research involving industry experts from across the value chain. To calculate the overall market size, both top-down and bottom-up methodologies were employed. Finally, market segmentation and data triangulation techniques were applied to refine and validate segment-level estimations.
Secondary Research
The secondary research phase involved gathering data from a wide range of credible and published sources. This step helped in identifying industry trends, defining market segmentation, and understanding the market landscape and value chain.
Sources consulted during this phase included:
- Company annual reports, investor presentations, and press releases
- Industry white papers and certified publications
- Trade directories and market-recognized databases
- Articles from authoritative authors and reputable journals
- Gold and silver standard websites
Secondary research was critical in mapping out the industry's value chain and monetary flow, identifying key market segments, understanding regional variations, and tracking significant industry developments.
Other key sources:
- Financial disclosures
- Industry associations and trade bodies
- News outlets and business magazines
- Academic journals and research studies
- Paid industry databases
Primary Research
To validate secondary data and gain deeper market insights, primary research was conducted with key stakeholders across both the supply and demand sides of the market.
On the demand side, participants included decision-makers and influencers from end-user industries—such as CIOs, CTOs, and CSOs—who provided first-hand perspectives on market needs, product usage, and future expectations.
On the supply side, interviews were conducted with manufacturers, industry associations, and institutional participants to gather insights into current offerings, product pipelines, and market challenges.
Primary interviews provided critical inputs such as:
- Market size and revenue data
- Product and service breakdowns
- Market forecasts
- Regional and application-specific trends
Stakeholders consulted included:
- Leading OEM and solution providers
- Channel and distribution partners
- End users across various applications
- Independent consultants and industry specialists
Market Size Estimation and Data Triangulation
- Identifying Key Market Participants (Secondary Research)
- Goal: To identify the major players or companies in the target market. This typically involves using publicly available data sources such as industry reports, market research publications, and financial statements of companies.
- Tools: Reports from firms like Gartner, Forrester, Euromonitor, Statista, IBISWorld, and others. Public financial statements, news articles, and press releases from top market players.
- Extracting Earnings of Key Market Participants
- Goal: To estimate the earnings generated from the product or service being analyzed. This step helps in understanding the revenue potential of each market player in a specific geography.
- Methods: Earnings data can be gathered from:
- Publicly available financial reports (for listed companies).
- Interviews and primary data sources from professionals, such as Directors, VPs, SVPs, etc. This is especially useful for understanding more nuanced, internal data that isn't publicly disclosed.
- Annual reports and investor presentations of key players.
- Data Collation and Development of a Relevant Data Model
- Goal: To collate inputs from both primary and secondary sources into a structured, data-driven model for market estimation. This model will incorporate key market KPIs and any independent variables relevant to the market.
- Key KPIs: These could include:
- Market size, growth rate, and demand drivers.
- Industry-specific metrics like market share, average revenue per customer (ARPC), or average deal size.
- External variables, such as economic growth rates, inflation rates, or commodity prices, that could affect the market.
- Data Modeling: Based on this data, the market forecasts are developed for the next 5 years. A combination of trend analysis, scenario modeling, and statistical regression might be used to generate projections.
- Scenario Analysis
- Goal: To test different assumptions and validate how sensitive the market is to changes in key variables (e.g., market demand, regulatory changes, technological disruptions).
- Types of Scenarios:
- Base Case: Based on current assumptions and historical data.
- Best-Case Scenario: Assuming favorable market conditions, regulatory environments, and technological advancements.
- Worst-Case Scenario: Accounting for adverse factors, such as economic downturns, stricter regulations, or unexpected disruptions.


