North America Photonic Integrated Circuit Market Report: Trends, Growth and Forecast (2026-2032)
By Component (Optical Transceivers, Optical Switches, Optical Sensors, Modulators, Waveguides, Photonic Lasers, Other Photonic Components), By Raw Material (Silicon, Indium Phosphide (InP), Silicon Nitride (SiN), Gallium Arsenide (GaAs), Others), By Integration Type (Monolithic PICs, Hybrid PICs, Heterogeneous Integration, Others), By End User (Telecommunications, Data Centers, Quantum Computing & Quantum Communications, Automotive, Healthcare & Biomedical Sensing, Defense & Aerospace, Consumer Electronics & IoT, Others), By Country (US, Canada, Mexico) ... Read more
|
Major Players
|
North America Photonic Integrated Circuit Market Overview
Photonic integrated circuits are compact chips or packaged devices that integrate optical functions, including light generation, modulation, routing, switching, and detection. The North America photonic integrated circuit market supports data centres, telecommunications, healthcare, defence, automotive, sensing, and quantum applications. Strong regional demand for smaller, faster, and energy-efficient optical systems across industries is expected to drive an 8.18% CAGR during 2026–2032.
Key Highlights of the North America Photonic Integrated Circuit Market
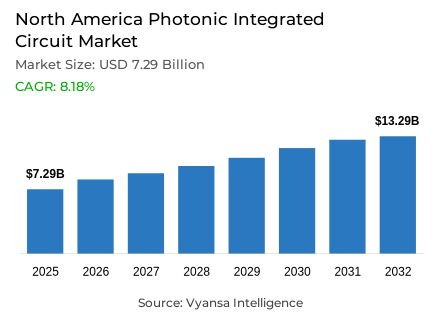
- The North America photonic integrated circuit market increased from USD 7.29 billion in 2025 to USD 8.29 billion in 2026 and is projected to reach USD 13.29 billion by 2032.
- The market is forecast to grow at an 8.18% CAGR during 2026–2032.
- Optical Transceivers led the Component segment with a 34% share in 2026.
- However, Photonic Lasers is the fastest-growing Component segment, with a 10.79% CAGR during 2026–2032.
- Data centres led the end-user segment with a 36% share in 2026.
- Meanwhile, quantum computing and communications are projected to grow fastest at a 15.75% CAGR.
- The United States dominated the regional market with a 92% share in 2026.
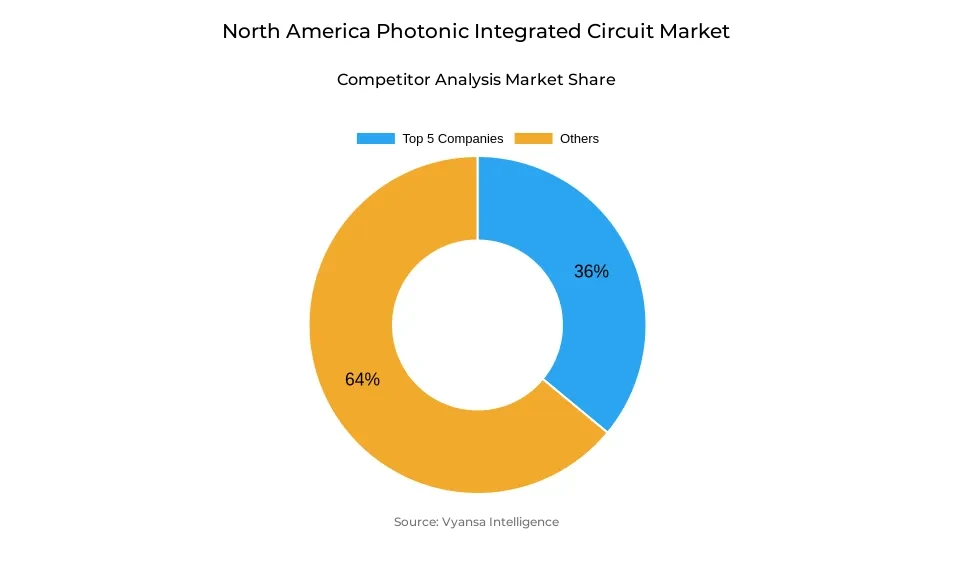
- The top five companies held a combined 36% share, indicating a moderately consolidated market.
North America is expected to account for a significant share of the global photonic integrated circuit (PIC) market during 2026–2032, primarily driven by rapid expansion of AI data centers, large-scale semiconductor investments, and increasing deployment of high-speed optical communication infrastructure.
Government-backed semiconductor investments are also strengthening regional PIC manufacturing capabilities. Through the CHIPS and Science Act, the United States is expanding domestic semiconductor production, including silicon photonics manufacturing. In addition, the National Research Council of Canada (NRC) identifies its Canadian Photonics Fabrication Centre (CPFC) as the only end-to-end compound semiconductor photonics fabrication facility in North America, supporting the design and production of photonic integrated circuits for AI data centers, telecommunications, high-performance computing, quantum technologies, and defense applications.
The region's outlook is further supported by growing investments in AI infrastructure. Recent federal initiatives include accelerated permitting and financial support for large-scale AI data center projects exceeding 100 MW of new electrical load, alongside strategic investments in semiconductor fabrication and networking infrastructure. These developments are expected to increase regional demand for high-speed optical interconnects and integrated photonic devices throughout the forecast period.
During 2026–2032, the North America photonic integrated circuit market is expected to benefit from sustained investments in AI computing infrastructure, semiconductor manufacturing, and next-generation optical networking. Suppliers offering advanced PIC designs, integrated laser technologies, scalable packaging, and regional manufacturing capabilities will be well positioned to capitalize on increasing demand from hyperscale data centers, telecommunications providers, and high-performance computing applications.
North America Photonic Integrated Circuit Market Drivers
AI Data-Centre Scale-Up Increases Optical Interconnect Demand
Artificial intelligence (AI) data-centre expansion is increasing demand in the North America photonic integrated circuit market. Large computing centres need faster connections between processors, memory, storage, and network switches. Electrical links use more power and lose efficiency at higher speeds. This encourages operators to adopt PIC-based transceivers, optical engines, modulators, detectors, and lasers for faster, lower-power data movement across North America.
The United States Department of Energy reported that data centres used 176 terawatt-hours of electricity in 2023 and could require 325–580 terawatt-hours by 2028. This increase reflects greater computing capacity and network traffic. As more data moves inside these facilities, demand rises for silicon-photonics transmitters, indium-phosphide lasers, and packaged optical engines that support efficient high-speed connections across North America.
Rising investment in artificial intelligence and high-performance computing infrastructure will increase purchases of PIC-based optical links across North America. This will raise demand for photonic wafers, integrated lasers, advanced packaging, testing, and foundry services. Over 2026–2032, suppliers offering reliable 800G, 1.6T, and next-generation optical products will benefit from expanding accelerator clusters, storage networks, switches, and computing systems across the region.
North America Photonic Integrated Circuit Market Restraints
Advanced Packaging, Testing, and Yield Control Raise Commercialisation Costs
Advanced packaging, testing, and production yield remain key barriers to the large-scale commercialization of photonic integrated circuits (PICs) across North America. Unlike conventional semiconductor devices, PICs require highly precise integration with optical fibres, lasers, electronic components, and thermal management systems. Even minor deviations in optical alignment, heat dissipation, or signal coupling can reduce device performance and manufacturing yields, increasing production costs and extending product qualification timelines.
The American Institute for Manufacturing Integrated Photonics (AIM Photonics) highlights the capital-intensive nature of PIC manufacturing, noting that photonic testing equipment can cost several hundred thousand dollars and may require up to one year for procurement, installation, and validation. Its Rochester facility operates more than 30 specialized tools for wafer-, die-, and package-level testing, underscoring the technical complexity and infrastructure required to support high-volume PIC production. As a result, many developers continue to rely on shared manufacturing facilities and specialized packaging and testing partners, particularly during product development and low-volume production.
These manufacturing challenges are expected to constrain the North America photonic integrated circuit market throughout the forecast period. High packaging and testing costs, coupled with yield optimization requirements, will increase development expenditures, prolong customer qualification cycles, and delay the transition from prototype to commercial-scale production. Smaller manufacturers are likely to face greater barriers to market entry due to limited access to specialized infrastructure, while continued dependence on external packaging and testing providers may restrict economies of scale and slow cost reductions across key PIC applications, including optical transceivers, optical engines, integrated lasers, and photonic sensors.
North America Photonic Integrated Circuit Market Recent Trends
AI Networks Shift from 800G to 1.6T Pluggable and Co-Packaged Optics
The North America photonic integrated circuit market is moving from 400G and 800G modules toward 1.6T transceivers and co-packaged optics. Higher network speeds require more optical channels, faster modulators, stronger lasers, and denser transmitters. Pluggable modules remain easy to replace, while co-packaged designs place PIC-based optical engines closer to switches, reducing power use, signal loss, and cabling needs at scale.
In 2025, Coherent demonstrated a silicon-photonics 1.6T transceiver using 200-gigabit-per-second electrical and optical lanes. Broadcom also introduced a 102.4-terabit-per-second switch platform with co-packaged optics and began early sampling. These developments increase demand for silicon-photonics transmitters, external lasers, optical engines, fibre connections, and dense packaging, although they do not yet represent full commercial deployment across North America at meaningful commercial scale.
During 2026–2032, this shift will increase demand for 1.6T modules, 200-gigabit-per-lane devices, dense optical engines, and co-packaged products. PIC suppliers will need faster modulators, detectors, lasers, alignment systems, and heat-control solutions. Market competition will depend on power efficiency, port capacity, reliability, and the ability to support both replaceable modules and integrated optical systems across North American data centres over time.
Heterogeneous Integration and Optical Input-Output Chiplets
Heterogeneous integration and optical input-output chiplets are reshaping the North America Photonic Integrated Circuit Market. Developers combine silicon-photonics PICs with lasers, detectors, drivers, and electronic processors within a single package. This approach reduces signal loss, shortens electrical paths, and places optical links closer to processors, memory, and switches. It improves bandwidth density, energy efficiency, and data transfer speed in advanced computing systems.
Intel demonstrated a fully integrated optical-compute-interconnect chaplet supporting four terabits per second bidirectional, with 64 channels in each direction and transmission up to 100 metres of fibre. The company also reported shipping more than eight million photonic integrated circuits containing over 32 million on-chip lasers. This shows strong manufacturing capability for scalable optical input-output systems in North American computing infrastructure.
The industry is shifting toward heterogeneous PIC fabrication, integrated lasers, chiplet bonding, advanced thermal control, fibre coupling, and high-density testing. Suppliers are increasingly combining photonic and electronic functions within compact platforms to reduce power consumption and improve data movement. This shift will support broader adoption of optical input-output chiplet platforms across processors, accelerators, network switches, and high-performance computing systems in North America during 2026–2032.
North America Photonic Integrated Circuit Market Future Opportunities
Photonic Quantum Computing Creates Demand for Low-Loss PICs and Packaging
Photonic quantum computing creates an opportunity for the North America photonic integrated circuit market. Quantum systems need low-loss light paths, optical switches, single-photon sources, sensitive detectors, chip connections, and specialised packaging. Current supply chains cannot yet provide these products at large scale, creating opportunities for PIC foundries, packaging companies, detector suppliers, testing providers, and specialised design businesses across the region.
In May 2026, the United States Department of Commerce proposed USD 100 million for PsiQuantum to support electro-optic materials, higher-temperature single-photon detectors, and ultra-low-loss photonic packaging. These areas directly require PIC technology because quantum processors depend on accurate light generation, routing, detection, and connection. Government support can help move specialised photonic products from prototypes toward repeatable commercial production at scale.
Quantum programmes are expected to create future revenue opportunities in custom PIC design, low-loss wafer production, detector integration, fibre attachment, specialised packaging, testing, and production support. Suppliers that deliver reliable performance and stable production can build long-term relationships with quantum-computing and communication developers. This opportunity will expand the market beyond telecom and data centres while supporting higher-value photonic manufacturing services across North America.
Unlock Market Intelligence
Explore the market potential with our data-driven report
North America Photonic Integrated Circuit Market Segmentation Analysis
By Component
- Optical Transceivers
- Optical Switches
- Optical Sensors
- Modulators
- Waveguides
- Photonic Lasers
- Other Photonic Components
Optical Transceivers Lead the Market, while Photonic Lasers are the Fastest Growing
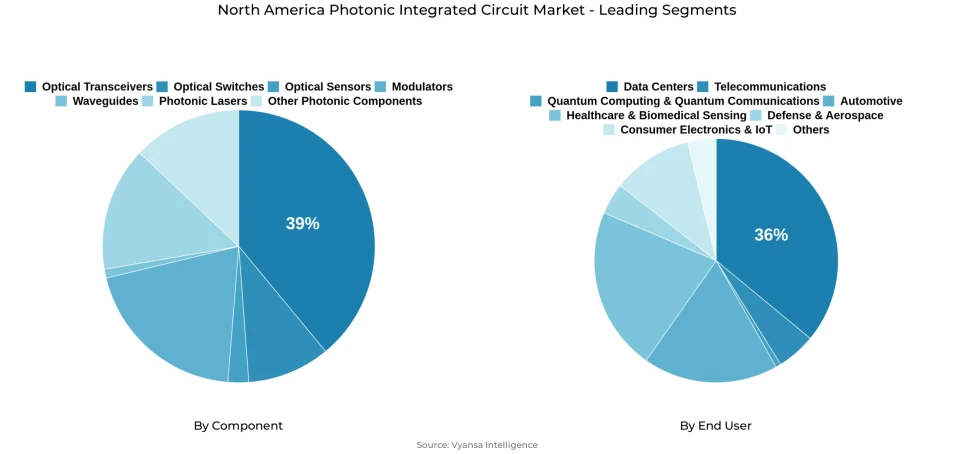
Optical Transceivers led the North America photonic integrated circuit market with an estimated 39% share in 2026. Their strong position is supported by wide use across hyperscale data centres, cloud platforms, telecom networks, artificial intelligence systems, and high-performance computing. These devices enable fast communication between servers, storage systems, switches, and network equipment. Rising deployment of 400G, 800G, 1.6T, and future optical connections is strengthening demand across the region.
Meanwhile, Photonic Lasers are forecast to grow at the fastest CAGR of approximately 10.79% during 2026–2032. Demand is increasing from optical interconnects, coherent communication, LiDAR, defence systems, healthcare equipment, sensing, and quantum technologies. These lasers provide integrated light generation within compact optical systems. Optical transceivers will remain the largest revenue segment, while photonic lasers will support the development of faster communication, sensing, and computing products.
By End User
- Telecommunications
- Data Centers
- Quantum Computing & Quantum Communications
- Automotive
- Healthcare & Biomedical Sensing
- Defense & Aerospace
- Consumer Electronics & IoT
- Others
Data Centers Lead the Market, while Quantum Computing & Quantum Communications are the Fastest Growing
Data Centers dominated the North America photonic integrated circuit market with an estimated 36% share in 2026. Their leadership is supported by continued expansion of cloud computing, artificial intelligence infrastructure, hyperscale facilities, and high-performance computing. Operators use PIC-based transceivers, optical engines, switches, modulators, and lasers to connect servers and accelerators at higher speeds. The need for greater bandwidth, lower power use, and smaller equipment supports continued segment demand.
Meanwhile, quantum computing & quantum communications is projected to grow at the fastest CAGR of approximately 15.75% during 2026–2032. Investment in quantum processors, photonic qubits, secure communication networks, and specialised research facilities is increasing demand for integrated optical components. These systems require accurate light control, low-loss routing, photon detection, and advanced packaging. Data centres will remain the main revenue source, while quantum technologies will create long-term demand for specialised PIC products.
Unlock Market Intelligence
Explore the market potential with our data-driven report
North America Photonic Integrated Circuit Market Regional Analysis
The US leads with a 92% share in 2026 because the US photonic integrated circuit market concentrates hyperscale cloud demand, optical-network vendors, silicon photonics suppliers, defense photonics programs, and quantum-computing funding. DOE data-center evidence shows rising infrastructure pressure, while AIM Photonics, GlobalFoundries, Intel, Cisco, Coherent, Lumentum, Broadcom, and Ayar Labs support North America silicon photonics ecosystem depth. U.S. leadership is reinforced by CHIPS Act manufacturing incentives, BEAD broadband funding, and quantum photonics programs that support foundry access, packaging, optical-network modernization, North America data center interconnect demand, and customer qualification across hyperscale, defense, and telecom procurement channels, pilot lines, and module vendors.
Canada integrated photonics demand provides the strongest supporting growth base because Canada combines photonics fabrication capability, sovereign technology planning, and telecom infrastructure demand. In 2026, the Government of Canada announced a future spin-off of the NRC Canadian Photonics Fabrication Centre to expand domestic photonic semiconductor manufacturing capacity and support AI, semiconductor, and quantum innovation. Mexico has a smaller regional role, concentrated more around electronics manufacturing and telecom infrastructure than PIC design or photonics foundry leadership, making the regional structure primarily U.S.-Canada driven within North America for advanced PIC commercialization and photonics research translation, packaging services, and niche supplier development programs.
North America Photonic Integrated Circuit Market Competitive Landscape
North America photonic integrated circuit market is moderately consolidated, with Intel Corporation, Cisco Systems, Inc./Acacia Communications, Inc., Coherent Corp., Lumentum Holdings Inc./Lumentum Operations LLC, and Broadcom Inc. holding 36% in 2026, while competing on integration, packaging, reliability, and customer qualification.
Key Companies in the North America Photonic Integrated Circuit Market
- Intel Corporation
- Cisco Systems, Inc./Acacia Communications, Inc.
- Coherent Corp.
- Lumentum Holdings Inc./Lumentum Operations LLC
- Broadcom Inc.
- Nokia Corporation/Infinera Corporation
- GlobalFoundries Inc.
- Marvell Technology, Inc.
- Ciena Corporation/Nubis Communications, Inc.
- MACOM Technology Solutions Holdings, Inc.
- Ayar Labs, Inc.
- POET Technologies Inc.
North America Photonic Integrated Circuit Market Recent Developments & Updates
- In May 2026, GlobalFoundries introduced the SCALE optical module solution for co-packaged optics. Built on the company’s silicon photonics technology, the platform supports CWDM and DWDM transmission and complies with Optical Compute Interconnect specifications. The launch adds a U.S developed photonic integration platform for high-bandwidth, energy-efficient connectivity in AI data centres and advanced computing systems.
- In February 2026, Ciena unveiled the Vesta 200 6.4T CPX pluggable optical engine following its acquisition of Nubis Communications. The 200G-per-lane solution is designed for co-packaged and near-packaged optics and can reduce power consumption by up to 70%. The launch expands Ciena’s U.S.-based integrated photonics portfolio for hyperscale and cloud data-centre networks.
Frequently Asked Questions
Related Report
- Market Segmentation
- Research Scope
- Research Methodology
- Definitions and Assumptions
- Executive Summary
- North America Photonic Integrated Circuit Market Policies, Regulations, and Standards
- North America Photonic Integrated Circuit Import & Export Analysis
- North America Photonic Integrated Circuit Market Dynamics
- Growth Factors
- Challenges
- Trends
- Opportunities
- North America Photonic Integrated Circuit Market Statistics, 2022-2032F
- Market Size & Growth Outlook
- By Revenues in USD Million
- Market Segmentation & Growth Outlook
- By Component
- Optical Transceivers- Market Insights and Forecast 2022-2032, USD Million
- Optical Switches- Market Insights and Forecast 2022-2032, USD Million
- Optical Sensors- Market Insights and Forecast 2022-2032, USD Million
- Modulators- Market Insights and Forecast 2022-2032, USD Million
- Waveguides- Market Insights and Forecast 2022-2032, USD Million
- Photonic Lasers- Market Insights and Forecast 2022-2032, USD Million
- Other Photonic Components- Market Insights and Forecast 2022-2032, USD Million
- By Raw Material
- Silicon- Market Insights and Forecast 2022-2032, USD Million
- Indium Phosphide (InP)- Market Insights and Forecast 2022-2032, USD Million
- Silicon Nitride (SiN)- Market Insights and Forecast 2022-2032, USD Million
- Gallium Arsenide (GaAs)- Market Insights and Forecast 2022-2032, USD Million
- Others- Market Insights and Forecast 2022-2032, USD Million
- By Integration Type
- Monolithic PICs- Market Insights and Forecast 2022-2032, USD Million
- Hybrid PICs- Market Insights and Forecast 2022-2032, USD Million
- Heterogeneous Integration- Market Insights and Forecast 2022-2032, USD Million
- Others- Market Insights and Forecast 2022-2032, USD Million
- By End User
- Telecommunications- Market Insights and Forecast 2022-2032, USD Million
- Data Centers- Market Insights and Forecast 2022-2032, USD Million
- Quantum Computing & Quantum Communications- Market Insights and Forecast 2022-2032, USD Million
- Automotive- Market Insights and Forecast 2022-2032, USD Million
- Healthcare & Biomedical Sensing- Market Insights and Forecast 2022-2032, USD Million
- Defense & Aerospace- Market Insights and Forecast 2022-2032, USD Million
- Consumer Electronics & IoT- Market Insights and Forecast 2022-2032, USD Million
- Others- Market Insights and Forecast 2022-2032, USD Million
- By Country
- US
- Canada
- Mexico
- By Competitors
- Competition Characteristics
- Market Share & Analysis
- By Component
- Market Size & Growth Outlook
- US Photonic Integrated Circuit Market Statistics, 2022-2032F
- Market Size & Growth Outlook
- By Revenues in USD Million
- Market Segmentation & Growth Outlook
- By Component- Market Insights and Forecast 2022-2032, USD Million
- By Raw Material- Market Insights and Forecast 2022-2032, USD Million
- By Integration Type- Market Insights and Forecast 2022-2032, USD Million
- By End User- Market Insights and Forecast 2022-2032, USD Million
- Market Size & Growth Outlook
- Canada Photonic Integrated Circuit Market Statistics, 2022-2032F
- Market Size & Growth Outlook
- By Revenues in USD Million
- Market Segmentation & Growth Outlook
- By Component- Market Insights and Forecast 2022-2032, USD Million
- By Raw Material- Market Insights and Forecast 2022-2032, USD Million
- By Integration Type- Market Insights and Forecast 2022-2032, USD Million
- By End User- Market Insights and Forecast 2022-2032, USD Million
- Market Size & Growth Outlook
- Competitive Outlook
- Company Profiles
- Intel Corporation
- Business Description
- Product Portfolio
- Collaborations & Alliances
- Recent Developments
- Financial Details
- Others
- Cisco Systems, Inc./Acacia Communications, Inc.
- Business Description
- Product Portfolio
- Collaborations & Alliances
- Recent Developments
- Financial Details
- Others
- Coherent Corp.
- Business Description
- Product Portfolio
- Collaborations & Alliances
- Recent Developments
- Financial Details
- Others
- Lumentum Holdings Inc./Lumentum Operations LLC
- Business Description
- Product Portfolio
- Collaborations & Alliances
- Recent Developments
- Financial Details
- Others
- Broadcom Inc.
- Business Description
- Product Portfolio
- Collaborations & Alliances
- Recent Developments
- Financial Details
- Others
- Nokia Corporation/Infinera Corporation
- Business Description
- Product Portfolio
- Collaborations & Alliances
- Recent Developments
- Financial Details
- Others
- GlobalFoundries Inc.
- Business Description
- Product Portfolio
- Collaborations & Alliances
- Recent Developments
- Financial Details
- Others
- Marvell Technology, Inc.
- Business Description
- Product Portfolio
- Collaborations & Alliances
- Recent Developments
- Financial Details
- Others
- Ciena Corporation/Nubis Communications, Inc.
- Business Description
- Product Portfolio
- Collaborations & Alliances
- Recent Developments
- Financial Details
- Others
- MACOM Technology Solutions Holdings, Inc.
- Business Description
- Product Portfolio
- Collaborations & Alliances
- Recent Developments
- Financial Details
- Others
- Ayar Labs, Inc.
- Business Description
- Product Portfolio
- Collaborations & Alliances
- Recent Developments
- Financial Details
- Others
- POET Technologies Inc.
- Business Description
- Product Portfolio
- Collaborations & Alliances
- Recent Developments
- Financial Details
- Others
- Intel Corporation
- Company Profiles
- Disclaimer
| Segment | Sub-Segment |
|---|---|
| By Component |
|
| By Raw Material |
|
| By Integration Type |
|
| By End User |
|
| By Country |
|
Research Methodology
This study followed a structured approach comprising four key phases to assess the size and scope of the electro-oxidation market. The process began with thorough secondary research to collect data on the target market, related markets, and broader industry context. These findings, along with preliminary assumptions and estimates, were then validated through extensive primary research involving industry experts from across the value chain. To calculate the overall market size, both top-down and bottom-up methodologies were employed. Finally, market segmentation and data triangulation techniques were applied to refine and validate segment-level estimations.
Secondary Research
The secondary research phase involved gathering data from a wide range of credible and published sources. This step helped in identifying industry trends, defining market segmentation, and understanding the market landscape and value chain.
Sources consulted during this phase included:
- Company annual reports, investor presentations, and press releases
- Industry white papers and certified publications
- Trade directories and market-recognized databases
- Articles from authoritative authors and reputable journals
- Gold and silver standard websites
Secondary research was critical in mapping out the industry's value chain and monetary flow, identifying key market segments, understanding regional variations, and tracking significant industry developments.
Other key sources:
- Financial disclosures
- Industry associations and trade bodies
- News outlets and business magazines
- Academic journals and research studies
- Paid industry databases
Primary Research
To validate secondary data and gain deeper market insights, primary research was conducted with key stakeholders across both the supply and demand sides of the market.
On the demand side, participants included decision-makers and influencers from end-user industries—such as CIOs, CTOs, and CSOs—who provided first-hand perspectives on market needs, product usage, and future expectations.
On the supply side, interviews were conducted with manufacturers, industry associations, and institutional participants to gather insights into current offerings, product pipelines, and market challenges.
Primary interviews provided critical inputs such as:
- Market size and revenue data
- Product and service breakdowns
- Market forecasts
- Regional and application-specific trends
Stakeholders consulted included:
- Leading OEM and solution providers
- Channel and distribution partners
- End users across various applications
- Independent consultants and industry specialists
Market Size Estimation and Data Triangulation
- Identifying Key Market Participants (Secondary Research)
- Goal: To identify the major players or companies in the target market. This typically involves using publicly available data sources such as industry reports, market research publications, and financial statements of companies.
- Tools: Reports from firms like Gartner, Forrester, Euromonitor, Statista, IBISWorld, and others. Public financial statements, news articles, and press releases from top market players.
- Extracting Earnings of Key Market Participants
- Goal: To estimate the earnings generated from the product or service being analyzed. This step helps in understanding the revenue potential of each market player in a specific geography.
- Methods: Earnings data can be gathered from:
- Publicly available financial reports (for listed companies).
- Interviews and primary data sources from professionals, such as Directors, VPs, SVPs, etc. This is especially useful for understanding more nuanced, internal data that isn't publicly disclosed.
- Annual reports and investor presentations of key players.
- Data Collation and Development of a Relevant Data Model
- Goal: To collate inputs from both primary and secondary sources into a structured, data-driven model for market estimation. This model will incorporate key market KPIs and any independent variables relevant to the market.
- Key KPIs: These could include:
- Market size, growth rate, and demand drivers.
- Industry-specific metrics like market share, average revenue per customer (ARPC), or average deal size.
- External variables, such as economic growth rates, inflation rates, or commodity prices, that could affect the market.
- Data Modeling: Based on this data, the market forecasts are developed for the next 5 years. A combination of trend analysis, scenario modeling, and statistical regression might be used to generate projections.
- Scenario Analysis
- Goal: To test different assumptions and validate how sensitive the market is to changes in key variables (e.g., market demand, regulatory changes, technological disruptions).
- Types of Scenarios:
- Base Case: Based on current assumptions and historical data.
- Best-Case Scenario: Assuming favorable market conditions, regulatory environments, and technological advancements.
- Worst-Case Scenario: Accounting for adverse factors, such as economic downturns, stricter regulations, or unexpected disruptions.