Nigeria Energy Drink Market Report: Trends, Growth and Forecast (2025-2030)
By Product Type (Alcoholic, Non-Alcoholic), By Consumption (Drinks, Shots, Mixers), By Nature (Conventional, Natural/Organic), By Flavour (Flavoured, Unflavoured), By Packaging (Bottles, Metal Cans, Pouches, Others), By Packaging Size (Small, Medium, Large), By End User (Teenagers, Adults, Geriatric), By Sales Channel (On-Trade, Off-Trade) ... Read more

|
Major Players
|
Nigeria Energy Drink Market Statistics, 2025
- Market Size Statistics
- Energy Drink in Nigeria is estimated at $ 250 Million.
- The market size is expected to grow to $ 355 Million by 2030.
- Market to register a CAGR of around 6.02% during 2025-30.
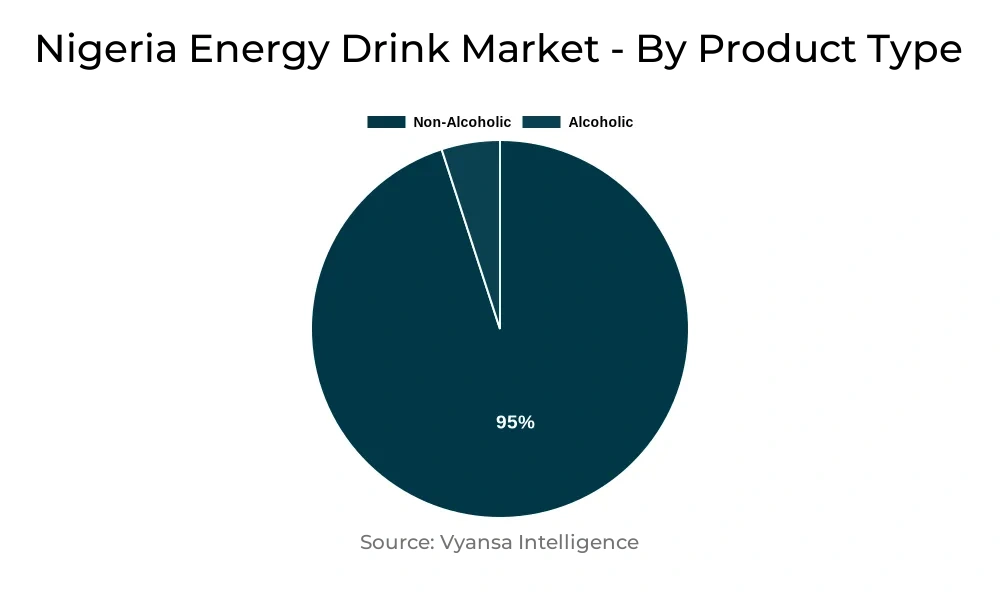
- Product Shares
- Non Alcoholic Energy Drinks grabbed market share of 95%.
- Non Alcoholic Energy Drinks to witness a volume CAGR of around 5.69%.
- Competition
- More than 15 companies are actively engaged in producing Energy Drink in Nigeria.
- Top 5 companies acquired 70% of the market share.
- 7-Up Bottling Co Nigeria, Nigerian Breweries Plc, Deluxe Rich Sdn Bhd, FMCG Distribution Ltd, Rite Foods Ltd etc., are few of the top companies.
- Sales Channel
- Off-Trade grabbed 75% of the market.
Nigeria Energy Drink Market Outlook
Nigeria energy drinks industry is set to expand steadily from 2025 to 2030, led by expanding demand from youths with active and hectic lifestyles. The beverages are regarded as necessities by professionals and youth alike, at the workplace, when stuck in traffic for long hours, or when out socialising. The category has remained resilient even amidst tough economic times, and affordability continues to draw consumers, particularly through innovative packaging such as PET bottles, which reduce production costs.
One of the most viable consumer segments in this market is the female youth, especially from urban regions. Energy drinks are heavily used at nightclubs and have a tendency to get combined with alcoholic beverages. Although brand leaders like Red Bull, Power Horse, and Monster benefit from high brand recall, their premium positioning has restricted them to high-income segments. But these brands have a good place in high-end places, and with an improving economy, their popularity is bound to increase.
Intense competition in the market has promoted the launch of cheaper products with delicious flavours and eye-catching packaging. Companies such as Fearless, Supa Komando, and Predator have attracted considerable market share with their prices being lower and their appeal to working-class consumers. New entrants such as RC Surge, Reactor Gold Power, and Tingo Electric Energy Drink have also joined the market, widening consumer options further.
In the future, enhanced economic stability and rising disposable incomes are bound to drive both mass and premium brands. Owing to increased urbanisation and a young populace, demand for energy drinks is also expected to be robust. Social media marketing, celebrity endorsements, and flavour innovation will continue to expand the reach of energy drinks in Nigeria.

Nigeria Energy Drink Market Growth Driver
Nigeria energy drinks market is anticipated to grow moderately over 2025-30, supported by the fast growth of Nigeria's youth population. Increased youth preference for energy drinks, particularly as a spontaneous energy kick during prolonged work hours or social life, is fueling demand. The sharp increase in price-friendly energy drink products and fierce competition among manufacturers have also contributed to growing product penetration nationwide.
Additionally, urbanization and consumers' busy lifestyles continue to provide conducive conditions for category growth. With growing numbers of people embracing busy work schedules, the demand for functional beverages such as energy drinks is critical. For keeping one active either for work or nightlife, energy drinks are perceived as an easy option, thus playing a positive role in the market's growth prospects during the forecast period.
Nigeria Energy Drink Market Trend
With economic stability and reduced demand for inflation predicted during the forecast period, both volume and value sales of energy drinks will likely increase. For instance, during past economic recessions, consumers opted for mass-market products. But with disposable incomes slowly resurging, there might be high potential for premium brands to further capture Nigerian consumers.
Popular premium brands such as Red Bull, Power Horse, and Monster have already established strong brand awareness, particularly among middle- and upper-income consumers through premium on-trade channels. Such brands should invest even more in marketing and promotional programs to further support their premium positioning. Economic growth is likely to promote additional on-trade consumption, providing these premium energy drinks with additional opportunities to grow their presence in the market.
Unlock Market Intelligence
Explore the market potential with our data-driven report
Nigeria Energy Drink Market Opportunity
New product introductions are projected to increase the broad appeal of energy drinks, particularly in the mass market. Increasing variety of product types and formulations and application of interesting and novel flavours will have a likelihood to appeal to younger adults, who continue to be the category's core consumers. Competition will be a primary driver of growth, with manufacturers looking to innovate to satisfy the tastes of this active consumer segment.
Besides, businesses are bound to intensify marketing using social media platforms, music event sponsorships, and collaborations with artists and celebrities as brand representatives. Given the recovery of the economy, such promotional efforts are expected to gain traction, boosting brand awareness and total category awareness among consumers. Such efforts are poised to drive the growth of energy drink consumption throughout Nigeria in the next few years.
| Report Coverage | Details |
|---|---|
| Market Forecast | 2025-30 |
| USD Value 2024 | $ 250 Million |
| USD Value 2030 | $ 355 Million |
| CAGR 2025-2030 | 6.02% |
| Largest Category | Non Alcoholic Energy Drinks segment leads with 95% market share |
| Top Drivers | Young Population and Busy Lifestyles Fuel Demand |
| Top Trends | Growing Economic Confidence to Elevate Premium Segment |
| Top Opportunities | Widening Consumer Reach through Innovation and Strategic Promotions |
| Key Players | 7-Up Bottling Co Nigeria, Nigerian Breweries Plc, Deluxe Rich Sdn Bhd, FMCG Distribution Ltd, Rite Foods Ltd, Sun Mark Ltd, Coca-Cola Nigeria Ltd, Spitz GesmbH, S, Imperial Beverages Ltd, Red Bull GmbH and Others. |
Unlock Market Intelligence
Explore the market potential with our data-driven report
Nigeria Energy Drink Market Segmentation Analysis
The most lucrative segment in the Nigeria Energy Drinks Market with the highest market share under the End Users segment is Teenagers, fueled by the fast-growing young population in the country. Teenagers are particularly fond of energy drinks, and they use them frequently in nightlife venues to remain active and energetic during the night. This segment is most impacted by social trends and tends to drink energy drinks as alcoholic mixers during social occasions, hence becoming a leading consumer market segment.
Significantly, teenage women have come to be a valuable target market for companies. Teenage women consume alcoholic beverages blended with energy drinks, like wines and spirits, at higher levels than other consumers. Their increasing desire for such blends increases sales and reinforces brand presence. This trend makes young women a prominent segment, which contributes to demand and provides robust growth prospects for energy drink manufacturers in the forecast period.
Top Companies in Nigeria Energy Drink Market
The top companies operating in the market include 7-Up Bottling Co Nigeria, Nigerian Breweries Plc, Deluxe Rich Sdn Bhd, FMCG Distribution Ltd, Rite Foods Ltd, Sun Mark Ltd, Coca-Cola Nigeria Ltd, Spitz GesmbH, S, Imperial Beverages Ltd, Red Bull GmbH, etc., are the top players operating in the Nigeria Energy Drink Market.
Frequently Asked Questions
Related Report
1. Market Segmentation
1.1. Research Scope
1.2. Research Methodology
1.3. Definitions and Assumptions
2. Executive Summary
3. Nigeria Energy Drinks Market Policies, Regulations, and Standards
4. Nigeria Energy Drinks Market Dynamics
4.1. Growth Factors
4.2. Challenges
4.3. Trends
4.4. Opportunities
5. Nigeria Energy Drinks Market Statistics, 2020-2030F
5.1. Market Size & Growth Outlook
5.1.1.By Revenues in US$ Million
5.1.2.By Quantity Sold (Million Liters)
5.2. Market Segmentation & Growth Outlook
5.2.1.By Product Type
5.2.1.1. Alcoholic- Market Insights and Forecast 2020-2030, USD Million
5.2.1.2. Non-Alcoholic- Market Insights and Forecast 2020-2030, USD Million
5.2.2.By Consumption
5.2.2.1. Drinks- Market Insights and Forecast 2020-2030, USD Million
5.2.2.2. Shots- Market Insights and Forecast 2020-2030, USD Million
5.2.2.3. Mixers- Market Insights and Forecast 2020-2030, USD Million
5.2.3.By Nature
5.2.3.1. Conventional- Market Insights and Forecast 2020-2030, USD Million
5.2.3.2. Natural/Organic- Market Insights and Forecast 2020-2030, USD Million
5.2.4.By Flavour
5.2.4.1. Flavoured- Market Insights and Forecast 2020-2030, USD Million
5.2.4.2. Unflavoured- Market Insights and Forecast 2020-2030, USD Million
5.2.5.By Packaging
5.2.5.1. Bottles- Market Insights and Forecast 2020-2030, USD Million
5.2.5.1.1. PET Bottles- Market Insights and Forecast 2020-2030, USD Million
5.2.5.1.2. Glass Bottles- Market Insights and Forecast 2020-2030, USD Million
5.2.5.2. Metal Cans- Market Insights and Forecast 2020-2030, USD Million
5.2.5.3. Pouches- Market Insights and Forecast 2020-2030, USD Million
5.2.5.4. Others- Market Insights and Forecast 2020-2030, USD Million
5.2.6.By Packaging Size
5.2.6.1. Small- Market Insights and Forecast 2020-2030, USD Million
5.2.6.2. Medium- Market Insights and Forecast 2020-2030, USD Million
5.2.6.3. Large- Market Insights and Forecast 2020-2030, USD Million
5.2.7.By End User
5.2.7.1. Teenagers- Market Insights and Forecast 2020-2030, USD Million
5.2.7.2. Adults- Market Insights and Forecast 2020-2030, USD Million
5.2.7.3. Geriatric- Market Insights and Forecast 2020-2030, USD Million
5.2.8.By Sales Channel
5.2.8.1. On-Trade- Market Insights and Forecast 2020-2030, USD Million
5.2.8.2. Off-Trade- Market Insights and Forecast 2020-2030, USD Million
5.2.9.By Competitors
5.2.9.1. Competition Characteristics
5.2.9.2. Market Share & Analysis
6. Nigeria Alcoholic Energy Drinks Market Outlook, 2020-2030F
6.1. Market Size & Growth Outlook
6.1.1.By Revenues in US$ Million
6.1.2.By Quantity Sold (Million Liters)
6.2. Market Segmentation & Growth Outlook
6.2.1.By Consumption- Market Insights and Forecast 2020-2030, USD Million
6.2.2.By Nature- Market Insights and Forecast 2020-2030, USD Million
6.2.3.By Flavour- Market Insights and Forecast 2020-2030, USD Million
6.2.4.By Packaging- Market Insights and Forecast 2020-2030, USD Million
6.2.5.By Packaging Size- Market Insights and Forecast 2020-2030, USD Million
6.2.6.By End Users- Market Insights and Forecast 2020-2030, USD Million
6.2.7.By Sales Channel- Market Insights and Forecast 2020-2030, USD Million
7. Nigeria Non-Alcoholic Energy Drinks Market Outlook, 2020-2030F
7.1. Market Size & Growth Outlook
7.1.1.By Revenues in US$ Million
7.1.2.By Quantity Sold (Million Liters)
7.2. Market Segmentation & Growth Outlook
7.2.1.By Consumption- Market Insights and Forecast 2020-2030, USD Million
7.2.2.By Nature- Market Insights and Forecast 2020-2030, USD Million
7.2.3.By Flavour- Market Insights and Forecast 2020-2030, USD Million
7.2.4.By Packaging- Market Insights and Forecast 2020-2030, USD Million
7.2.5.By Packaging Size- Market Insights and Forecast 2020-2030, USD Million
7.2.6.By End Users- Market Insights and Forecast 2020-2030, USD Million
7.2.7.By Sales Channel- Market Insights and Forecast 2020-2030, USD Million
8. Competitive Outlook
8.1. Company Profiles
8.1.1.FMCG Distribution Ltd
8.1.1.1. Business Description
8.1.1.2. Product Portfolio
8.1.1.3. Collaborations & Alliances
8.1.1.4. Recent Developments
8.1.1.5. Financial Details
8.1.1.6. Others
8.1.2.Rite Foods Ltd
8.1.2.1. Business Description
8.1.2.2. Product Portfolio
8.1.2.3. Collaborations & Alliances
8.1.2.4. Recent Developments
8.1.2.5. Financial Details
8.1.2.6. Others
8.1.3.Sun Mark Ltd
8.1.3.1. Business Description
8.1.3.2. Product Portfolio
8.1.3.3. Collaborations & Alliances
8.1.3.4. Recent Developments
8.1.3.5. Financial Details
8.1.3.6. Others
8.1.4.Coca-Cola Nigeria Ltd
8.1.4.1. Business Description
8.1.4.2. Product Portfolio
8.1.4.3. Collaborations & Alliances
8.1.4.4. Recent Developments
8.1.4.5. Financial Details
8.1.4.6. Others
8.1.5.Spitz GesmbH, S
8.1.5.1. Business Description
8.1.5.2. Product Portfolio
8.1.5.3. Collaborations & Alliances
8.1.5.4. Recent Developments
8.1.5.5. Financial Details
8.1.5.6. Others
8.1.6.7-Up Bottling Co Nigeria
8.1.6.1. Business Description
8.1.6.2. Product Portfolio
8.1.6.3. Collaborations & Alliances
8.1.6.4. Recent Developments
8.1.6.5. Financial Details
8.1.6.6. Others
8.1.7.Nigerian Breweries Plc
8.1.7.1. Business Description
8.1.7.2. Product Portfolio
8.1.7.3. Collaborations & Alliances
8.1.7.4. Recent Developments
8.1.7.5. Financial Details
8.1.7.6. Others
8.1.8.Deluxe Rich Sdn Bhd
8.1.8.1. Business Description
8.1.8.2. Product Portfolio
8.1.8.3. Collaborations & Alliances
8.1.8.4. Recent Developments
8.1.8.5. Financial Details
8.1.8.6. Others
8.1.9.Imperial Beverages Ltd
8.1.9.1. Business Description
8.1.9.2. Product Portfolio
8.1.9.3. Collaborations & Alliances
8.1.9.4. Recent Developments
8.1.9.5. Financial Details
8.1.9.6. Others
8.1.10. Red Bull GmbH
8.1.10.1. Business Description
8.1.10.2. Product Portfolio
8.1.10.3. Collaborations & Alliances
8.1.10.4. Recent Developments
8.1.10.5. Financial Details
8.1.10.6. Others
9. Disclaimer
| Segment | Sub-Segment |
|---|---|
| By Product Type |
|
| By Consumption |
|
| By Nature |
|
| By Flavour |
|
| By Packaging |
|
| By Packaging Size |
|
| By End User |
|
| By Sales Channel |
|
Research Methodology
This study followed a structured approach comprising four key phases to assess the size and scope of the electro-oxidation market. The process began with thorough secondary research to collect data on the target market, related markets, and broader industry context. These findings, along with preliminary assumptions and estimates, were then validated through extensive primary research involving industry experts from across the value chain. To calculate the overall market size, both top-down and bottom-up methodologies were employed. Finally, market segmentation and data triangulation techniques were applied to refine and validate segment-level estimations.
Secondary Research
The secondary research phase involved gathering data from a wide range of credible and published sources. This step helped in identifying industry trends, defining market segmentation, and understanding the market landscape and value chain.
Sources consulted during this phase included:
- Company annual reports, investor presentations, and press releases
- Industry white papers and certified publications
- Trade directories and market-recognized databases
- Articles from authoritative authors and reputable journals
- Gold and silver standard websites
Secondary research was critical in mapping out the industry's value chain and monetary flow, identifying key market segments, understanding regional variations, and tracking significant industry developments.
Other key sources:
- Financial disclosures
- Industry associations and trade bodies
- News outlets and business magazines
- Academic journals and research studies
- Paid industry databases
Primary Research
To validate secondary data and gain deeper market insights, primary research was conducted with key stakeholders across both the supply and demand sides of the market.
On the demand side, participants included decision-makers and influencers from end-user industries—such as CIOs, CTOs, and CSOs—who provided first-hand perspectives on market needs, product usage, and future expectations.
On the supply side, interviews were conducted with manufacturers, industry associations, and institutional participants to gather insights into current offerings, product pipelines, and market challenges.
Primary interviews provided critical inputs such as:
- Market size and revenue data
- Product and service breakdowns
- Market forecasts
- Regional and application-specific trends
Stakeholders consulted included:
- Leading OEM and solution providers
- Channel and distribution partners
- End users across various applications
- Independent consultants and industry specialists
Market Size Estimation and Data Triangulation
- Identifying Key Market Participants (Secondary Research)
- Goal: To identify the major players or companies in the target market. This typically involves using publicly available data sources such as industry reports, market research publications, and financial statements of companies.
- Tools: Reports from firms like Gartner, Forrester, Euromonitor, Statista, IBISWorld, and others. Public financial statements, news articles, and press releases from top market players.
- Extracting Earnings of Key Market Participants
- Goal: To estimate the earnings generated from the product or service being analyzed. This step helps in understanding the revenue potential of each market player in a specific geography.
- Methods: Earnings data can be gathered from:
- Publicly available financial reports (for listed companies).
- Interviews and primary data sources from professionals, such as Directors, VPs, SVPs, etc. This is especially useful for understanding more nuanced, internal data that isn't publicly disclosed.
- Annual reports and investor presentations of key players.
- Data Collation and Development of a Relevant Data Model
- Goal: To collate inputs from both primary and secondary sources into a structured, data-driven model for market estimation. This model will incorporate key market KPIs and any independent variables relevant to the market.
- Key KPIs: These could include:
- Market size, growth rate, and demand drivers.
- Industry-specific metrics like market share, average revenue per customer (ARPC), or average deal size.
- External variables, such as economic growth rates, inflation rates, or commodity prices, that could affect the market.
- Data Modeling: Based on this data, the market forecasts are developed for the next 5 years. A combination of trend analysis, scenario modeling, and statistical regression might be used to generate projections.
- Scenario Analysis
- Goal: To test different assumptions and validate how sensitive the market is to changes in key variables (e.g., market demand, regulatory changes, technological disruptions).
- Types of Scenarios:
- Base Case: Based on current assumptions and historical data.
- Best-Case Scenario: Assuming favorable market conditions, regulatory environments, and technological advancements.
- Worst-Case Scenario: Accounting for adverse factors, such as economic downturns, stricter regulations, or unexpected disruptions.


