Global Nickel Ammonium Sulfate Market Report: Trends, Growth and Forecast (2026-2032)
By Purity Grade (Battery Grade, Industrial Grade), By Application (Electroplating, Catalysts, Batteries), By Region (North America, Latin America, Europe, Middle East & Africa, Asia Pacific) ... Read more
|
Major Players
|
Global Nickel Ammonium Sulfate Market Statistics and Insights, 2026
- Market Size Statistics
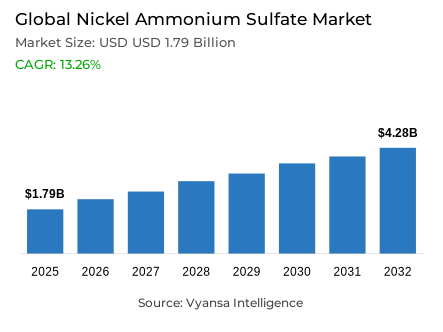
- Global nickel ammonium sulfate market is estimated at USD 1.79 billion in 2025.
- The market size is expected to grow to USD 4.28 billion by 2032.
- Market to register a CAGR of around 13.26% during 2026-32.
- Purity Grade Shares
- Industrial grade grabbed market share of 65%.
- Competition
- Global nickel ammonium sulfate market is currently being catered to by more than 30 companies.
- Top 5 companies acquired around 60% of the market share.
- Tanaka Chemical; Resonac Holdings; L&F Co.; Umicore; Todini Chemicals etc., are few of the top companies.
- Application
- Electroplating grabbed 45% of the market.
- Region
- Asia Pacific leads with a 45% share of the global market.
Global Nickel Ammonium Sulfate Market Outlook
The Global nickel ammonium sulfate market is estimated around about US 1.79 billion in 2025 and will be worth about US 4.28 billion in 2032 with a CAGR of about 13.26% in 2026-32. This strong growth pattern is supported by a well-established industrial need and not a short-lived end-user mood. The long-established manufacturing standards, especially in surface treatment, provide a reliable demand base that facilitates consistent market growth even during cyclical declines in the overall industrial activity.
Electroplating remains the foundation of demand, with approximately 45% of the total market consumption. Nickel ammonium sulfate is required in the automotive, aerospace and electronics manufacturing industry to provide corrosion resistance, durability and dimensional stability. These are technical specifications incorporated in OEM specifications, which restrict substitution risk and leave demand relatively immune to price fluctuations. Electroplating therefore offers a stable volume base that grounds the overall market performance.
On the supply side, the limited supply of primary nickel has changed the cost structures and procurement strategies. The decline in the approved nickel-mining quotas in Indonesia has limited the global feedstock supply, bringing the primary nickel supply closer to demand. To producers, the need to ensure a steady supply of nickel intermediates has become a strategic consideration, which has increased the value of long-term sourcing agreements and strengthening supply security as a market characteristic during the forecast period.
The market is dominated by industrial-grade material with a 65% share, which is suitable in large-scale production where cost-effectiveness and dependability are the most important factors. Asia-Pacific is the regional leader with a 45% share, which is backed by its integrated mining, refining and end-use manufacturing base. It is this combination of established applications, disciplined supply terms, and regional integration that supports a robust and high-growth perspective of the Global nickel ammonium sulfate market into 2032.

Global Nickel Ammonium Sulfate Market Growth Driver
Structural Role of Electroplating in Sustaining Industrial Consumption
Electroplating is the most securely established need base of the global nickel ammonium sulfate market, which is backed by stringent industrial standards as opposed to arbitrary end-user behaviour. The International Nickel Study Group has estimated that the world primary nickel consumption was 3.419 million tonnes in 2024 and is expected to grow even more by 2026; electroplating is among the main non-discretionary uses of nickel along with alloys and steels. Electroplating of nickel is required in the automotive, aerospace, and electronic manufacturing sectors to offer corrosion resistance, dimensional stability, and durability in the presence of harsh operating environments. These technical specifications are formalized in OEM specifications, which guarantees a minimum requirement even in cyclical declines in manufacturing activity.
Direct operational experience in automotive fastener and electronics coating supply chains indicates that electroplating demand is insensitive to price volatility or substitution risk. Nickel ammonium sulfate of industrial grade remains popular because of the predictable stability of nickel-ions, pH regulation, and compatibility with old bath formulations. With the changing vehicle platforms, the need to protect against corrosion remains, supporting a long-term volume offtake. This established pattern of usage gives the market a reliable demand floor that is structurally inaccessible to transient changes in downstream manufacturing sentiment.
Global Nickel Ammonium Sulfate Market Challenge
Policy-Driven Constraints on Global Nickel Feedstock Availability
The pressure on supply has been exerted more by the decisive action of Indonesia in the supply of nickel ore, which has produced a structural constraint and not a temporary disruption. Government RKAB disclosures and International Nickel Study Group estimates show that Indonesia cut its approved nickel mining quota to 150 million tonnes in 2025, a significant drop compared to 272 million tonnes in 2024. This policy has a significant impact on the availability of feedstock to downstream nickel-chemical producers in the world since Indonesia produces over half of the world mined nickel. The above aims of resource conservation, environmental compliance, and prioritisation of domestic downstream processing essentially change the global supply elasticity.
In the case of nickel ammonium sulfate manufacturers, the effect is direct and quantifiable. According to INSG estimates, the world primary nickel supply is now in balance with demand, with only a small surplus capacity. This reduced balance exposes the company to greater feedstock procurement risk, increases working-capital needs, and decreases producer capacity to absorb demand shocks. Operationally, the procurement of consistent nickel intermediates has become a strategic priority, not a procurement formality, and has transformed cost structures and strengthened supply security as a characteristic market constraint.
Unlock Market Intelligence
Explore the market potential with our data-driven report
Global Nickel Ammonium Sulfate Market Trend
Acceleration of High-Nickel Battery Chemistries Influencing Demand Mix
There is a distinct structural change with the electrification driving a faster demand of nickel-based battery chemistries, which is impacting the long-term consumption trends in the international nickel ammonium sulfate market. According to the International Energy Agency, the number of electric-vehicle sales in the world grew rapidly until 2024-2025, and high-nickel cathode chemistries were preferred due to their high energy density and range capabilities. These technologies demand steady and reproducible sources of refined nickel compounds, which enhances the demand visibility of nickel-based chemical precursors in the medium and long term.
Although electroplating is still considered a cornerstone, industry players are witnessing parallel growth curves emerging in battery-material supply chains. Based on personal experience with cathode-material sourcing policies, battery producers are focusing on long-term chemical supply agreements to reduce upstream volatility. This development is not a hypothetical one; the IEA Global Critical Minerals Outlook has affirmed nickel as one of the most rapidly expanding energy-transition metals by 2030. The resultant diversification of demand strengthens market resilience by anchoring consumption in both traditional industrial applications and new electrification-based applications.
Global Nickel Ammonium Sulfate Market Opportunity
Coordinated Critical Mineral Ecosystems Creating Strategic Upside
Critical-mineral systems led by governments are providing a new route to long-term value creation through stabilisation of supply chains and mitigation of investment risk. The International Energy Agency points out that the production and refining of nickel is very geographically concentrated, which increases susceptibility to policy changes and trade shocks. Multilateral institutions and governments are responding by developing coordinated ecosystems based on long-term offtake agreements, permitting acceleration, and development of downstream value-chains. These mechanisms are aimed at matching mining production with confirmed industrial demand instead of spot-market fluctuations.
Such frameworks enhance the bankability of projects materially in the eyes of an operator. The World Bank Climate-Smart Mining initiatives and Natural Resources Canada programmes are actively involved in diversification of refining capacity and responsible sourcing standards. Being part of such ecosystems enables nickel ammonium sulfate producers to gain access to predictable feedstock, stabilise input prices, and rationalise capacity increases. This climate is conducive to specialty-chemical manufacturers that are ready to comply and have the technical scale, which places them in a position to achieve sustainable growth as governments focus on ensuring the security of nickel supply to clean-energy transitions.
Global Nickel Ammonium Sulfate Market Regional Analysis

By Region
- North America
- Latin America
- Europe
- Middle East & Africa
- Asia Pacific
Asia Pacific holds a 45% share of the Global nickel ammonium sulfate market, underpinned by its unmatched integration across mining, refining, and end-use manufacturing. Indonesia’s position as the world’s largest nickel producer and China’s role as the largest consumer create a self-reinforcing regional ecosystem. International Nickel Study Group and government statistics confirm that this concentration supports efficient conversion of mined nickel into downstream chemical products, reducing logistical friction and cost leakage.
From a market operations standpoint, the region’s dominance is not solely volume-driven but structural. Asia Pacific hosts the majority of global electroplating capacity, stainless steel production, and battery manufacturing facilities, ensuring localized demand absorption. Even as output in other regions fluctuates due to cost or regulatory pressures, Asia Pacific’s integrated value chain sustains its 45% market share. This positioning is expected to remain intact through the forecast period, supported by continued downstream investment and policy-backed industrial expansion.
Unlock Market Intelligence
Explore the market potential with our data-driven report
Global Nickel Ammonium Sulfate Market Segmentation Analysis
By Purity Grade
- Battery Grade
- Industrial Grade
Industrial-grade material holds a commanding 65% share of the Global nickel ammonium sulfate market, reflecting its alignment with large-scale manufacturing requirements and cost-performance optimization. This dominance is rooted in the technical sufficiency of industrial-grade purity levels for electroplating, catalysts, and ceramic applications, where marginal purity improvements do not translate into proportional performance gains. In practice, industrial-grade specifications deliver stable deposition quality, reliable solubility, and consistent nickel availability, meeting the operational thresholds demanded by high-throughput plating lines.
Production economics further reinforce this leadership. Industrial-grade output benefits from mature process routes, high utilization rates, and scale efficiencies concentrated in established chemical manufacturing hubs. These factors enable competitive pricing while maintaining dependable quality, which is critical for end users operating continuous production systems. Laboratory and analytical grades serve narrower applications with higher purity requirements, but their premium pricing limits volume penetration. As a result, industrial-grade material is expected to retain its 65% market share through the forecast period, anchored by entrenched industrial demand.

By Application
- Electroplating
- Catalysts
- Batteries
Electroplating accounts for 45% of total demand within the Global nickel ammonium sulfate market, maintaining its position as the largest application segment. This leadership reflects more than a century of technological standardization, where nickel coatings are integral to corrosion resistance, surface hardness, and dimensional reliability. Automotive fasteners, aerospace components, and electronics housings rely on nickel electroplating to meet stringent durability and safety specifications that cannot be compromised without redesigning entire component systems.
Operationally, electroplating demand exhibits exceptional persistence. End users source plated components through long-term supplier relationships, insulating volumes from short-term fluctuations in vehicle sales or electronics output. While emerging applications are expanding, electroplating’s installed base ensures stable consumption volumes. Industry assessments indicate that even as newer applications scale, electroplating will continue to represent the single largest application share, supported by mandatory technical standards and the absence of viable large-scale substitutes for nickel-based protective coatings.
Market Players in Global Nickel Ammonium Sulfate Market
These market players maintain a significant presence in the Global nickel ammonium sulfate market sector and contribute to its ongoing evolution.
- Tanaka Chemical
- Resonac Holdings
- L&F Co.
- Umicore
- Todini Chemicals
- Mitsubishi Chemical Holdings
- BASF SE
- Sumitomo Metal Mining
- JFE Chemical
- 3M
- Honeywell
- BAE Systems
- Royal Ten Cate
- Koninklijke DSM
- Dow Chemical
Market News & Updates
- Sumitomo Metal Mining, 2025:
Sumitomo Metal Mining’s Q2 2025 nickel production totaled 21,800 tonnes of nickel content, including 4,000 tonnes of nickel sulfate, produced through integrated smelting and refining operations that also underpin its supply of nickel salts such as nickel ammonium sulfate for battery and specialty chemical applications. The 13.1% year‑on‑year increase was driven by higher electrolytic nickel and intermediate output, strengthening feedstock availability for downstream nickel chemical products used in battery materials and specialty chemicals.
- Umicore, 2025:
Umicore’s Specialty Materials Business Group, which includes nickel specialty chemicals such as nickel ammonium sulfate, delivered adjusted EBITDA of €59 million in H1 2025, reflecting strong margins in cobalt and nickel-containing products and ongoing demand from battery precursor, catalyst, plating, and pigment applications. The group reinforced its role as a worldwide supplier of nickel specialty chemicals while rolling out its sustainable procurement and responsible sourcing frameworks across nickel supply chains to meet customer and regulatory ESG expectations.
Frequently Asked Questions
Related Report
1. Market Segmentation
1.1. Research Scope
1.2. Research Methodology
1.3. Definitions and Assumptions
2. Executive Summary
3. Global Nickel Ammonium Market Policies, Regulations, and Standards
4. Global Nickel Ammonium Market Dynamics
4.1. Growth Factors
4.2. Challenges
4.3. Trends
4.4. Opportunities
5. Global Nickel Ammonium Market Statistics, 2022-2032F
5.1. Market Size & Growth Outlook
5.1.1.By Revenues in USD Million
5.2. Market Segmentation & Growth Outlook
5.2.1.By Purity Grade
5.2.1.1. Battery Grade- Market Insights and Forecast 2022-2032, USD Million
5.2.1.2. Industrial Grade- Market Insights and Forecast 2022-2032, USD Million
5.2.2.By Application
5.2.2.1. Electroplating- Market Insights and Forecast 2022-2032, USD Million
5.2.2.2. Catalysts- Market Insights and Forecast 2022-2032, USD Million
5.2.2.3. Batteries- Market Insights and Forecast 2022-2032, USD Million
5.2.3.By Region
5.2.3.1. North America
5.2.3.2. Latin America
5.2.3.3. Europe
5.2.3.4. Middle East & Africa
5.2.3.5. Asia Pacific
5.2.4.By Competitors
5.2.4.1. Competition Characteristics
5.2.4.2. Market Share & Analysis
6. North America Nickel Ammonium Market Statistics, 2022-2032F
6.1. Market Size & Growth Outlook
6.1.1.By Revenues in USD Million
6.2. Market Segmentation & Growth Outlook
6.2.1.By Purity Grade- Market Insights and Forecast 2022-2032, USD Million
6.2.2.By Application- Market Insights and Forecast 2022-2032, USD Million
6.2.3.By Country
6.2.3.1. US
6.2.3.2. Canada
6.2.3.3. Mexico
6.2.3.4. Rest of North America
6.3. US Nickel Ammonium Market Statistics, 2022-2032F
6.3.1.Market Size & Growth Outlook
6.3.1.1. By Revenues in USD Million
6.3.2.Market Segmentation & Growth Outlook
6.3.2.1. By Purity Grade- Market Insights and Forecast 2022-2032, USD Million
6.3.2.2. By Application- Market Insights and Forecast 2022-2032, USD Million
6.4. Canada Nickel Ammonium Market Statistics, 2022-2032F
6.4.1.Market Size & Growth Outlook
6.4.1.1. By Revenues in USD Million
6.4.2.Market Segmentation & Growth Outlook
6.4.2.1. By Purity Grade- Market Insights and Forecast 2022-2032, USD Million
6.4.2.2. By Application- Market Insights and Forecast 2022-2032, USD Million
6.5. Mexico Nickel Ammonium Market Statistics, 2022-2032F
6.5.1.Market Size & Growth Outlook
6.5.1.1. By Revenues in USD Million
6.5.2.Market Segmentation & Growth Outlook
6.5.2.1. By Purity Grade- Market Insights and Forecast 2022-2032, USD Million
6.5.2.2. By Application- Market Insights and Forecast 2022-2032, USD Million
7. Latin America Nickel Ammonium Market Statistics, 2022-2032F
7.1. Market Size & Growth Outlook
7.1.1.By Revenues in USD Million
7.2. Market Segmentation & Growth Outlook
7.2.1.By Purity Grade- Market Insights and Forecast 2022-2032, USD Million
7.2.2.By Application- Market Insights and Forecast 2022-2032, USD Million
7.2.3.By Country
7.2.3.1. Brazil
7.2.3.2. Rest of Latin America
7.3. Brazil Nickel Ammonium Market Statistics, 2022-2032F
7.3.1.Market Size & Growth Outlook
7.3.1.1. By Revenues in USD Million
7.3.2.Market Segmentation & Growth Outlook
7.3.2.1. By Purity Grade- Market Insights and Forecast 2022-2032, USD Million
7.3.2.2. By Application- Market Insights and Forecast 2022-2032, USD Million
8. Europe Nickel Ammonium Market Statistics, 2022-2032F
8.1. Market Size & Growth Outlook
8.1.1.By Revenues in USD Million
8.2. Market Segmentation & Growth Outlook
8.2.1.By Purity Grade- Market Insights and Forecast 2022-2032, USD Million
8.2.2.By Application- Market Insights and Forecast 2022-2032, USD Million
8.2.3.By Country
8.2.3.1. Germany
8.2.3.2. France
8.2.3.3. UK
8.2.3.4. Italy
8.2.3.5. Spain
8.2.3.6. Netherlands
8.2.3.7. Belgium
8.2.3.8. Poland
8.2.3.9. Russia
8.2.3.10. Turkey
8.2.3.11. Rest of Europe
8.3. Germany Nickel Ammonium Market Statistics, 2022-2032F
8.3.1.Market Size & Growth Outlook
8.3.1.1. By Revenues in USD Million
8.3.2.Market Segmentation & Growth Outlook
8.3.2.1. By Purity Grade- Market Insights and Forecast 2022-2032, USD Million
8.3.2.2. By Application- Market Insights and Forecast 2022-2032, USD Million
8.4. France Nickel Ammonium Market Statistics, 2022-2032F
8.4.1.Market Size & Growth Outlook
8.4.1.1. By Revenues in USD Million
8.4.2.Market Segmentation & Growth Outlook
8.4.2.1. By Purity Grade- Market Insights and Forecast 2022-2032, USD Million
8.4.2.2. By Application- Market Insights and Forecast 2022-2032, USD Million
8.5. UK Nickel Ammonium Market Statistics, 2022-2032F
8.5.1.Market Size & Growth Outlook
8.5.1.1. By Revenues in USD Million
8.5.2.Market Segmentation & Growth Outlook
8.5.2.1. By Purity Grade- Market Insights and Forecast 2022-2032, USD Million
8.5.2.2. By Application- Market Insights and Forecast 2022-2032, USD Million
8.6. Italy Nickel Ammonium Market Statistics, 2022-2032F
8.6.1.Market Size & Growth Outlook
8.6.1.1. By Revenues in USD Million
8.6.2.Market Segmentation & Growth Outlook
8.6.2.1. By Purity Grade- Market Insights and Forecast 2022-2032, USD Million
8.6.2.2. By Application- Market Insights and Forecast 2022-2032, USD Million
8.7. Spain Nickel Ammonium Market Statistics, 2022-2032F
8.7.1.Market Size & Growth Outlook
8.7.1.1. By Revenues in USD Million
8.7.2.Market Segmentation & Growth Outlook
8.7.2.1. By Purity Grade- Market Insights and Forecast 2022-2032, USD Million
8.7.2.2. By Application- Market Insights and Forecast 2022-2032, USD Million
8.8. Netherlands Nickel Ammonium Market Statistics, 2022-2032F
8.8.1.Market Size & Growth Outlook
8.8.1.1. By Revenues in USD Million
8.8.2.Market Segmentation & Growth Outlook
8.8.2.1. By Purity Grade- Market Insights and Forecast 2022-2032, USD Million
8.8.2.2. By Application- Market Insights and Forecast 2022-2032, USD Million
8.9. Belgium Nickel Ammonium Market Statistics, 2022-2032F
8.9.1.Market Size & Growth Outlook
8.9.1.1. By Revenues in USD Million
8.9.2.Market Segmentation & Growth Outlook
8.9.2.1. By Purity Grade- Market Insights and Forecast 2022-2032, USD Million
8.9.2.2. By Application- Market Insights and Forecast 2022-2032, USD Million
8.10. Poland Nickel Ammonium Market Statistics, 2022-2032F
8.10.1. Market Size & Growth Outlook
8.10.1.1. By Revenues in USD Million
8.10.2. Market Segmentation & Growth Outlook
8.10.2.1. By Purity Grade- Market Insights and Forecast 2022-2032, USD Million
8.10.2.2. By Application- Market Insights and Forecast 2022-2032, USD Million
8.11. Russia Nickel Ammonium Market Statistics, 2022-2032F
8.11.1. Market Size & Growth Outlook
8.11.1.1. By Revenues in USD Million
8.11.2. Market Segmentation & Growth Outlook
8.11.2.1. By Purity Grade- Market Insights and Forecast 2022-2032, USD Million
8.11.2.2. By Application- Market Insights and Forecast 2022-2032, USD Million
8.12. Turkey Nickel Ammonium Market Statistics, 2022-2032F
8.12.1. Market Size & Growth Outlook
8.12.1.1. By Revenues in USD Million
8.12.2. Market Segmentation & Growth Outlook
8.12.2.1. By Purity Grade- Market Insights and Forecast 2022-2032, USD Million
8.12.2.2. By Application- Market Insights and Forecast 2022-2032, USD Million
9. Middle East & Africa Nickel Ammonium Market Statistics, 2022-2032F
9.1. Market Size & Growth Outlook
9.1.1.By Revenues in USD Million
9.2. Market Segmentation & Growth Outlook
9.2.1.By Purity Grade- Market Insights and Forecast 2022-2032, USD Million
9.2.2.By Application- Market Insights and Forecast 2022-2032, USD Million
9.2.3.By Country
9.2.3.1. Saudi Arabia
9.2.3.2. UAE
9.2.3.3. Rest of Middle East & Africa
9.3. Saudi Arabia Nickel Ammonium Market Statistics, 2022-2032F
9.3.1.Market Size & Growth Outlook
9.3.1.1. By Revenues in USD Million
9.3.2.Market Segmentation & Growth Outlook
9.3.2.1. By Purity Grade- Market Insights and Forecast 2022-2032, USD Million
9.3.2.2. By Application- Market Insights and Forecast 2022-2032, USD Million
9.4. UAE Nickel Ammonium Market Statistics, 2022-2032F
9.4.1.Market Size & Growth Outlook
9.4.1.1. By Revenues in USD Million
9.4.2.Market Segmentation & Growth Outlook
9.4.2.1. By Purity Grade- Market Insights and Forecast 2022-2032, USD Million
9.4.2.2. By Application- Market Insights and Forecast 2022-2032, USD Million
10. Asia Pacific Nickel Ammonium Market Statistics, 2022-2032F
10.1. Market Size & Growth Outlook
10.1.1. By Revenues in USD Million
10.2. Market Segmentation & Growth Outlook
10.2.1. By Purity Grade- Market Insights and Forecast 2022-2032, USD Million
10.2.2. By Application- Market Insights and Forecast 2022-2032, USD Million
10.2.3. By Country
10.2.3.1. China
10.2.3.2. Japan
10.2.3.3. South Korea
10.2.3.4. India
10.2.3.5. Australia
10.2.3.6. Thailand
10.2.3.7. Rest of Asia Pacific
10.3. China Nickel Ammonium Market Statistics, 2022-2032F
10.3.1. Market Size & Growth Outlook
10.3.1.1. By Revenues in USD Million
10.3.2. Market Segmentation & Growth Outlook
10.3.2.1. By Purity Grade- Market Insights and Forecast 2022-2032, USD Million
10.3.2.2. By Application- Market Insights and Forecast 2022-2032, USD Million
10.4. Japan Nickel Ammonium Market Statistics, 2022-2032F
10.4.1. Market Size & Growth Outlook
10.4.1.1. By Revenues in USD Million
10.4.2. Market Segmentation & Growth Outlook
10.4.2.1. By Purity Grade- Market Insights and Forecast 2022-2032, USD Million
10.4.2.2. By Application- Market Insights and Forecast 2022-2032, USD Million
10.5. South Korea Nickel Ammonium Market Statistics, 2022-2032F
10.5.1. Market Size & Growth Outlook
10.5.1.1. By Revenues in USD Million
10.5.2. Market Segmentation & Growth Outlook
10.5.2.1. By Purity Grade- Market Insights and Forecast 2022-2032, USD Million
10.5.2.2. By Application- Market Insights and Forecast 2022-2032, USD Million
10.6. India Nickel Ammonium Market Statistics, 2022-2032F
10.6.1. Market Size & Growth Outlook
10.6.1.1. By Revenues in USD Million
10.6.2. Market Segmentation & Growth Outlook
10.6.2.1. By Purity Grade- Market Insights and Forecast 2022-2032, USD Million
10.6.2.2. By Application- Market Insights and Forecast 2022-2032, USD Million
10.7. Australia Nickel Ammonium Market Statistics, 2022-2032F
10.7.1. Market Size & Growth Outlook
10.7.1.1. By Revenues in USD Million
10.7.2. Market Segmentation & Growth Outlook
10.7.2.1. By Purity Grade- Market Insights and Forecast 2022-2032, USD Million
10.7.2.2. By Application- Market Insights and Forecast 2022-2032, USD Million
10.8. Thailand Nickel Ammonium Market Statistics, 2022-2032F
10.8.1. Market Size & Growth Outlook
10.8.1.1. By Revenues in USD Million
10.8.2. Market Segmentation & Growth Outlook
10.8.2.1. By Purity Grade- Market Insights and Forecast 2022-2032, USD Million
10.8.2.2. By Application- Market Insights and Forecast 2022-2032, USD Million
11. Competitive Outlook
11.1. Company Profiles
11.1.1. Umicore
11.1.1.1. Business Description
11.1.1.2. Product Portfolio
11.1.1.3. Collaborations & Alliances
11.1.1.4. Recent Developments
11.1.1.5. Financial Details
11.1.1.6. Others
11.1.2. Todini Chemicals
11.1.2.1. Business Description
11.1.2.2. Product Portfolio
11.1.2.3. Collaborations & Alliances
11.1.2.4. Recent Developments
11.1.2.5. Financial Details
11.1.2.6. Others
11.1.3. Mitsubishi Chemical Holdings
11.1.3.1. Business Description
11.1.3.2. Product Portfolio
11.1.3.3. Collaborations & Alliances
11.1.3.4. Recent Developments
11.1.3.5. Financial Details
11.1.3.6. Others
11.1.4. BASF SE
11.1.4.1. Business Description
11.1.4.2. Product Portfolio
11.1.4.3. Collaborations & Alliances
11.1.4.4. Recent Developments
11.1.4.5. Financial Details
11.1.4.6. Others
11.1.5. Sumitomo Metal Mining
11.1.5.1. Business Description
11.1.5.2. Product Portfolio
11.1.5.3. Collaborations & Alliances
11.1.5.4. Recent Developments
11.1.5.5. Financial Details
11.1.5.6. Others
11.1.6. Tanaka Chemical
11.1.6.1. Business Description
11.1.6.2. Product Portfolio
11.1.6.3. Collaborations & Alliances
11.1.6.4. Recent Developments
11.1.6.5. Financial Details
11.1.6.6. Others
11.1.7. Resonac Holdings
11.1.7.1. Business Description
11.1.7.2. Product Portfolio
11.1.7.3. Collaborations & Alliances
11.1.7.4. Recent Developments
11.1.7.5. Financial Details
11.1.7.6. Others
11.1.8. L&F Co.
11.1.8.1. Business Description
11.1.8.2. Product Portfolio
11.1.8.3. Collaborations & Alliances
11.1.8.4. Recent Developments
11.1.8.5. Financial Details
11.1.8.6. Others
11.1.9. JFE Chemical
11.1.9.1. Business Description
11.1.9.2. Product Portfolio
11.1.9.3. Collaborations & Alliances
11.1.9.4. Recent Developments
11.1.9.5. Financial Details
11.1.9.6. Others
11.1.10. 3M
11.1.10.1.Business Description
11.1.10.2.Product Portfolio
11.1.10.3.Collaborations & Alliances
11.1.10.4.Recent Developments
11.1.10.5.Financial Details
11.1.10.6.Others
11.1.11. Honeywell
11.1.11.1.Business Description
11.1.11.2.Product Portfolio
11.1.11.3.Collaborations & Alliances
11.1.11.4.Recent Developments
11.1.11.5.Financial Details
11.1.11.6.Others
11.1.12. BAE Systems
11.1.12.1.Business Description
11.1.12.2.Product Portfolio
11.1.12.3.Collaborations & Alliances
11.1.12.4.Recent Developments
11.1.12.5.Financial Details
11.1.12.6.Others
11.1.13. Royal Ten Cate
11.1.13.1.Business Description
11.1.13.2.Product Portfolio
11.1.13.3.Collaborations & Alliances
11.1.13.4.Recent Developments
11.1.13.5.Financial Details
11.1.13.6.Others
11.1.14. Koninklijke DSM
11.1.14.1.Business Description
11.1.14.2.Product Portfolio
11.1.14.3.Collaborations & Alliances
11.1.14.4.Recent Developments
11.1.14.5.Financial Details
11.1.14.6.Others
11.1.15. Dow Chemical
11.1.15.1.Business Description
11.1.15.2.Product Portfolio
11.1.15.3.Collaborations & Alliances
11.1.15.4.Recent Developments
11.1.15.5.Financial Details
11.1.15.6.Others
12. Disclaimer
| Segment | Sub-Segment |
|---|---|
| By Purity Grade |
|
| By Application |
|
| By Region |
|
Research Methodology
This study followed a structured approach comprising four key phases to assess the size and scope of the electro-oxidation market. The process began with thorough secondary research to collect data on the target market, related markets, and broader industry context. These findings, along with preliminary assumptions and estimates, were then validated through extensive primary research involving industry experts from across the value chain. To calculate the overall market size, both top-down and bottom-up methodologies were employed. Finally, market segmentation and data triangulation techniques were applied to refine and validate segment-level estimations.
Secondary Research
The secondary research phase involved gathering data from a wide range of credible and published sources. This step helped in identifying industry trends, defining market segmentation, and understanding the market landscape and value chain.
Sources consulted during this phase included:
- Company annual reports, investor presentations, and press releases
- Industry white papers and certified publications
- Trade directories and market-recognized databases
- Articles from authoritative authors and reputable journals
- Gold and silver standard websites
Secondary research was critical in mapping out the industry's value chain and monetary flow, identifying key market segments, understanding regional variations, and tracking significant industry developments.
Other key sources:
- Financial disclosures
- Industry associations and trade bodies
- News outlets and business magazines
- Academic journals and research studies
- Paid industry databases
Primary Research
To validate secondary data and gain deeper market insights, primary research was conducted with key stakeholders across both the supply and demand sides of the market.
On the demand side, participants included decision-makers and influencers from end-user industries—such as CIOs, CTOs, and CSOs—who provided first-hand perspectives on market needs, product usage, and future expectations.
On the supply side, interviews were conducted with manufacturers, industry associations, and institutional participants to gather insights into current offerings, product pipelines, and market challenges.
Primary interviews provided critical inputs such as:
- Market size and revenue data
- Product and service breakdowns
- Market forecasts
- Regional and application-specific trends
Stakeholders consulted included:
- Leading OEM and solution providers
- Channel and distribution partners
- End users across various applications
- Independent consultants and industry specialists
Market Size Estimation and Data Triangulation
- Identifying Key Market Participants (Secondary Research)
- Goal: To identify the major players or companies in the target market. This typically involves using publicly available data sources such as industry reports, market research publications, and financial statements of companies.
- Tools: Reports from firms like Gartner, Forrester, Euromonitor, Statista, IBISWorld, and others. Public financial statements, news articles, and press releases from top market players.
- Extracting Earnings of Key Market Participants
- Goal: To estimate the earnings generated from the product or service being analyzed. This step helps in understanding the revenue potential of each market player in a specific geography.
- Methods: Earnings data can be gathered from:
- Publicly available financial reports (for listed companies).
- Interviews and primary data sources from professionals, such as Directors, VPs, SVPs, etc. This is especially useful for understanding more nuanced, internal data that isn't publicly disclosed.
- Annual reports and investor presentations of key players.
- Data Collation and Development of a Relevant Data Model
- Goal: To collate inputs from both primary and secondary sources into a structured, data-driven model for market estimation. This model will incorporate key market KPIs and any independent variables relevant to the market.
- Key KPIs: These could include:
- Market size, growth rate, and demand drivers.
- Industry-specific metrics like market share, average revenue per customer (ARPC), or average deal size.
- External variables, such as economic growth rates, inflation rates, or commodity prices, that could affect the market.
- Data Modeling: Based on this data, the market forecasts are developed for the next 5 years. A combination of trend analysis, scenario modeling, and statistical regression might be used to generate projections.
- Scenario Analysis
- Goal: To test different assumptions and validate how sensitive the market is to changes in key variables (e.g., market demand, regulatory changes, technological disruptions).
- Types of Scenarios:
- Base Case: Based on current assumptions and historical data.
- Best-Case Scenario: Assuming favorable market conditions, regulatory environments, and technological advancements.
- Worst-Case Scenario: Accounting for adverse factors, such as economic downturns, stricter regulations, or unexpected disruptions.


