Malaysia Cards and Payments Market Report: Trends, Growth and Forecast (2026-2032)
By Instrument Type (Cards (Debit Card, Charge Card, ATM Card, Pre-Paid Card, Credit Card, Store Card), Mobile Wallets, Cheques, Others), By Card Type (Contact Smart Card, Contactless Smart Card, Non-Smart Card), By Type of Payments (B2B, B2C, C2C, C2B (E-commerce Shopping, Payment at POS Terminals)), By Transaction Type (Domestic, Foreign), By Application (Food & Groceries, Health & Pharmacies, Travel & Tourism, Hospitality, Others (Media & Entertainment)) ... Read more
|
Major Players
|
Malaysia Cards and Payments Market Statistics and Insights, 2026
- Market Size Statistics
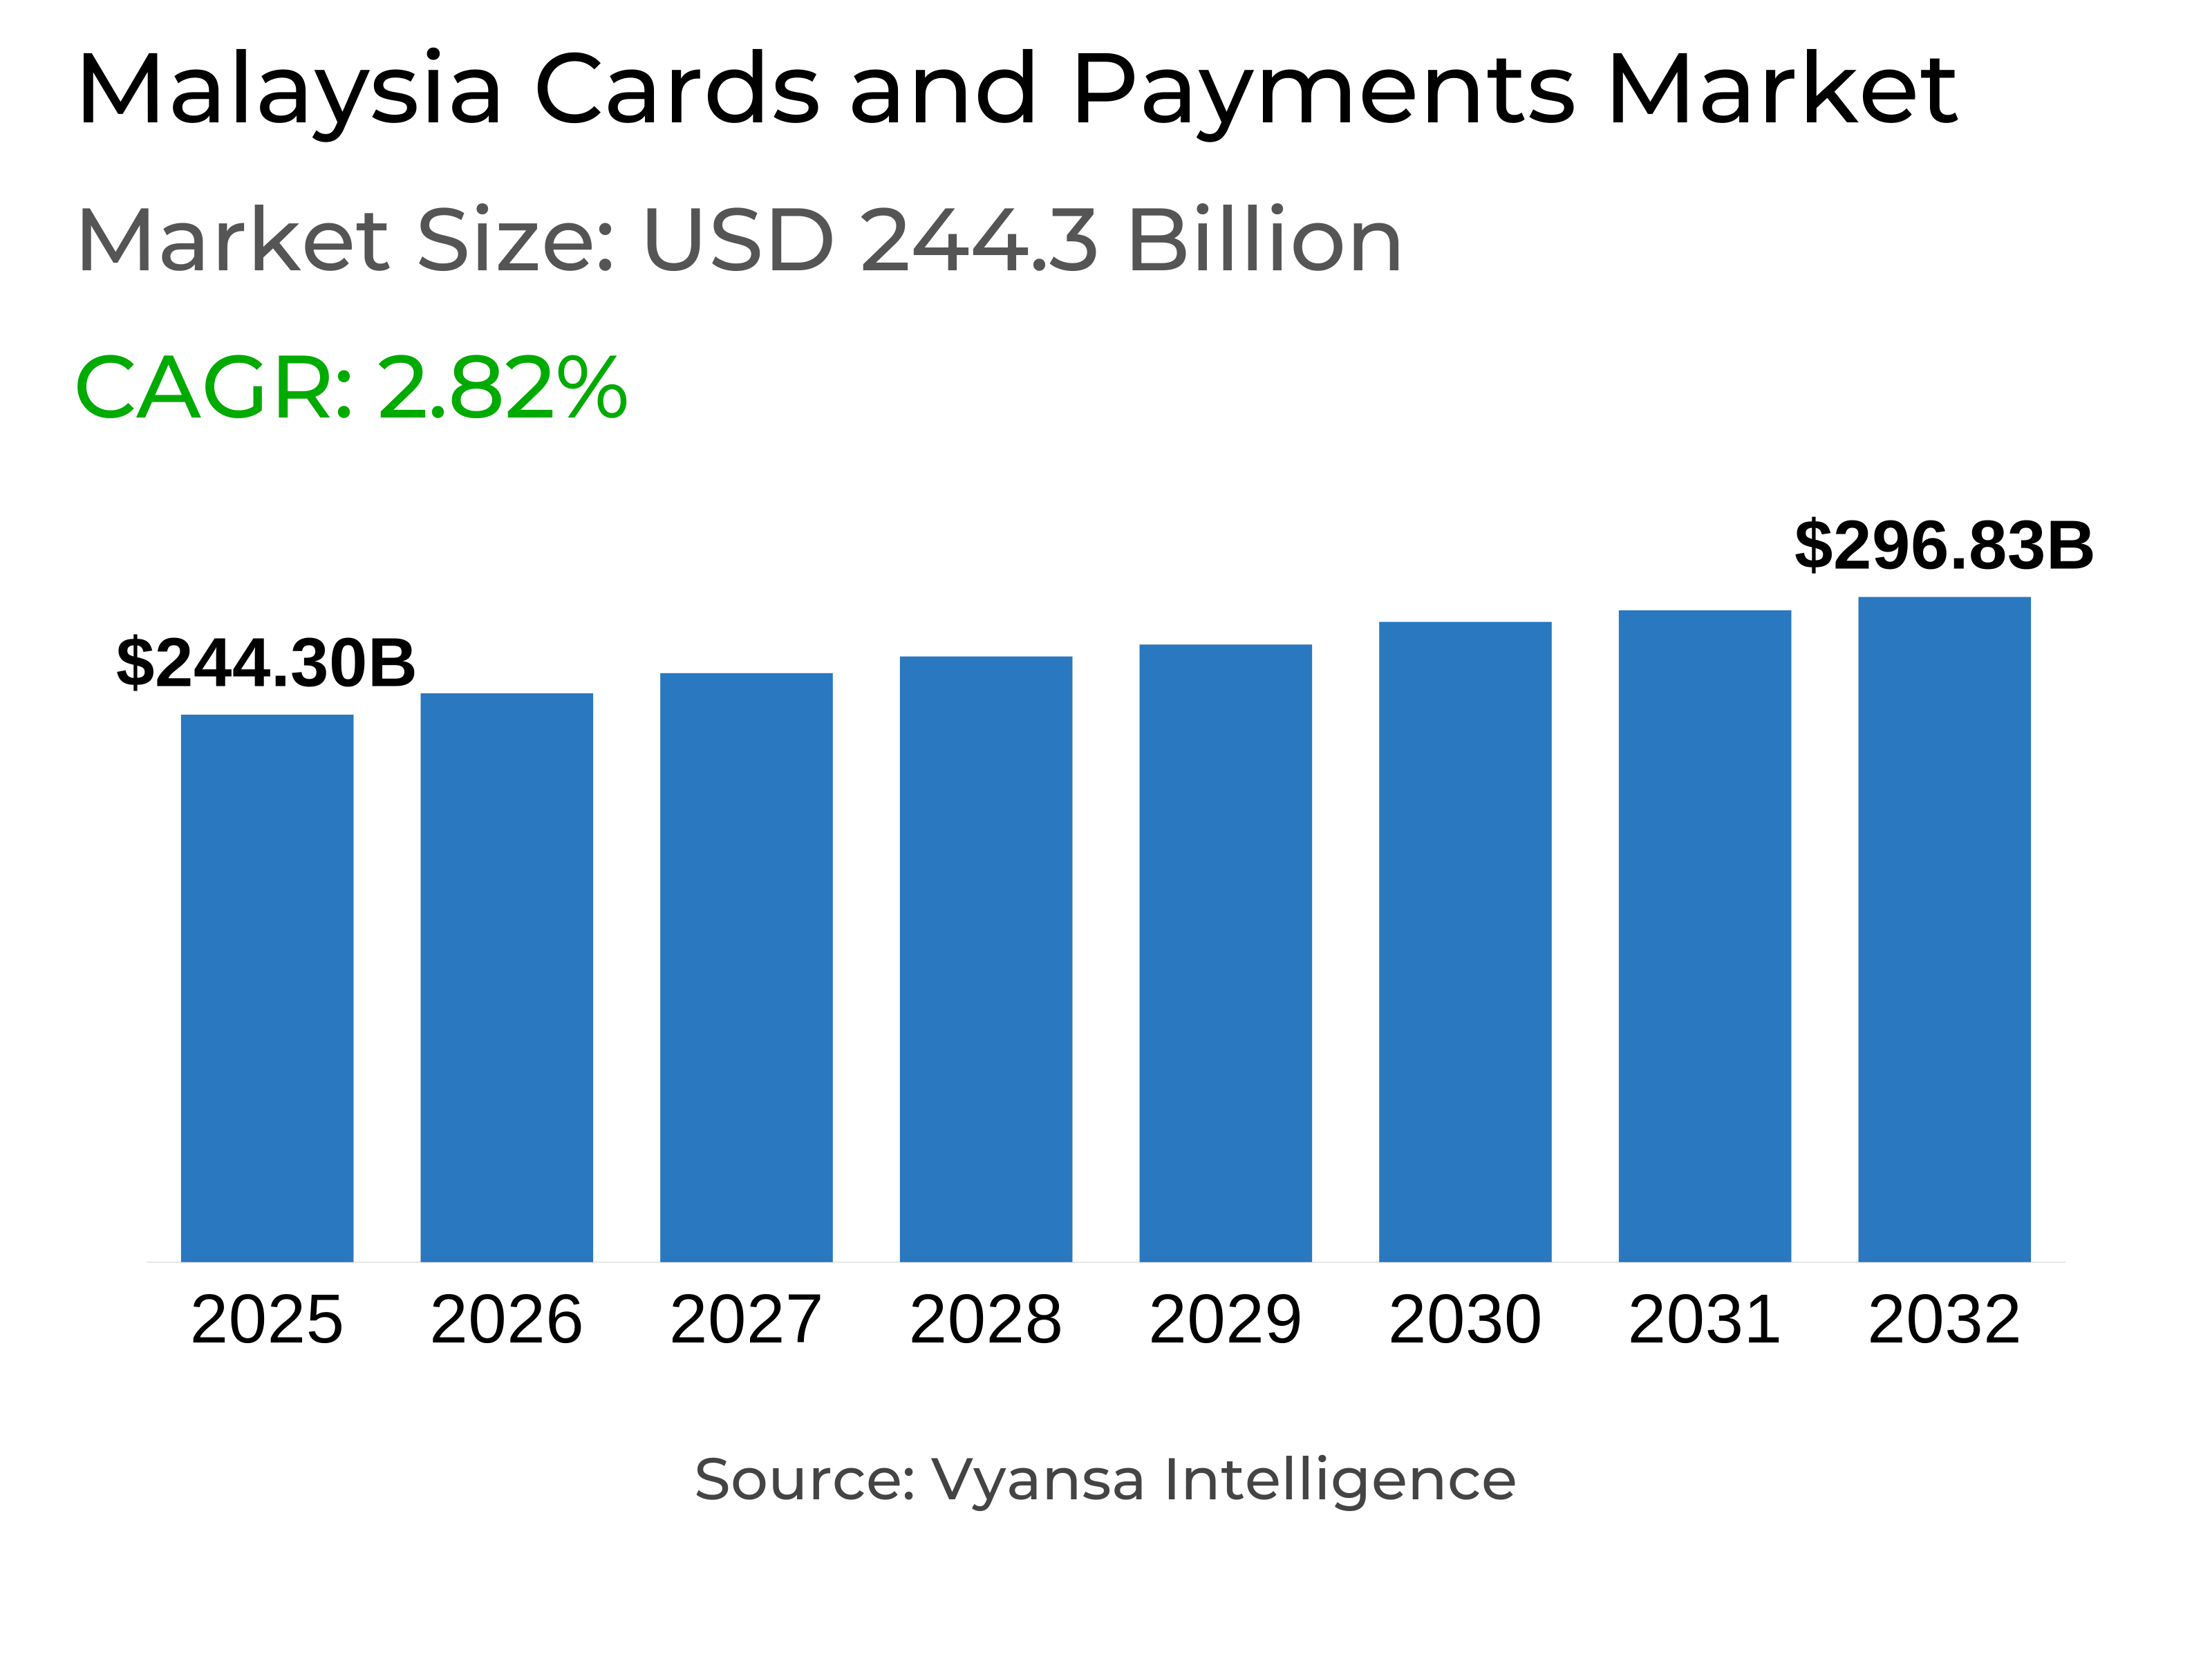
- Cards and Payments in Malaysia is estimated at $ 244.3 Billion.
- The market size is expected to grow to $ 296.83 Billion by 2032.
- Market to register a CAGR of around 2.82% during 2026-32.
- Instrument Type Shares
- Cards grabbed market share of 80%.
- Cards to witness a volume CAGR of around 2.07%.
- Competition
- More than 15 companies are actively engaged in producing Cards and Payments in Malaysia.
- Top 5 companies acquired 60% of the market share.
- CIMB Bank Bhd, Standard Chartered Bank Plc, Hong Leong Bank Bhd, Malayan Banking Bhd, United Overseas Bank (Malaysia) Bhd etc., are few of the top companies.
- Card Type
- Contactless Smart Card grabbed 75% of the market.
Malaysia Cards and Payments Market Outlook
The Malaysia card and payments market worth USD 244.3 billion would reach USD 296.83 billion by 2032 at a volume CAGR of 2.07%. The growth will be propelled by the nation's gradual move toward a cashless society, underpinned by digital infrastructure developments, government initiatives, and changing end user behavior. Digital payments are led by younger, digitally savvy Malaysians, who are opting for cashless payments due to their speed, convenience, and security.
Contactless smart cards lead the market with a 75% share, pointing toward how far end users have progressed toward tap-to-pay and digital. Use of mobile wallets based on QR code technology is also gaining pace, with operators like BigPay, Kiple, and Finexus launching innovative offerings. Wallets integrating popular apps like BigPay into the AirAsia Move platform have made digital payments even more convenient and within reach.
Government assistance continues to be the principal growth enabler. Efforts such as eBelia Rahmah and wage digitalisation schemes are increasing access, while lowered interchange fees are contributing to making card payments cheaper for both end users and merchants. Meanwhile, foreign players like Visa and Mastercard are still in control, but local suppliers are growing with custom-designed services like Merchantrade Money Biz Visa Business Prepaid Card, focusing on SMEs and niche markets.
In the future, digitalisation and financial inclusion will determine the cards and payments industry in Malaysia. Digital wallets, prepaid products, and new debit and credit offerings will gain traction while cash usage continues to slow down. As financial pressures intensify, credit cards will continue to be relevant for families, while prepaid and debit cards will attract young and price-sensitive end users. This well-balanced growth will create a healthy and diversified payments landscape by 2032.

Malaysia Cards and Payments Market Growth Driver
Government Drive Towards Cashless Economy
The Malaysian government is taking the lead in promoting the take-up of cashless payments as a part of its broader digital economy strategy. Under initiatives driven by the Central Bank of Malaysia, attempts are being made to bring digital payments closer to merchants and end users alike. The focus is specifically on dismantling barriers that have hitherto retarded take-up, setting the stage for financial cards and digital payment solutions to flourish.
This state-driven initiative is also stimulating the launch of multifaceted card products, especially credit and prepaid cards, to cater to various end user segments. By making favorable policies and reducing transaction costs, the government is making businesses and end users alike more likely to adopt cashless transactions. This robust regulatory support is a strong impetus for continued expansion in Malaysia's financial cards and payments space.
Malaysia Cards and Payments Market Trend
Increasing Mobile Wallet Use with QR Code Technology
Mobile wallets based on QR code technology are taking firm hold as a widely popular method of alternative to cash payments. Users are increasingly viewing them as safe and easy means of making everyday payments. Meanwhile, the market is experiencing greater numbers of wallet providers launching solutions in the forms of virtual cards and built-in payment systems. Solutions like the Kiple Visa Prepaid Card, MPay Mastercard Prepaid Card, and Finexus Money Visa/Mastercard Prepaid Card are driving this change.
Market leaders continue to evolve their products to gain more usage. An example is BigPay, which has incorporated its wallet into the AirAsia Move mobile application, enabling users to sign up and make payments without the necessity of a dedicated BigPay app. This product development marks the way providers are making cashless payments easier and more convenient for Malaysian users.
Unlock Market Intelligence
Explore the market potential with our data-driven report
Malaysia Cards and Payments Market Opportunity
Increasing Scope for Innovative Card Solutions
The global giants like Visa, Mastercard, and American Express dominating the market provide scope for ongoing product innovation in Malaysia card payments market. The global operators are already launching competitive products that align with evolving end user and business customer preferences. Their presence provides a constant flow of sophisticated products that support end user choice and spur further expansion of cashless payments.
Concurrently, local players are finding their niche in segments such as open-loop prepaid cards. These products, which tend to be combined with mobile wallets, are more flexible and accessible to users. One good example is Merchantrade Money Biz, the initiator of the first Visa Business Prepaid Card for SMEs. These developments underscore the increasing potential to create lifestyle-based products, such as travel-based or cashback-themed cards, and this is one key opportunity for market growth.
Unlock Market Intelligence
Explore the market potential with our data-driven report
Malaysia Cards and Payments Market Segmentation Analysis

By Instrument Type
- Cards
- Mobile Wallets
- Cheques
- Others
The segmentation with the highest market share under Instrument Type is Cards, with a market share of approximately 80%. Cards remain popular in Malaysia, buoyed by a forecast volume CAGR of almost 2.07%. Credit cards, specifically, are increasingly becoming necessary for households facing financial constraints, as they offer instalment payment terms and reward schemes that enhance the management of everyday expenses.
Prepaid and debit cards also feature prominently in the market, particularly among credit card-less users and younger generations. The cards provide more control over expenditure while introducing the digital economy to end users in a flexible manner. Charge cards, however, still remain restrictive to high-income end users with demand being relatively small in comparison to debit and credit cards given the limited number of local institutions that offer such products. This segmentation identifies the various needs influencing Malaysia's payments scene through cards.
Top Companies in Malaysia Cards and Payments Market
The top companies operating in the market include CIMB Bank Bhd, Standard Chartered Bank Plc, Hong Leong Bank Bhd, Malayan Banking Bhd, United Overseas Bank (Malaysia) Bhd, Touch 'n Go Sdn Bhd, HSBC Holdings Plc, Public Bank Bhd, AmBank Group, RHB Bank Bhd, etc., are the top players operating in the Malaysia Cards and Payments Market.
Frequently Asked Questions
Related Report
1. Market Segmentation
1.1. Research Scope
1.2. Research Methodology
1.3. Definitions and Assumptions
2. Executive Summary
3. Malaysia Cards and Payments Market Policies, Regulations, and Standards
4. Malaysia Cards and Payments Market Dynamics
4.1. Growth Factors
4.2. Challenges
4.3. Trends
4.4. Opportunities
5. Malaysia Cards and Payments Market Statistics, 2022-2032F
5.1. Market Size & Growth Outlook
5.1.1. By Revenues in US$ Million
5.2. Market Segmentation & Growth Outlook
5.2.1. By Instrument Type
5.2.1.1. Cards- Market Insights and Forecast 2022-2032, USD Million
5.2.1.1.1. Debit Card- Market Insights and Forecast 2022-2032, USD Million
5.2.1.1.2. Charge Card- Market Insights and Forecast 2022-2032, USD Million
5.2.1.1.3. ATM Card- Market Insights and Forecast 2022-2032, USD Million
5.2.1.1.4. Pre-Paid Card- Market Insights and Forecast 2022-2032, USD Million
5.2.1.1.5. Credit Card- Market Insights and Forecast 2022-2032, USD Million
5.2.1.1.6. Store Card- Market Insights and Forecast 2022-2032, USD Million
5.2.1.2. Mobile Wallets- Market Insights and Forecast 2022-2032, USD Million
5.2.1.3. Cheques- Market Insights and Forecast 2022-2032, USD Million
5.2.1.4. Others- Market Insights and Forecast 2022-2032, USD Million
5.2.2. By Card Type
5.2.2.1. Contact Smart Card- Market Insights and Forecast 2022-2032, USD Million
5.2.2.2. Contactless Smart Card- Market Insights and Forecast 2022-2032, USD Million
5.2.2.3. Non-Smart Card- Market Insights and Forecast 2022-2032, USD Million
5.2.3. By Type of Payments
5.2.3.1. B2B- Market Insights and Forecast 2022-2032, USD Million
5.2.3.2. B2C- Market Insights and Forecast 2022-2032, USD Million
5.2.3.3. C2C- Market Insights and Forecast 2022-2032, USD Million
5.2.3.4. C2B- Market Insights and Forecast 2022-2032, USD Million
5.2.3.4.1. E-commerce Shopping- Market Insights and Forecast 2022-2032, USD Million
5.2.3.4.2. Payment at POS Terminals- Market Insights and Forecast 2022-2032, USD Million
5.2.4. By Transaction Type
5.2.4.1. Domestic- Market Insights and Forecast 2022-2032, USD Million
5.2.4.2. Foreign- Market Insights and Forecast 2022-2032, USD Million
5.2.5. By Application
5.2.5.1. Food & Groceries- Market Insights and Forecast 2022-2032, USD Million
5.2.5.2. Health & Pharmacies- Market Insights and Forecast 2022-2032, USD Million
5.2.5.3. Travel & Tourism- Market Insights and Forecast 2022-2032, USD Million
5.2.5.4. Hospitality- Market Insights and Forecast 2022-2032, USD Million
5.2.5.5. Others (Media & Entertainment)- Market Insights and Forecast 2022-2032, USD Million
5.2.6. By Competitors
5.2.6.1. Competition Characteristics
5.2.6.2. Market Share & Analysis
6. Malaysia Cards Market Statistics, 2022-2032F
6.1. Market Size & Growth Outlook
6.1.1. By Revenues in US$ Million
6.2. Market Segmentation & Growth Outlook
6.2.1. By Card Type- Market Insights and Forecast 2022-2032, USD Million
6.2.2. By Type of Payments- Market Insights and Forecast 2022-2032, USD Million
6.2.3. By Transaction Type- Market Insights and Forecast 2022-2032, USD Million
6.2.4. By Application- Market Insights and Forecast 2022-2032, USD Million
7. Malaysia Mobile Wallets Market Statistics, 2022-2032F
7.1. Market Size & Growth Outlook
7.1.1. By Revenues in US$ Million
7.2. Market Segmentation & Growth Outlook
7.2.1. By Type of Payments- Market Insights and Forecast 2022-2032, USD Million
7.2.2. By Transaction Type- Market Insights and Forecast 2022-2032, USD Million
7.2.3. By Application- Market Insights and Forecast 2022-2032, USD Million
8. Malaysia Cheques Market Statistics, 2022-2032F
8.1. Market Size & Growth Outlook
8.1.1. By Revenues in US$ Million
8.2. Market Segmentation & Growth Outlook
8.2.1. By Type of Payments- Market Insights and Forecast 2022-2032, USD Million
8.2.2. By Transaction Type- Market Insights and Forecast 2022-2032, USD Million
8.2.3. By Application- Market Insights and Forecast 2022-2032, USD Million
9. Competitive Outlook
9.1. Company Profiles
9.1.1. Malayan Banking Bhd
9.1.1.1. Business Description
9.1.1.2. Product Portfolio
9.1.1.3. Collaborations & Alliances
9.1.1.4. Recent Developments
9.1.1.5. Financial Details
9.1.1.6. Others
9.1.2. United Overseas Bank (Malaysia) Bhd
9.1.2.1. Business Description
9.1.2.2. Product Portfolio
9.1.2.3. Collaborations & Alliances
9.1.2.4. Recent Developments
9.1.2.5. Financial Details
9.1.2.6. Others
9.1.3. Touch 'n Go Sdn Bhd
9.1.3.1. Business Description
9.1.3.2. Product Portfolio
9.1.3.3. Collaborations & Alliances
9.1.3.4. Recent Developments
9.1.3.5. Financial Details
9.1.3.6. Others
9.1.4. HSBC Holdings Plc
9.1.4.1. Business Description
9.1.4.2. Product Portfolio
9.1.4.3. Collaborations & Alliances
9.1.4.4. Recent Developments
9.1.4.5. Financial Details
9.1.4.6. Others
9.1.5. Public Bank Bhd
9.1.5.1. Business Description
9.1.5.2. Product Portfolio
9.1.5.3. Collaborations & Alliances
9.1.5.4. Recent Developments
9.1.5.5. Financial Details
9.1.5.6. Others
9.1.6. CIMB Bank Bhd
9.1.6.1. Business Description
9.1.6.2. Product Portfolio
9.1.6.3. Collaborations & Alliances
9.1.6.4. Recent Developments
9.1.6.5. Financial Details
9.1.6.6. Others
9.1.7. Standard Chartered Bank Plc
9.1.7.1. Business Description
9.1.7.2. Product Portfolio
9.1.7.3. Collaborations & Alliances
9.1.7.4. Recent Developments
9.1.7.5. Financial Details
9.1.7.6. Others
9.1.8. Hong Leong Bank Bhd
9.1.8.1. Business Description
9.1.8.2. Product Portfolio
9.1.8.3. Collaborations & Alliances
9.1.8.4. Recent Developments
9.1.8.5. Financial Details
9.1.8.6. Others
9.1.9. AmBank Group
9.1.9.1. Business Description
9.1.9.2. Product Portfolio
9.1.9.3. Collaborations & Alliances
9.1.9.4. Recent Developments
9.1.9.5. Financial Details
9.1.9.6. Others
9.1.10. RHB Bank Bhd
9.1.10.1. Business Description
9.1.10.2. Product Portfolio
9.1.10.3. Collaborations & Alliances
9.1.10.4. Recent Developments
9.1.10.5. Financial Details
9.1.10.6. Others
10. Disclaimer
| Segment | Sub-Segment |
|---|---|
| By Instrument Type |
|
| By Card Type |
|
| By Type of Payments |
|
| By Transaction Type |
|
| By Application |
|
Research Methodology
This study followed a structured approach comprising four key phases to assess the size and scope of the electro-oxidation market. The process began with thorough secondary research to collect data on the target market, related markets, and broader industry context. These findings, along with preliminary assumptions and estimates, were then validated through extensive primary research involving industry experts from across the value chain. To calculate the overall market size, both top-down and bottom-up methodologies were employed. Finally, market segmentation and data triangulation techniques were applied to refine and validate segment-level estimations.
Secondary Research
The secondary research phase involved gathering data from a wide range of credible and published sources. This step helped in identifying industry trends, defining market segmentation, and understanding the market landscape and value chain.
Sources consulted during this phase included:
- Company annual reports, investor presentations, and press releases
- Industry white papers and certified publications
- Trade directories and market-recognized databases
- Articles from authoritative authors and reputable journals
- Gold and silver standard websites
Secondary research was critical in mapping out the industry's value chain and monetary flow, identifying key market segments, understanding regional variations, and tracking significant industry developments.
Other key sources:
- Financial disclosures
- Industry associations and trade bodies
- News outlets and business magazines
- Academic journals and research studies
- Paid industry databases
Primary Research
To validate secondary data and gain deeper market insights, primary research was conducted with key stakeholders across both the supply and demand sides of the market.
On the demand side, participants included decision-makers and influencers from end-user industries—such as CIOs, CTOs, and CSOs—who provided first-hand perspectives on market needs, product usage, and future expectations.
On the supply side, interviews were conducted with manufacturers, industry associations, and institutional participants to gather insights into current offerings, product pipelines, and market challenges.
Primary interviews provided critical inputs such as:
- Market size and revenue data
- Product and service breakdowns
- Market forecasts
- Regional and application-specific trends
Stakeholders consulted included:
- Leading OEM and solution providers
- Channel and distribution partners
- End users across various applications
- Independent consultants and industry specialists
Market Size Estimation and Data Triangulation
- Identifying Key Market Participants (Secondary Research)
- Goal: To identify the major players or companies in the target market. This typically involves using publicly available data sources such as industry reports, market research publications, and financial statements of companies.
- Tools: Reports from firms like Gartner, Forrester, Euromonitor, Statista, IBISWorld, and others. Public financial statements, news articles, and press releases from top market players.
- Extracting Earnings of Key Market Participants
- Goal: To estimate the earnings generated from the product or service being analyzed. This step helps in understanding the revenue potential of each market player in a specific geography.
- Methods: Earnings data can be gathered from:
- Publicly available financial reports (for listed companies).
- Interviews and primary data sources from professionals, such as Directors, VPs, SVPs, etc. This is especially useful for understanding more nuanced, internal data that isn't publicly disclosed.
- Annual reports and investor presentations of key players.
- Data Collation and Development of a Relevant Data Model
- Goal: To collate inputs from both primary and secondary sources into a structured, data-driven model for market estimation. This model will incorporate key market KPIs and any independent variables relevant to the market.
- Key KPIs: These could include:
- Market size, growth rate, and demand drivers.
- Industry-specific metrics like market share, average revenue per customer (ARPC), or average deal size.
- External variables, such as economic growth rates, inflation rates, or commodity prices, that could affect the market.
- Data Modeling: Based on this data, the market forecasts are developed for the next 5 years. A combination of trend analysis, scenario modeling, and statistical regression might be used to generate projections.
- Scenario Analysis
- Goal: To test different assumptions and validate how sensitive the market is to changes in key variables (e.g., market demand, regulatory changes, technological disruptions).
- Types of Scenarios:
- Base Case: Based on current assumptions and historical data.
- Best-Case Scenario: Assuming favorable market conditions, regulatory environments, and technological advancements.
- Worst-Case Scenario: Accounting for adverse factors, such as economic downturns, stricter regulations, or unexpected disruptions.


