Global Magnesium Turnings Market Report: Trends, Growth and Forecast (2026-2032)
By Grade (Industrial Grade, Aerospace Grade), By Application (Recycling, Metal Industry, Chemical Applications), By End-Use Industry (Automotive, Aerospace, Chemical Manufacturing), By Region (North America, South America, Europe, Asia Pacific) ... Read more
|
Major Players
|
Global Magnesium Turnings Market Statistics and Insights, 2026
- Market Size Statistics
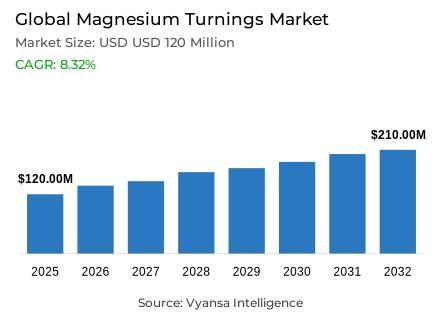
- Global magnesium turnings market is estimated at USD 120 million in 2025.
- The market size is expected to grow to USD 210 million by 2032.
- Market to register a CAGR of around 8.32% during 2026-32.
- Grade Shares
- Industrial grade grabbed market share of 65%.
- Competition
- Global magnesium turnings market is currently being catered to by more than 20 companies.
- Top 5 companies acquired around 60% of the market share.
- AMAC Metallurgy; Luxfer Group; Atlantic Magnesium Corporation; Hydro Magnesium; Showa Denko K.K. etc., are few of the top companies.
- Application
- Recycling grabbed 45% of the market.
- Region
- Asia Pacific leads with a 45% share of the global market.
Global Magnesium Turnings Market Outlook
The Global magnesium turnings market is estimated at USD 120 million in 2025 and is projeted around USD 210 million in 2032, which translates to a CAGR of about 8.32% between 2026 and 2032. This trend indicates a demand that is based on structural aspects and not on short-term fluctuations. Magnesium turnings are an important feedstock in alloy fabrication and casting processes, where consistent material behavior is required. The expansion of the market is strictly associated with the long-term trends of industrial application, especially in those industries where material efficiency, weight reduction, and reliable alloy chemistry are important.
The greatest underlying driver of demand during the forecast horizon is automotive lightweighting. To reduce the total weight of the vehicle, manufacturers are progressively using magnesium-based components without compromising the structural integrity. Magnesium turnings enable foundries to achieve accurate alloy compositions in powertrain housings, transmission cases, and interior structures. This application-based demand maintains a consistent base consumption despite changes in the volume of vehicle production, which strengthens market resilience between 2026 and 2032.
In terms of grade, industrial grade magnesium turnings have a leading market share of 65%, which highlights their applicability in large scale casting, aluminum alloy production, and metallurgical uses. These grades meet functional purity criteria and are cost effective, making them the favorite of high-volume industrial end users. The supply of industrial-grade turnings is further maintained by secondary processing routes, which strengthens their central position as the foundation of the total market demand.
In applications, recycling makes up 45% of the market, highlighting the growing importance of secondary magnesium recovery. Recycled turnings are widely used in chemical, metallurgical, and specialty industry processes where practical performance is more important than the need to achieve ultra-high purity. The Asia Pacific region controls the global market with a 45% share, which is supported by the leading primary production capacity of China and strong integration with downstream manufacturing, making the region the key driver of global supply and pricing trends up to 2032.

Global Magnesium Turnings Market Growth Driver
Automotive Lightweighting as a Core Demand Catalyst
Automotive lightweighting remains the main structural force that keeps the magnesium turnings market in the world in demand with end users in the vehicle manufacturing industry focusing more on mass reduction to achieve efficiency and emission requirements. Magnesium castings account for nearly 65% of total US magnesium consumption, with structural automotive components representing the dominant application. Material specifications that are engineering-led also support this requirement, with the density benefit of magnesium over aluminium offering quantifiable performance benefits that can be offset by increased material costs in critical parts.
Despite the existence of unused international primary smelter capacity, automotive end users continue to consume a steady amount of turnings to facilitate accuracy alloy blending and casting quality. This pull, which is application-based, creates structural demand resilience based on regulatory efficiency standards and long-term vehicle platform design priorities instead of cyclical market fluctuations.
Global Magnesium Turnings Market Challenge
Structural Supply Vulnerability from Domestic Production Erosion
Supply-side constraints emerge as a key constraint that determines the Global magnesium turnings market, especially after the failure of domestic primary magnesium production in the United States. In 2022, the shutdown of the Great Salt Lake smelter became the only major source, pushing the country to more than 75% of apparent consumption, which relies on imports. This interference directly limited the availability of primary-origin turnings, compelling downstream manufacturers to depend nearly solely on secondary recovery and foreign suppliers. The concentration of imports in Israel at about 40%, Turkey at 34% and Russia at 12% subjects the end users to geopolitical risk and price fluctuations that are not under their control.
The loss of domestic primary supply is not compensated by the secondary recovery volumes of about 113,000 metric tons per annum, both of old and new scrap. This imbalance creates a long-term structural tightness of magnesium turnings particularly those that need to be sourced securely domestically like defence-related castings. The lack of the primary infrastructure creates a long-term limitation that is not tied to the global commodity cycles.
Unlock Market Intelligence
Explore the market potential with our data-driven report
Global Magnesium Turnings Market Trend
Recycling-Led Stabilization of Turnings Supply Chains
A key structural trend that is influencing the market is the increased dependence on secondary magnesium recovery to stabilise the supply of turnings. In 2024, the United States recovered about 113,000 metric tons of secondary magnesium, of which about 86,000 tons were new scrap and 27,000 tons were old scrap. About half of this recovery is due to the processing of aluminium-based alloys, in which magnesium-bearing scrap yields turnings as a by-product of remelting. This integration incorporates magnesium recovery into existing aluminium recycling processes, minimizing technological scale effects.
The distribution of close to 45% of secondary magnesium to structural uses underscores a consistent downstream consumption among automotive and industrial final consumers. Instead of new technologies, the current trend focuses on infrastructure optimisation, better scrap collection, and sorting efficiency. This supports recycling as a structural stabiliser, which allows continuity of turnings supply despite the geographical concentration of primary production and its domestic limitation.
Global Magnesium Turnings Market Opportunity
Government-Backed Pathways for Domestic Supply Rebalancing
Policy intervention is creating a progressive direction in the diversification of supply in the magnesium turnings market in the world. In February 2024, the United States Department of Defense awarded USD 28 million under the Defense Production Act Title III programme to develop pilot-scale magnesium recovery in sea brine. By June 2024, the entity supported had produced and sold commercial-quality magnesium metal, demonstrating technical feasibility outside traditional pyrometallurgical pathways. This achievement indicates that future domestic turnings production can be supported by alternative extraction technologies.
The project indicates a clear awareness of magnesium as a strategic material with a concentrated global supply risk. Collaborations with salt farmers who harvest magnesium chloride in the sea also point to a commercial architecture that can be scaled. To automotive and industrial end users, it is an indicator of possible long-term supply security in line with electrification and lightweighting trends. Although short-term volumes are constrained, capital mobilization supported by regulations creates a plausible basis of structural import reduction.
Global Magnesium Turnings Market Regional Analysis

By Region
- North America
- South America
- Europe
- Asia Pacific
Asia Pacific represents approximately 45% of the regional share in the Global magnesium turnings market, supported by China’s overwhelming primary production capacity and downstream manufacturing integration. China operates about 1,800 thousand metric tons of installed capacity and produced roughly 950 thousand metric tons in 2024, representing close to 85% of global capacity. This concentration underpins regional supply leadership and supports integrated ecosystems spanning automotive die-casting, aluminum alloy foundries, and specialty manufacturing. Proximity between primary production and end-use processing enables efficient logistics and stable turnings availability.
While Turkey and Israel maintain notable capacities of 615 thousand and 634 thousand metric tons respectively, their downstream manufacturing integration remains limited compared to Asia-Pacific. The region’s advantage extends beyond volume into value-chain depth, where magnesium turnings are rapidly converted into finished components near production sites, reinforcing Asia-Pacific’s strategic influence over global supply dynamics and pricing structures.
Unlock Market Intelligence
Explore the market potential with our data-driven report
Global Magnesium Turnings Market Segmentation Analysis
By Grade
- Industrial Grade
- Aerospace Grade
Industrial-grade magnesium turnings dominate the Global magnesium turnings market, accounting for approximately 65% of overall deployment. This dominance reflects concentration in applications such as automotive casting, aluminum alloy production, and steel desulfurization, where purity levels around 99.9% meet functional performance requirements. Secondary processing routes reliably deliver this grade, enabling cost-effective alloy blending for foundries and metallurgical operations. This reinforces industrial-grade turnings as the backbone of market demand.
Secondary sources further support this dominance, as industrial scrap streams yield consistent-quality turnings suitable for structural and alloying applications. Recovered magnesium from these streams continues to play a critical role in supporting aluminum alloy production across transportation and industrial segments. This grade concentration reflects stable, specification-driven demand from end users whose production processes require predictable material performance rather than ultra-high purity characteristics.

By Application
- Recycling
- Metal Industry
- Chemical Applications
Recycling application accounts for approximately 45% of global demand in the Global magnesium turnings market, reflecting its role as a specialized application stream distinct from primary casting and structural automotive uses. Recycled magnesium turnings are widely deployed in pharmaceutical synthesis, Grignard reagent preparation for organometallic chemistry, water purification as a reducing agent, and niche metallurgical processes where functional reactivity and acceptable purity thresholds differentiate requirements from high-precision structural components. These applications rely on secondary feedstock characteristics rather than tight dimensional or mechanical tolerances, allowing end users to prioritize availability and cost efficiency. As a result, recycling-oriented applications form a stable demand base supported by diverse industrial workflows outside automotive manufacturing.
Approximately 50% of secondary magnesium turnings originates from aluminum-base alloy scrap processed through secondary aluminum smelters, where magnesium is recovered as a byproduct rather than a primary output. This sourcing model creates a cost-advantaged supply architecture for recycling applications, as recovery is embedded within existing aluminum processing infrastructure. The remaining 55% of turnings demand is allocated to non-recycling applications, reinforcing recycling-sourced turnings as composition-flexible feedstock suited to applications with adaptable material specifications.
Market Players in Global Magnesium Turnings Market
These market players maintain a significant presence in the Global magnesium turnings market sector and contribute to its ongoing evolution.
- AMAC Metallurgy
- Luxfer Group
- Atlantic Magnesium Corporation
- Hydro Magnesium
- Showa Denko K.K.
- US Magnesium LLC
- Timminco Limited
- Advanced Magnesium Alloys
- Zhangjiagang Huachang Metal Powder
- Anhui Tianyu Magnesium Powder
- Iluka Resources
- Daiki Aluminium Co. Ltd.
- POSCO
- Alcoa Corporation
- RIMA Group
Market News & Updates
- Luxfer Group, 2025:
Luxfer Holdings reported a significant confidence upgrade in its financial trajectory on October 27, 2025, announcing an increase in full-year 2025 Adjusted EPS guidance to $1.04–$1.08 (from previous guidance of $0.97–$1.05) and raising Adjusted EBITDA guidance to $50–$51 million. This guidance boost reflects the company's successful pivot toward high-value aerospace, defense, and specialty industrial markets following the completion of its Graphic Arts business sale, alongside the establishment of a Powders Center of Excellence within its Elektron division that is expected to deliver approximately $2 million in annual savings. The improvement demonstrates Luxfer's disciplined operational execution and sustained momentum in its core Elektron and Gas Cylinders segments, which generated strong sequential margin expansion and double-digit EPS growth during Q3 2025.
- RIMA Group, 2025:
RIMA Industrial, Brazil's primary magnesium producer and the only such manufacturer in the Southern Hemisphere, substantially strengthened its market position in February 2025 through a strategic partnership with SIMPAC Group (a South Korean ferroalloy manufacturer) for the development and commercialization of high-purity ferro silicon products. This joint venture collaboration enables RIMA to leverage its vertically integrated dolomite extraction and processing capabilities alongside SIMPAC's ferrosilicon metallurgical expertise to serve the automotive, aerospace, and specialty alloys sectors. Concurrent with this partnership, RIMA maintained comprehensive quality and safety certifications including ISO 9001 (quality management), ISO 14001 (environmental management), ISO 45001 (occupational health and safety), and IATF 16949 (automotive quality standards), positioning the company as a fully compliant supplier across demanding industrial verticals.
Frequently Asked Questions
Related Report
1. Market Segmentation
1.1. Research Scope
1.2. Research Methodology
1.3. Definitions and Assumptions
2. Executive Summary
3. Global Magnesium Turnings Market Policies, Regulations, and Standards
4. Global Magnesium Turnings Market Dynamics
4.1. Growth Factors
4.2. Challenges
4.3. Trends
4.4. Opportunities
5. Global Magnesium Turnings Market Statistics, 2022-2032F
5.1. Market Size & Growth Outlook
5.1.1.By Revenues in USD Million
5.2. Market Segmentation & Growth Outlook
5.2.1.By Grade
5.2.1.1. Industrial Grade- Market Insights and Forecast 2022-2032, USD Million
5.2.1.2. Aerospace Grade- Market Insights and Forecast 2022-2032, USD Million
5.2.2.By Application
5.2.2.1. Recycling- Market Insights and Forecast 2022-2032, USD Million
5.2.2.2. Metal Industry- Market Insights and Forecast 2022-2032, USD Million
5.2.2.3. Chemical Applications- Market Insights and Forecast 2022-2032, USD Million
5.2.3.By End-Use Industry
5.2.3.1. Automotive- Market Insights and Forecast 2022-2032, USD Million
5.2.3.2. Aerospace- Market Insights and Forecast 2022-2032, USD Million
5.2.3.3. Chemical Manufacturing- Market Insights and Forecast 2022-2032, USD Million
5.2.4.By Region
5.2.4.1. North America
5.2.4.2. South America
5.2.4.3. Europe
5.2.4.4. Asia Pacific
5.2.5.By Competitors
5.2.5.1. Competition Characteristics
5.2.5.2. Market Share & Analysis
6. North America Magnesium Turnings Market Statistics, 2022-2032F
6.1. Market Size & Growth Outlook
6.1.1.By Revenues in USD Million
6.2. Market Segmentation & Growth Outlook
6.2.1.By Grade- Market Insights and Forecast 2022-2032, USD Million
6.2.2.By Application- Market Insights and Forecast 2022-2032, USD Million
6.2.3.By End-Use Industry- Market Insights and Forecast 2022-2032, USD Million
6.2.4.By Country
6.2.4.1. US
6.2.4.2. Canada
6.2.4.3. Mexico
6.2.4.4. Rest of North America
6.3. US Magnesium Turnings Market Statistics, 2022-2032F
6.3.1.Market Size & Growth Outlook
6.3.1.1. By Revenues in USD Million
6.3.2.Market Segmentation & Growth Outlook
6.3.2.1. By Grade- Market Insights and Forecast 2022-2032, USD Million
6.3.2.2. By Application- Market Insights and Forecast 2022-2032, USD Million
6.3.2.3. By End-Use Industry- Market Insights and Forecast 2022-2032, USD Million
6.4. Canada Magnesium Turnings Market Statistics, 2022-2032F
6.4.1.Market Size & Growth Outlook
6.4.1.1. By Revenues in USD Million
6.4.2.Market Segmentation & Growth Outlook
6.4.2.1. By Grade- Market Insights and Forecast 2022-2032, USD Million
6.4.2.2. By Application- Market Insights and Forecast 2022-2032, USD Million
6.4.2.3. By End-Use Industry- Market Insights and Forecast 2022-2032, USD Million
6.5. Mexico Magnesium Turnings Market Statistics, 2022-2032F
6.5.1.Market Size & Growth Outlook
6.5.1.1. By Revenues in USD Million
6.5.2.Market Segmentation & Growth Outlook
6.5.2.1. By Grade- Market Insights and Forecast 2022-2032, USD Million
6.5.2.2. By Application- Market Insights and Forecast 2022-2032, USD Million
6.5.2.3. By End-Use Industry- Market Insights and Forecast 2022-2032, USD Million
7. South America Magnesium Turnings Market Statistics, 2022-2032F
7.1. Market Size & Growth Outlook
7.1.1.By Revenues in USD Million
7.2. Market Segmentation & Growth Outlook
7.2.1.By Grade- Market Insights and Forecast 2022-2032, USD Million
7.2.2.By Application- Market Insights and Forecast 2022-2032, USD Million
7.2.3.By End-Use Industry- Market Insights and Forecast 2022-2032, USD Million
7.2.4.By Country
7.2.4.1. Brazil
7.2.4.2. Rest of South America
7.3. Brazil Magnesium Turnings Market Statistics, 2022-2032F
7.3.1.Market Size & Growth Outlook
7.3.1.1. By Revenues in USD Million
7.3.2.Market Segmentation & Growth Outlook
7.3.2.1. By Grade- Market Insights and Forecast 2022-2032, USD Million
7.3.2.2. By Application- Market Insights and Forecast 2022-2032, USD Million
7.3.2.3. By End-Use Industry- Market Insights and Forecast 2022-2032, USD Million
8. Europe Magnesium Turnings Market Statistics, 2022-2032F
8.1. Market Size & Growth Outlook
8.1.1.By Revenues in USD Million
8.2. Market Segmentation & Growth Outlook
8.2.1.By Grade- Market Insights and Forecast 2022-2032, USD Million
8.2.2.By Application- Market Insights and Forecast 2022-2032, USD Million
8.2.3.By End-Use Industry- Market Insights and Forecast 2022-2032, USD Million
8.2.4.By Country
8.2.4.1. Germany
8.2.4.2. France
8.2.4.3. UK
8.2.4.4. Italy
8.2.4.5. Spain
8.2.4.6. Netherlands
8.2.4.7. Belgium
8.2.4.8. Poland
8.2.4.9. Russia
8.2.4.10. Turkey
8.2.4.11. Rest of Europe
8.3. Germany Magnesium Turnings Market Statistics, 2022-2032F
8.3.1.Market Size & Growth Outlook
8.3.1.1. By Revenues in USD Million
8.3.2.Market Segmentation & Growth Outlook
8.3.2.1. By Grade- Market Insights and Forecast 2022-2032, USD Million
8.3.2.2. By Application- Market Insights and Forecast 2022-2032, USD Million
8.3.2.3. By End-Use Industry- Market Insights and Forecast 2022-2032, USD Million
8.4. France Magnesium Turnings Market Statistics, 2022-2032F
8.4.1.Market Size & Growth Outlook
8.4.1.1. By Revenues in USD Million
8.4.2.Market Segmentation & Growth Outlook
8.4.2.1. By Grade- Market Insights and Forecast 2022-2032, USD Million
8.4.2.2. By Application- Market Insights and Forecast 2022-2032, USD Million
8.4.2.3. By End-Use Industry- Market Insights and Forecast 2022-2032, USD Million
8.5. UK Magnesium Turnings Market Statistics, 2022-2032F
8.5.1.Market Size & Growth Outlook
8.5.1.1. By Revenues in USD Million
8.5.2.Market Segmentation & Growth Outlook
8.5.2.1. By Grade- Market Insights and Forecast 2022-2032, USD Million
8.5.2.2. By Application- Market Insights and Forecast 2022-2032, USD Million
8.5.2.3. By End-Use Industry- Market Insights and Forecast 2022-2032, USD Million
8.6. Italy Magnesium Turnings Market Statistics, 2022-2032F
8.6.1.Market Size & Growth Outlook
8.6.1.1. By Revenues in USD Million
8.6.2.Market Segmentation & Growth Outlook
8.6.2.1. By Grade- Market Insights and Forecast 2022-2032, USD Million
8.6.2.2. By Application- Market Insights and Forecast 2022-2032, USD Million
8.6.2.3. By End-Use Industry- Market Insights and Forecast 2022-2032, USD Million
8.7. Spain Magnesium Turnings Market Statistics, 2022-2032F
8.7.1.Market Size & Growth Outlook
8.7.1.1. By Revenues in USD Million
8.7.2.Market Segmentation & Growth Outlook
8.7.2.1. By Grade- Market Insights and Forecast 2022-2032, USD Million
8.7.2.2. By Application- Market Insights and Forecast 2022-2032, USD Million
8.7.2.3. By End-Use Industry- Market Insights and Forecast 2022-2032, USD Million
8.8. Netherlands Magnesium Turnings Market Statistics, 2022-2032F
8.8.1.Market Size & Growth Outlook
8.8.1.1. By Revenues in USD Million
8.8.2.Market Segmentation & Growth Outlook
8.8.2.1. By Grade- Market Insights and Forecast 2022-2032, USD Million
8.8.2.2. By Application- Market Insights and Forecast 2022-2032, USD Million
8.8.2.3. By End-Use Industry- Market Insights and Forecast 2022-2032, USD Million
8.9. Belgium Magnesium Turnings Market Statistics, 2022-2032F
8.9.1.Market Size & Growth Outlook
8.9.1.1. By Revenues in USD Million
8.9.2.Market Segmentation & Growth Outlook
8.9.2.1. By Grade- Market Insights and Forecast 2022-2032, USD Million
8.9.2.2. By Application- Market Insights and Forecast 2022-2032, USD Million
8.9.2.3. By End-Use Industry- Market Insights and Forecast 2022-2032, USD Million
8.10. Poland Magnesium Turnings Market Statistics, 2022-2032F
8.10.1. Market Size & Growth Outlook
8.10.1.1. By Revenues in USD Million
8.10.2. Market Segmentation & Growth Outlook
8.10.2.1. By Grade- Market Insights and Forecast 2022-2032, USD Million
8.10.2.2. By Application- Market Insights and Forecast 2022-2032, USD Million
8.10.2.3. By End-Use Industry- Market Insights and Forecast 2022-2032, USD Million
8.11. Russia Magnesium Turnings Market Statistics, 2022-2032F
8.11.1. Market Size & Growth Outlook
8.11.1.1. By Revenues in USD Million
8.11.2. Market Segmentation & Growth Outlook
8.11.2.1. By Grade- Market Insights and Forecast 2022-2032, USD Million
8.11.2.2. By Application- Market Insights and Forecast 2022-2032, USD Million
8.11.2.3. By End-Use Industry- Market Insights and Forecast 2022-2032, USD Million
8.12. Turkey Magnesium Turnings Market Statistics, 2022-2032F
8.12.1. Market Size & Growth Outlook
8.12.1.1. By Revenues in USD Million
8.12.2. Market Segmentation & Growth Outlook
8.12.2.1. By Grade- Market Insights and Forecast 2022-2032, USD Million
8.12.2.2. By Application- Market Insights and Forecast 2022-2032, USD Million
8.12.2.3. By End-Use Industry- Market Insights and Forecast 2022-2032, USD Million
9. Asia Pacific Magnesium Turnings Market Statistics, 2022-2032F
9.1. Market Size & Growth Outlook
9.1.1.By Revenues in USD Million
9.2. Market Segmentation & Growth Outlook
9.2.1.By Grade- Market Insights and Forecast 2022-2032, USD Million
9.2.2.By Application- Market Insights and Forecast 2022-2032, USD Million
9.2.3.By End-Use Industry- Market Insights and Forecast 2022-2032, USD Million
9.2.4.By Country
9.2.4.1. China
9.2.4.2. Japan
9.2.4.3. India
9.2.4.4. South Korea
9.2.4.5. Australia
9.2.4.6. Thailand
9.2.4.7. Rest of Asia Pacific
9.3. China Magnesium Turnings Market Statistics, 2022-2032F
9.3.1.Market Size & Growth Outlook
9.3.1.1. By Revenues in USD Million
9.3.2.Market Segmentation & Growth Outlook
9.3.2.1. By Grade- Market Insights and Forecast 2022-2032, USD Million
9.3.2.2. By Application- Market Insights and Forecast 2022-2032, USD Million
9.3.2.3. By End-Use Industry- Market Insights and Forecast 2022-2032, USD Million
9.4. Japan Magnesium Turnings Market Statistics, 2022-2032F
9.4.1.Market Size & Growth Outlook
9.4.1.1. By Revenues in USD Million
9.4.2.Market Segmentation & Growth Outlook
9.4.2.1. By Grade- Market Insights and Forecast 2022-2032, USD Million
9.4.2.2. By Application- Market Insights and Forecast 2022-2032, USD Million
9.4.2.3. By End-Use Industry- Market Insights and Forecast 2022-2032, USD Million
9.5. India Magnesium Turnings Market Statistics, 2022-2032F
9.5.1.Market Size & Growth Outlook
9.5.1.1. By Revenues in USD Million
9.5.2.Market Segmentation & Growth Outlook
9.5.2.1. By Grade- Market Insights and Forecast 2022-2032, USD Million
9.5.2.2. By Application- Market Insights and Forecast 2022-2032, USD Million
9.5.2.3. By End-Use Industry- Market Insights and Forecast 2022-2032, USD Million
9.6. South Korea Magnesium Turnings Market Statistics, 2022-2032F
9.6.1.Market Size & Growth Outlook
9.6.1.1. By Revenues in USD Million
9.6.2.Market Segmentation & Growth Outlook
9.6.2.1. By Grade- Market Insights and Forecast 2022-2032, USD Million
9.6.2.2. By Application- Market Insights and Forecast 2022-2032, USD Million
9.6.2.3. By End-Use Industry- Market Insights and Forecast 2022-2032, USD Million
9.7. Australia Magnesium Turnings Market Statistics, 2022-2032F
9.7.1.Market Size & Growth Outlook
9.7.1.1. By Revenues in USD Million
9.7.2.Market Segmentation & Growth Outlook
9.7.2.1. By Grade- Market Insights and Forecast 2022-2032, USD Million
9.7.2.2. By Application- Market Insights and Forecast 2022-2032, USD Million
9.7.2.3. By End-Use Industry- Market Insights and Forecast 2022-2032, USD Million
9.8. Thailand Magnesium Turnings Market Statistics, 2022-2032F
9.8.1.Market Size & Growth Outlook
9.8.1.1. By Revenues in USD Million
9.8.2.Market Segmentation & Growth Outlook
9.8.2.1. By Grade- Market Insights and Forecast 2022-2032, USD Million
9.8.2.2. By Application- Market Insights and Forecast 2022-2032, USD Million
9.8.2.3. By End-Use Industry- Market Insights and Forecast 2022-2032, USD Million
10. Competitive Outlook
10.1. Company Profiles
10.1.1. Hydro Magnesium
10.1.1.1. Business Description
10.1.1.2. Product Portfolio
10.1.1.3. Collaborations & Alliances
10.1.1.4. Recent Developments
10.1.1.5. Financial Details
10.1.1.6. Others
10.1.2. Showa Denko K.K.
10.1.2.1. Business Description
10.1.2.2. Product Portfolio
10.1.2.3. Collaborations & Alliances
10.1.2.4. Recent Developments
10.1.2.5. Financial Details
10.1.2.6. Others
10.1.3. US Magnesium LLC
10.1.3.1. Business Description
10.1.3.2. Product Portfolio
10.1.3.3. Collaborations & Alliances
10.1.3.4. Recent Developments
10.1.3.5. Financial Details
10.1.3.6. Others
10.1.4. Timminco Limited
10.1.4.1. Business Description
10.1.4.2. Product Portfolio
10.1.4.3. Collaborations & Alliances
10.1.4.4. Recent Developments
10.1.4.5. Financial Details
10.1.4.6. Others
10.1.5. Advanced Magnesium Alloys
10.1.5.1. Business Description
10.1.5.2. Product Portfolio
10.1.5.3. Collaborations & Alliances
10.1.5.4. Recent Developments
10.1.5.5. Financial Details
10.1.5.6. Others
10.1.6. AMAC Metallurgy
10.1.6.1. Business Description
10.1.6.2. Product Portfolio
10.1.6.3. Collaborations & Alliances
10.1.6.4. Recent Developments
10.1.6.5. Financial Details
10.1.6.6. Others
10.1.7. Luxfer Group
10.1.7.1. Business Description
10.1.7.2. Product Portfolio
10.1.7.3. Collaborations & Alliances
10.1.7.4. Recent Developments
10.1.7.5. Financial Details
10.1.7.6. Others
10.1.8. Atlantic Magnesium Corporation
10.1.8.1. Business Description
10.1.8.2. Product Portfolio
10.1.8.3. Collaborations & Alliances
10.1.8.4. Recent Developments
10.1.8.5. Financial Details
10.1.8.6. Others
10.1.9. Zhangjiagang Huachang Metal Powder
10.1.9.1. Business Description
10.1.9.2. Product Portfolio
10.1.9.3. Collaborations & Alliances
10.1.9.4. Recent Developments
10.1.9.5. Financial Details
10.1.9.6. Others
10.1.10. Anhui Tianyu Magnesium Powder
10.1.10.1.Business Description
10.1.10.2.Product Portfolio
10.1.10.3.Collaborations & Alliances
10.1.10.4.Recent Developments
10.1.10.5.Financial Details
10.1.10.6.Others
10.1.11. Iluka Resources
10.1.11.1.Business Description
10.1.11.2.Product Portfolio
10.1.11.3.Collaborations & Alliances
10.1.11.4.Recent Developments
10.1.11.5.Financial Details
10.1.11.6.Others
10.1.12. Daiki Aluminium Co. Ltd.
10.1.12.1.Business Description
10.1.12.2.Product Portfolio
10.1.12.3.Collaborations & Alliances
10.1.12.4.Recent Developments
10.1.12.5.Financial Details
10.1.12.6.Others
10.1.13. POSCO
10.1.13.1.Business Description
10.1.13.2.Product Portfolio
10.1.13.3.Collaborations & Alliances
10.1.13.4.Recent Developments
10.1.13.5.Financial Details
10.1.13.6.Others
10.1.14. Alcoa Corporation
10.1.14.1.Business Description
10.1.14.2.Product Portfolio
10.1.14.3.Collaborations & Alliances
10.1.14.4.Recent Developments
10.1.14.5.Financial Details
10.1.14.6.Others
10.1.15. RIMA Group
10.1.15.1.Business Description
10.1.15.2.Product Portfolio
10.1.15.3.Collaborations & Alliances
10.1.15.4.Recent Developments
10.1.15.5.Financial Details
10.1.15.6.Others
11. Disclaimer
| Segment | Sub-Segment |
|---|---|
| By Grade |
|
| By Application |
|
| By End-Use Industry |
|
| By Region |
|
Research Methodology
This study followed a structured approach comprising four key phases to assess the size and scope of the electro-oxidation market. The process began with thorough secondary research to collect data on the target market, related markets, and broader industry context. These findings, along with preliminary assumptions and estimates, were then validated through extensive primary research involving industry experts from across the value chain. To calculate the overall market size, both top-down and bottom-up methodologies were employed. Finally, market segmentation and data triangulation techniques were applied to refine and validate segment-level estimations.
Secondary Research
The secondary research phase involved gathering data from a wide range of credible and published sources. This step helped in identifying industry trends, defining market segmentation, and understanding the market landscape and value chain.
Sources consulted during this phase included:
- Company annual reports, investor presentations, and press releases
- Industry white papers and certified publications
- Trade directories and market-recognized databases
- Articles from authoritative authors and reputable journals
- Gold and silver standard websites
Secondary research was critical in mapping out the industry's value chain and monetary flow, identifying key market segments, understanding regional variations, and tracking significant industry developments.
Other key sources:
- Financial disclosures
- Industry associations and trade bodies
- News outlets and business magazines
- Academic journals and research studies
- Paid industry databases
Primary Research
To validate secondary data and gain deeper market insights, primary research was conducted with key stakeholders across both the supply and demand sides of the market.
On the demand side, participants included decision-makers and influencers from end-user industries—such as CIOs, CTOs, and CSOs—who provided first-hand perspectives on market needs, product usage, and future expectations.
On the supply side, interviews were conducted with manufacturers, industry associations, and institutional participants to gather insights into current offerings, product pipelines, and market challenges.
Primary interviews provided critical inputs such as:
- Market size and revenue data
- Product and service breakdowns
- Market forecasts
- Regional and application-specific trends
Stakeholders consulted included:
- Leading OEM and solution providers
- Channel and distribution partners
- End users across various applications
- Independent consultants and industry specialists
Market Size Estimation and Data Triangulation
- Identifying Key Market Participants (Secondary Research)
- Goal: To identify the major players or companies in the target market. This typically involves using publicly available data sources such as industry reports, market research publications, and financial statements of companies.
- Tools: Reports from firms like Gartner, Forrester, Euromonitor, Statista, IBISWorld, and others. Public financial statements, news articles, and press releases from top market players.
- Extracting Earnings of Key Market Participants
- Goal: To estimate the earnings generated from the product or service being analyzed. This step helps in understanding the revenue potential of each market player in a specific geography.
- Methods: Earnings data can be gathered from:
- Publicly available financial reports (for listed companies).
- Interviews and primary data sources from professionals, such as Directors, VPs, SVPs, etc. This is especially useful for understanding more nuanced, internal data that isn't publicly disclosed.
- Annual reports and investor presentations of key players.
- Data Collation and Development of a Relevant Data Model
- Goal: To collate inputs from both primary and secondary sources into a structured, data-driven model for market estimation. This model will incorporate key market KPIs and any independent variables relevant to the market.
- Key KPIs: These could include:
- Market size, growth rate, and demand drivers.
- Industry-specific metrics like market share, average revenue per customer (ARPC), or average deal size.
- External variables, such as economic growth rates, inflation rates, or commodity prices, that could affect the market.
- Data Modeling: Based on this data, the market forecasts are developed for the next 5 years. A combination of trend analysis, scenario modeling, and statistical regression might be used to generate projections.
- Scenario Analysis
- Goal: To test different assumptions and validate how sensitive the market is to changes in key variables (e.g., market demand, regulatory changes, technological disruptions).
- Types of Scenarios:
- Base Case: Based on current assumptions and historical data.
- Best-Case Scenario: Assuming favorable market conditions, regulatory environments, and technological advancements.
- Worst-Case Scenario: Accounting for adverse factors, such as economic downturns, stricter regulations, or unexpected disruptions.


