Global Lactic Acid Market Report: Trends, Growth and Forecast (2026-2032)
By Purity Grade (Food Grade, Industrial Grade, Pharmaceutical Grade), By Application (Food & Beverage, Pharmaceuticals, Cosmetics, Bioplastics), By Region (North America, Latin America, Europe, Middle East & Africa, Asia Pacific) ... Read more
|
Major Players
|
Global Lactic Acid Market Statistics and Insights, 2026
- Market Size Statistics
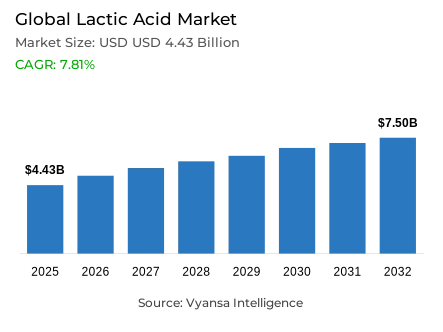
- Global lactic acid market is estimated at USD 4.43 billion in 2025.
- The market size is expected to grow to USD 7.5 billion by 2032.
- Market to register a CAGR of around 7.81% during 2026-32.
- Purity Grade Shares
- Food grade grabbed market share of 55%.
- Competition
- Global lactic acid market is currently being catered to by more than 25 companies.
- Top 5 companies acquired around 60% of the market share.
- NatureWorks; Dow; TEIJIN; Corbion; Jungbunzlauer etc., are few of the top companies.
- Application
- Food & beverage grabbed 40% of the market.
- Region
- Asia Pacific leads with a 50% share of the global market.
Global Lactic Acid Market Outlook
The Global lactic acid market is estimated at $4.43 billion in 2025 and is projected to reach $7.5 billion by 2032, registering a CAGR of around 7.81% during 2026-32. This is due to the increasing demand for natural and clean-label ingredients, with end-users increasingly focusing on transparency and fewer additives in food products. Lactic acid, being a natural ingredient and an effective preservative, is widely used in the dairy, bakery, meat processing, and functional beverage markets. Approvals from regulatory bodies, such as the US EPA's recognition of L-lactic acid as a food-contact sanitizer and the inclusion of L(+)-lactic acid in various food categories by the India FSSAI, have further boosted its adoption and aided in the growth of the market.
Food-grade lactic acid leads the market, contributing 55% to overall consumption. The industry is also witnessing the development of high-purity lactic acid (≥88%) to satisfy microbial safety, residue limits, and traceability. This is in response to growing reformulation activities in the food sector, where lactic acid is used to ensure product safety, pH, and sensory characteristics while replacing synthetic preservatives. The Food & Beverage industry continues to be the leading market segment, accounting for 40% of the market share, primarily due to its use in dairy fermentation, plant-based products, meat processing, and functional beverages.
Technical issues in microbial fermentation, such as substrate inhibition, contamination, and variability in the fermentation substrate, remain as factors that affect the efficiency and cost of production. There is a growing trend among manufacturers to optimize fermentation using agricultural and food processing residues, including whey and fruit residues, with high conversion rates of 85-92% for lactic acid production. This not only makes the fermentation substrate cheaper but also helps in corporate sustainability goals.
The Asia Pacific dominates the world in terms of production with a market share of 50%, thanks to the availability of feedstock, cost-effectiveness, and government support. China, Thailand, and India are key production bases that benefit from their integrated industrial value chains and government programs such as China’s “Three-Year Action Plan on Non-Food Bio-based Materials” and India’s BioE3 initiative. The strong food, biopolymer, and specialty chemical industries in the region ensure that there are sustained demand clusters, which cements Asia-Pacific’s dominance until 2032.

Global Lactic Acid Market Growth Driver
Natural Preservative Adoption Driving Lactic Acid Demand
End users increasingly prioritize transparency and natural ingredients, which is driving manufacturers to use lactic acid as a naturally derived preservative with antimicrobial properties and no synthetic additives. As a result, it has become a preferred alternative across food categories including dairy, baked goods, meat processing, and health beverages. The regulatory approval of L-lactic acid by the United States Environmental Protection Agency (EPA) in 2024 to be used as a direct food contact sanitizer for fruits and vegetables as well as the update of permitted food additives to include L(+)-lactic acid (INS 270) by the Food Safety and Standards Authority of India (FSSAI) in 2024-establishing maximum residue levels for safe usage across many categories of food—has also bolstered the acceptance of lactic acid in the marketplace among end users. The alignment of end-users' preferences, regulatory validation and the Reformulation of manufacturers reinforces lactic acid's role as a key natural preservative in food production worldwide.
There is an increasing demand for lactic acid from both manufacturers and end-users due to both the convergence of regulatory approval allowing this to occur and the changing expectations of end-users. Because end-users are now requiring lactic acid in products in order to create a clean-label, manufacturers are continuing to develop reformulation plans that include the use of lactic acid in order to increase food safety and reduce the use of synthetic preservatives in segments of the market where consumers have been increasingly reluctant to accept these preservatives. In addition, this is especially vital in regions of strict food safety regulations, as well as increased awareness of functional and minimally processed foods, thereby increasing lactic acid's use in both developed and developing parts of the world.
Global Lactic Acid Market Challenge
Production Complexity and Feedstock Variability Challenges
Commercial production of lactic acid via microbial fermentation presents significant economic and technical challenges, particularly with respect to scale-up efforts and costs. The most significant technical barriers in the use of microbial processes for lactic acid production are the substrate inhibition of the microorganisms, contamination by other microorganisms and the multitude of heterogeneous by-products produced during fermentation. The addition of high concentrations of substrates creates an environment with a large osmotic potential which stresses the microorganisms and results in decreased lactic acid productivity. Also, if you are conducting mixed-culture (multiple microbes) fermentations you will have additional byproducts (ethanol and acetic acids) that can create higher downstream purification costs. The feedstock used for lactic acid fermentation is variable because it is derived from agriculture sources such as corn, sugarcane, cassava, etc. The feedstock varies depending on the cultivar, soil and climate conditions and the harvest timing and this adds further complexity to creating consistent production processes, making it vital that these processes are continually being optimized. For low-cost agricultural residues (agricultural waste), pre-treatments will require investment into advanced technologies such as enzymatic hydrolysis or solvent extraction which increases both capital costs and technical expertise required to produce lactic acid for small or medium-sized producers.
There are many technical challenges that exist when attempting to produce lactic acid using microbial fermentation; therefore, small and medium-sized producers face increased barriers to producing lactic acid commercially. Maintaining a consistent production process, optimally selecting specific strains of microorganisms used for fermentation and performing required downstream purifications are resource-intensive; thus limiting small and medium-sized producers' ability to compete in the market. In addition to the feedstock variation and complexity of the fermentation process which add to total production costs and operational risk, having a solid understanding of process control, engineering expertise and infrastructure investment are necessary prerequisites for economically viable lactic acid production. Sustainable economics depend on the ability to plan for and have reliable supply chains with high-quality feedstocks for the food, pharmaceutical and polymer industries.
Unlock Market Intelligence
Explore the market potential with our data-driven report
Global Lactic Acid Market Trend
Biodegradable Polymer Expansion and Policy Support
The growth rate of biopolymers made from sustainable feedstock (i.e. the "bio-eco-friendly" movement) globally increased significantly over the last 3-4 years as a result of government leadership, increased demand from businesses, and increases in investment in biopolymer production. The growth rate for PLA (polylactic acid) increased by 81.5% over 3 years, PBAT (polybutylene adipate terephthalate) increased by 170% over that same period, and projections for production in 2026 indicate an expected growth in production of PBAT by over 500%; PBS (polybutylene succinate) by over 226.5%, and PHA (polyhydroxyalkanoates) by over 166.7%. The expansion of biopolymer production has been supported through government sustainability initiatives such as the reduction of carbon emissions (the "Three-Year Action Plan to Accelerate Innovative Development of Non-Food Bio-Based Materials" and "Dual Carbon Goals") - which positions biopolymers as critical to the national economy and therefore incentivizes the development of biopolymer infrastructure and capacity within the country.
In parallel to China, India has launched the NITI Aayog BioE3 initiative to promote biopolymers and other bioeconomy development through supportive regulatory and policy environments, which support continued demand from industrial and consumer markets for lactic acid in the form of biopolymers. The increased demand for lactic acid from industrial and consumer markets reinforces the critical role of lactic acid in developing a sustainable bio-based economy, and prepares producers to capitalize on growth opportunities created through government-supported policies while aligning with global sustainability objectives.
Global Lactic Acid Market Opportunity
Valorization of Agricultural Waste as Feedstock
The conversion of agricultural and food-processing residues into lactic acid feedstock represents a high-potential market opportunity. Approximately 30% of global food production, equivalent to 1.3 billion metric tons annually, is lost or discarded, creating abundant raw material for microbial fermentation. Lignocellulosic biomass from forestry and agricultural by-products provides a renewable resource with minimal competing applications. Studies demonstrate that optimized fermentation of dairy whey, fruit-processing residues, and agro-industrial wastes can achieve 85-92% lactic acid conversion efficiency when substrates undergo appropriate pretreatment, including physical and chemical processing.
Implementing waste-to-value strategies delivers dual benefits: reduced feedstock costs for manufacturers and fulfillment of corporate sustainability commitments aligned with circular economy principles. Producers can leverage this pathway to differentiate through environmental credentials, lower per-unit production costs, and meet rising end-user expectations for sustainable, naturally-derived ingredients. These approaches are particularly relevant across food, pharmaceutical, and biopolymer sectors, offering strategic advantages in cost reduction, regulatory compliance, and market positioning.
Global Lactic Acid Market Regional Analysis

By Region
- North America
- Latin America
- Europe
- Middle East & Africa
- Asia Pacific
Asia Pacific accounts for an estimated 50% of global lactic acid production, supported by structural advantages in feedstock availability, cost efficiency, and policy support. Major producing countries include China, Thailand, and India, which benefit from abundant sugarcane and corn supplies and lower procurement costs relative to North America and Europe. China’s integrated industrial ecosystem, reinforced by the 2023 “Three-Year Action Plan on Non-Food Bio-based Materials” and the “Dual Carbon Goal,” establishes the region as a global production hub for lactic acid and biopolymers.
Thailand’s integrated facilities combine feedstock proximity with export access, serving pharmaceutical, cosmetic, and food sectors, while India’s emerging production capacity is fueled by domestic agricultural supply and growing industrial demand. The region’s established bioplastics, functional food, and specialty chemical industries create integrated demand clusters, enhancing supply-chain efficiency and competitive positioning. Asia-Pacific’s structural advantages ensure continued leadership through 2032, supporting both domestic consumption and global export-driven market dynamics.
Unlock Market Intelligence
Explore the market potential with our data-driven report
Global Lactic Acid Market Segmentation Analysis
By Purity Grade
- Food Grade
- Industrial Grade
- Pharmaceutical Grade
Food-grade lactic acid accounts for approximately 55% of the market, reflecting regulatory mandates and industry compliance requirements. Typically ≥88% purity, this classification undergoes certification to meet microbial safety standards, residue limits, and traceability protocols enforced by the US FDA, India’s FSSAI, and FAO/WHO Codex Alimentarius. Recent regulatory updates in 2024 expanded permitted applications, including infant formula, pickled fungi, sterilized fungi, and general food preservation, underscoring the criticality of segregated production facilities. Segregation ensures compliance and preserves product integrity, establishing clear differentiation from industrial-grade lactic acid used in polymer and chemical applications.
Industrial-grade lactic acid, while essential for biopolymer synthesis and chemical processes, operates under relaxed purity specifications and commands separate pricing tiers due to the absence of stringent food-regulatory oversight. The dual-market structure enables producers to optimize production lines, serving high-value, regulated applications while maintaining cost efficiency in industrial sectors. This purity-based segmentation reinforces regulatory adherence, supply-chain integrity, and targeted end-user satisfaction in food, pharmaceutical, and cosmetic industries.

By Application
- Food & Beverage
- Pharmaceuticals
- Cosmetics
- Bioplastics
The Food & Beverage sector represents approximately 40% of global lactic acid applications, making it the largest end-use category. Lactic acid is extensively used in dairy fermentation products, meat and poultry processing, bakery formulations, and functional beverages, including plant-based milk alternatives, sports drinks, and probiotic-fortified waters. Expansion in plant-based and functional foods has driven incremental demand, as lactic acid supports pH stabilization, sensory quality, and antimicrobial protection, ensuring consistent product performance across diverse formulations.
Developed regions with mature food-processing infrastructure benefit from integrated quality-control and regulatory compliance systems, facilitating widespread lactic acid adoption. These established supply chains support scalability, end-user safety, and reliable performance, strengthening the dominance of Food and Beverage applications relative to emerging industrial uses in biopolymers and pharmaceuticals. The sector’s growth trajectory reflects both evolving dietary trends and regulatory-driven assurance of safe, naturally-derived ingredient utilization.
Market Players in Global Lactic Acid Market
These market players maintain a significant presence in the Global lactic acid market sector and contribute to its ongoing evolution.
- NatureWorks
- Dow
- TEIJIN
- Corbion
- Jungbunzlauer
- Galactic
- Futerro
- BASF SE
- Cellulac
- Musashino Chemical
- Henan Jindan Lactic Acid Technology Co. Ltd.
- Vaishnavi Bio Tech
- Danimer Scientific
- Anhui BBCA Biochemical
- Shandong Sunking / Shandong producers group
Market News & Updates
- Corbion, 2025:
Corbion’s Advance 2025 strategy document describes lactic acid and lactic acid derivatives as a core competence and states that the company has established a leading global position in these products, which underpin its activities across food preservation, biochemicals, and bioplastics. Within its Functional Ingredients & Solutions segment, Corbion integrates lactic acid production with applications in food, home and personal care, and industrial biochemicals, and also supplies lactic acid to the TotalEnergies Corbion 50/50 joint venture that produces and markets Luminy PLA biopolymers for uses such as rigid and flexible food packaging, serviceware, and fibers. To meet growing demand from these markets—particularly PLA—Corbion reports that it is expanding lactic acid capacity at several existing facilities and has brought online a first-of-its-kind lactic acid plant in Thailand based on circular production technology, intended to improve resource efficiency and reduce environmental footprint while reinforcing its supply position to customers in bioplastics, food, and pharmaceutical applications.
- NatureWorks, 2025:
NatureWorks is building a fully integrated Ingeo PLA manufacturing complex at the Nakhon Sawan Biocomplex in Thailand that combines lactic acid fermentation, lactide monomer production, and PLA polymerization on a single site, with a design capacity of 75,000 tonnes per year of Ingeo biopolymer based on locally sourced sugarcane as the renewable feedstock and full production targeted in 2025 to supply packaging, fibers, nonwovens, coffee capsules, tea bags, and food-service applications. In March 2025, NatureWorks launched the Ingeo Extend platform, introducing Ingeo Extend 4950D as a new PLA grade engineered specifically for biaxially oriented PLA (BOPLA) film lines; company materials and a BusinessWire announcement state that 4950D enables transverse-direction stretch ratios up to seven times on existing BOPP-type equipment, significantly boosting throughput and line efficiency without the need for major capital modifications. Films produced with Ingeo Extend 4950D are described as combining improved heat resistance (typically tolerating 130–140 °C), low shrinkage, high clarity, and enhanced sealing behavior with faster compostability than conventional PLA grades, making them suitable for high-performance, compostable mono-material flexible packaging.
Frequently Asked Questions
Related Report
1. Market Segmentation
1.1. Research Scope
1.2. Research Methodology
1.3. Definitions and Assumptions
2. Executive Summary
3. Global Lactic Acid Market Policies, Regulations, and Standards
4. Global Lactic Acid Market Dynamics
4.1. Growth Factors
4.2. Challenges
4.3. Trends
4.4. Opportunities
5. Global Lactic Acid Market Statistics, 2022-2032F
5.1. Market Size & Growth Outlook
5.1.1.By Revenues in USD Million
5.2. Market Segmentation & Growth Outlook
5.2.1.By Purity Grade
5.2.1.1. Food Grade- Market Insights and Forecast 2022-2032, USD Million
5.2.1.2. Industrial Grade- Market Insights and Forecast 2022-2032, USD Million
5.2.1.3. Pharmaceutical Grade- Market Insights and Forecast 2022-2032, USD Million
5.2.2.By Application
5.2.2.1. Food & Beverage- Market Insights and Forecast 2022-2032, USD Million
5.2.2.2. Pharmaceuticals- Market Insights and Forecast 2022-2032, USD Million
5.2.2.3. Cosmetics- Market Insights and Forecast 2022-2032, USD Million
5.2.2.4. Bioplastics- Market Insights and Forecast 2022-2032, USD Million
5.2.3.By Region
5.2.3.1. North America
5.2.3.2. Latin America
5.2.3.3. Europe
5.2.3.4. Middle East & Africa
5.2.3.5. Asia Pacific
5.2.4.By Competitors
5.2.4.1. Competition Characteristics
5.2.4.2. Market Share & Analysis
6. North America Lactic Acid Market Statistics, 2022-2032F
6.1. Market Size & Growth Outlook
6.1.1.By Revenues in USD Million
6.2. Market Segmentation & Growth Outlook
6.2.1.By Purity Grade- Market Insights and Forecast 2022-2032, USD Million
6.2.2.By Application- Market Insights and Forecast 2022-2032, USD Million
6.2.3.By Country
6.2.3.1. US
6.2.3.2. Canada
6.2.3.3. Mexico
6.2.3.4. Rest of North America
6.3. US Lactic Acid Market Statistics, 2022-2032F
6.3.1.Market Size & Growth Outlook
6.3.1.1. By Revenues in USD Million
6.3.2.Market Segmentation & Growth Outlook
6.3.2.1. By Purity Grade- Market Insights and Forecast 2022-2032, USD Million
6.3.2.2. By Application- Market Insights and Forecast 2022-2032, USD Million
6.4. Canada Lactic Acid Market Statistics, 2022-2032F
6.4.1.Market Size & Growth Outlook
6.4.1.1. By Revenues in USD Million
6.4.2.Market Segmentation & Growth Outlook
6.4.2.1. By Purity Grade- Market Insights and Forecast 2022-2032, USD Million
6.4.2.2. By Application- Market Insights and Forecast 2022-2032, USD Million
6.5. Mexico Lactic Acid Market Statistics, 2022-2032F
6.5.1.Market Size & Growth Outlook
6.5.1.1. By Revenues in USD Million
6.5.2.Market Segmentation & Growth Outlook
6.5.2.1. By Purity Grade- Market Insights and Forecast 2022-2032, USD Million
6.5.2.2. By Application- Market Insights and Forecast 2022-2032, USD Million
7. Latin America Lactic Acid Market Statistics, 2022-2032F
7.1. Market Size & Growth Outlook
7.1.1.By Revenues in USD Million
7.2. Market Segmentation & Growth Outlook
7.2.1.By Purity Grade- Market Insights and Forecast 2022-2032, USD Million
7.2.2.By Application- Market Insights and Forecast 2022-2032, USD Million
7.2.3.By Country
7.2.3.1. Brazil
7.2.3.2. Argentina
7.2.3.3. Rest of Latin America
7.3. Brazil Lactic Acid Market Statistics, 2022-2032F
7.3.1.Market Size & Growth Outlook
7.3.1.1. By Revenues in USD Million
7.3.2.Market Segmentation & Growth Outlook
7.3.2.1. By Purity Grade- Market Insights and Forecast 2022-2032, USD Million
7.3.2.2. By Application- Market Insights and Forecast 2022-2032, USD Million
7.4. Argentina Lactic Acid Market Statistics, 2022-2032F
7.4.1.Market Size & Growth Outlook
7.4.1.1. By Revenues in USD Million
7.4.2.Market Segmentation & Growth Outlook
7.4.2.1. By Purity Grade- Market Insights and Forecast 2022-2032, USD Million
7.4.2.2. By Application- Market Insights and Forecast 2022-2032, USD Million
8. Europe Lactic Acid Market Statistics, 2022-2032F
8.1. Market Size & Growth Outlook
8.1.1.By Revenues in USD Million
8.2. Market Segmentation & Growth Outlook
8.2.1.By Purity Grade- Market Insights and Forecast 2022-2032, USD Million
8.2.2.By Application- Market Insights and Forecast 2022-2032, USD Million
8.2.3.By Country
8.2.3.1. UK
8.2.3.2. Germany
8.2.3.3. France
8.2.3.4. Italy
8.2.3.5. Spain
8.2.3.6. Netherlands
8.2.3.7. Russia
8.2.3.8. Poland
8.2.3.9. Rest of Europe
8.3. UK Lactic Acid Market Statistics, 2022-2032F
8.3.1.Market Size & Growth Outlook
8.3.1.1. By Revenues in USD Million
8.3.2.Market Segmentation & Growth Outlook
8.3.2.1. By Purity Grade- Market Insights and Forecast 2022-2032, USD Million
8.3.2.2. By Application- Market Insights and Forecast 2022-2032, USD Million
8.4. Germany Lactic Acid Market Statistics, 2022-2032F
8.4.1.Market Size & Growth Outlook
8.4.1.1. By Revenues in USD Million
8.4.2.Market Segmentation & Growth Outlook
8.4.2.1. By Purity Grade- Market Insights and Forecast 2022-2032, USD Million
8.4.2.2. By Application- Market Insights and Forecast 2022-2032, USD Million
8.5. France Lactic Acid Market Statistics, 2022-2032F
8.5.1.Market Size & Growth Outlook
8.5.1.1. By Revenues in USD Million
8.5.2.Market Segmentation & Growth Outlook
8.5.2.1. By Purity Grade- Market Insights and Forecast 2022-2032, USD Million
8.5.2.2. By Application- Market Insights and Forecast 2022-2032, USD Million
8.6. Italy Lactic Acid Market Statistics, 2022-2032F
8.6.1.Market Size & Growth Outlook
8.6.1.1. By Revenues in USD Million
8.6.2.Market Segmentation & Growth Outlook
8.6.2.1. By Purity Grade- Market Insights and Forecast 2022-2032, USD Million
8.6.2.2. By Application- Market Insights and Forecast 2022-2032, USD Million
8.7. Spain Lactic Acid Market Statistics, 2022-2032F
8.7.1.Market Size & Growth Outlook
8.7.1.1. By Revenues in USD Million
8.7.2.Market Segmentation & Growth Outlook
8.7.2.1. By Purity Grade- Market Insights and Forecast 2022-2032, USD Million
8.7.2.2. By Application- Market Insights and Forecast 2022-2032, USD Million
8.8. Netherlands Lactic Acid Market Statistics, 2022-2032F
8.8.1.Market Size & Growth Outlook
8.8.1.1. By Revenues in USD Million
8.8.2.Market Segmentation & Growth Outlook
8.8.2.1. By Purity Grade- Market Insights and Forecast 2022-2032, USD Million
8.8.2.2. By Application- Market Insights and Forecast 2022-2032, USD Million
8.9. Russia Lactic Acid Market Statistics, 2022-2032F
8.9.1.Market Size & Growth Outlook
8.9.1.1. By Revenues in USD Million
8.9.2.Market Segmentation & Growth Outlook
8.9.2.1. By Purity Grade- Market Insights and Forecast 2022-2032, USD Million
8.9.2.2. By Application- Market Insights and Forecast 2022-2032, USD Million
8.10. Poland Lactic Acid Market Statistics, 2022-2032F
8.10.1. Market Size & Growth Outlook
8.10.1.1. By Revenues in USD Million
8.10.2. Market Segmentation & Growth Outlook
8.10.2.1. By Purity Grade- Market Insights and Forecast 2022-2032, USD Million
8.10.2.2. By Application- Market Insights and Forecast 2022-2032, USD Million
9. Middle East & Africa Lactic Acid Market Statistics, 2022-2032F
9.1. Market Size & Growth Outlook
9.1.1.By Revenues in USD Million
9.2. Market Segmentation & Growth Outlook
9.2.1.By Purity Grade- Market Insights and Forecast 2022-2032, USD Million
9.2.2.By Application- Market Insights and Forecast 2022-2032, USD Million
9.2.3.By Country
9.2.3.1. Saudi Arabia
9.2.3.2. South Africa
9.2.3.3. UAE
9.2.3.4. Rest of Middle East & Africa
9.3. Saudi Arabia Lactic Acid Market Statistics, 2022-2032F
9.3.1.Market Size & Growth Outlook
9.3.1.1. By Revenues in USD Million
9.3.2.Market Segmentation & Growth Outlook
9.3.2.1. By Purity Grade- Market Insights and Forecast 2022-2032, USD Million
9.3.2.2. By Application- Market Insights and Forecast 2022-2032, USD Million
9.4. South Africa Lactic Acid Market Statistics, 2022-2032F
9.4.1.Market Size & Growth Outlook
9.4.1.1. By Revenues in USD Million
9.4.2.Market Segmentation & Growth Outlook
9.4.2.1. By Purity Grade- Market Insights and Forecast 2022-2032, USD Million
9.4.2.2. By Application- Market Insights and Forecast 2022-2032, USD Million
9.5. UAE Lactic Acid Market Statistics, 2022-2032F
9.5.1.Market Size & Growth Outlook
9.5.1.1. By Revenues in USD Million
9.5.2.Market Segmentation & Growth Outlook
9.5.2.1. By Purity Grade- Market Insights and Forecast 2022-2032, USD Million
9.5.2.2. By Application- Market Insights and Forecast 2022-2032, USD Million
10. Asia Pacific Lactic Acid Market Statistics, 2022-2032F
10.1. Market Size & Growth Outlook
10.1.1. By Revenues in USD Million
10.2. Market Segmentation & Growth Outlook
10.2.1. By Purity Grade- Market Insights and Forecast 2022-2032, USD Million
10.2.2. By Application- Market Insights and Forecast 2022-2032, USD Million
10.2.3. By Country
10.2.3.1. China
10.2.3.2. Japan
10.2.3.3. India
10.2.3.4. South Korea
10.2.3.5. Australia
10.2.3.6. Rest of Asia Pacific
10.3. China Lactic Acid Market Statistics, 2022-2032F
10.3.1. Market Size & Growth Outlook
10.3.1.1. By Revenues in USD Million
10.3.2. Market Segmentation & Growth Outlook
10.3.2.1. By Purity Grade- Market Insights and Forecast 2022-2032, USD Million
10.3.2.2. By Application- Market Insights and Forecast 2022-2032, USD Million
10.4. Japan Lactic Acid Market Statistics, 2022-2032F
10.4.1. Market Size & Growth Outlook
10.4.1.1. By Revenues in USD Million
10.4.2. Market Segmentation & Growth Outlook
10.4.2.1. By Purity Grade- Market Insights and Forecast 2022-2032, USD Million
10.4.2.2. By Application- Market Insights and Forecast 2022-2032, USD Million
10.5. India Lactic Acid Market Statistics, 2022-2032F
10.5.1. Market Size & Growth Outlook
10.5.1.1. By Revenues in USD Million
10.5.2. Market Segmentation & Growth Outlook
10.5.2.1. By Purity Grade- Market Insights and Forecast 2022-2032, USD Million
10.5.2.2. By Application- Market Insights and Forecast 2022-2032, USD Million
10.6. South Korea Lactic Acid Market Statistics, 2022-2032F
10.6.1. Market Size & Growth Outlook
10.6.1.1. By Revenues in USD Million
10.6.2. Market Segmentation & Growth Outlook
10.6.2.1. By Purity Grade- Market Insights and Forecast 2022-2032, USD Million
10.6.2.2. By Application- Market Insights and Forecast 2022-2032, USD Million
10.7. Australia Lactic Acid Market Statistics, 2022-2032F
10.7.1. Market Size & Growth Outlook
10.7.1.1. By Revenues in USD Million
10.7.2. Market Segmentation & Growth Outlook
10.7.2.1. By Purity Grade- Market Insights and Forecast 2022-2032, USD Million
10.7.2.2. By Application- Market Insights and Forecast 2022-2032, USD Million
11. Competitive Outlook
11.1. Company Profiles
11.1.1. Corbion
11.1.1.1. Business Description
11.1.1.2. Product Portfolio
11.1.1.3. Collaborations & Alliances
11.1.1.4. Recent Developments
11.1.1.5. Financial Details
11.1.1.6. Others
11.1.2. Jungbunzlauer
11.1.2.1. Business Description
11.1.2.2. Product Portfolio
11.1.2.3. Collaborations & Alliances
11.1.2.4. Recent Developments
11.1.2.5. Financial Details
11.1.2.6. Others
11.1.3. Galactic
11.1.3.1. Business Description
11.1.3.2. Product Portfolio
11.1.3.3. Collaborations & Alliances
11.1.3.4. Recent Developments
11.1.3.5. Financial Details
11.1.3.6. Others
11.1.4. Futerro
11.1.4.1. Business Description
11.1.4.2. Product Portfolio
11.1.4.3. Collaborations & Alliances
11.1.4.4. Recent Developments
11.1.4.5. Financial Details
11.1.4.6. Others
11.1.5. BASF SE
11.1.5.1. Business Description
11.1.5.2. Product Portfolio
11.1.5.3. Collaborations & Alliances
11.1.5.4. Recent Developments
11.1.5.5. Financial Details
11.1.5.6. Others
11.1.6. NatureWorks
11.1.6.1. Business Description
11.1.6.2. Product Portfolio
11.1.6.3. Collaborations & Alliances
11.1.6.4. Recent Developments
11.1.6.5. Financial Details
11.1.6.6. Others
11.1.7. Dow
11.1.7.1. Business Description
11.1.7.2. Product Portfolio
11.1.7.3. Collaborations & Alliances
11.1.7.4. Recent Developments
11.1.7.5. Financial Details
11.1.7.6. Others
11.1.8. TEIJIN
11.1.8.1. Business Description
11.1.8.2. Product Portfolio
11.1.8.3. Collaborations & Alliances
11.1.8.4. Recent Developments
11.1.8.5. Financial Details
11.1.8.6. Others
11.1.9. Cellulac
11.1.9.1. Business Description
11.1.9.2. Product Portfolio
11.1.9.3. Collaborations & Alliances
11.1.9.4. Recent Developments
11.1.9.5. Financial Details
11.1.9.6. Others
11.1.10. Musashino Chemical
11.1.10.1.Business Description
11.1.10.2.Product Portfolio
11.1.10.3.Collaborations & Alliances
11.1.10.4.Recent Developments
11.1.10.5.Financial Details
11.1.10.6.Others
11.1.11. Henan Jindan Lactic Acid Technology Co. Ltd.
11.1.11.1.Business Description
11.1.11.2.Product Portfolio
11.1.11.3.Collaborations & Alliances
11.1.11.4.Recent Developments
11.1.11.5.Financial Details
11.1.11.6.Others
11.1.12. Vaishnavi Bio Tech
11.1.12.1.Business Description
11.1.12.2.Product Portfolio
11.1.12.3.Collaborations & Alliances
11.1.12.4.Recent Developments
11.1.12.5.Financial Details
11.1.12.6.Others
11.1.13. Danimer Scientific
11.1.13.1.Business Description
11.1.13.2.Product Portfolio
11.1.13.3.Collaborations & Alliances
11.1.13.4.Recent Developments
11.1.13.5.Financial Details
11.1.13.6.Others
11.1.14. Anhui BBCA Biochemical
11.1.14.1.Business Description
11.1.14.2.Product Portfolio
11.1.14.3.Collaborations & Alliances
11.1.14.4.Recent Developments
11.1.14.5.Financial Details
11.1.14.6.Others
11.1.15. Shandong Sunking / Shandong producers group
11.1.15.1.Business Description
11.1.15.2.Product Portfolio
11.1.15.3.Collaborations & Alliances
11.1.15.4.Recent Developments
11.1.15.5.Financial Details
11.1.15.6.Others
11.1.16. Cargill
11.1.16.1.Business Description
11.1.16.2.Product Portfolio
11.1.16.3.Collaborations & Alliances
11.1.16.4.Recent Developments
11.1.16.5.Financial Details
11.1.16.6.Others
12. Disclaimer
| Segment | Sub-Segment |
|---|---|
| By Purity Grade |
|
| By Application |
|
| By Region |
|
Research Methodology
This study followed a structured approach comprising four key phases to assess the size and scope of the electro-oxidation market. The process began with thorough secondary research to collect data on the target market, related markets, and broader industry context. These findings, along with preliminary assumptions and estimates, were then validated through extensive primary research involving industry experts from across the value chain. To calculate the overall market size, both top-down and bottom-up methodologies were employed. Finally, market segmentation and data triangulation techniques were applied to refine and validate segment-level estimations.
Secondary Research
The secondary research phase involved gathering data from a wide range of credible and published sources. This step helped in identifying industry trends, defining market segmentation, and understanding the market landscape and value chain.
Sources consulted during this phase included:
- Company annual reports, investor presentations, and press releases
- Industry white papers and certified publications
- Trade directories and market-recognized databases
- Articles from authoritative authors and reputable journals
- Gold and silver standard websites
Secondary research was critical in mapping out the industry's value chain and monetary flow, identifying key market segments, understanding regional variations, and tracking significant industry developments.
Other key sources:
- Financial disclosures
- Industry associations and trade bodies
- News outlets and business magazines
- Academic journals and research studies
- Paid industry databases
Primary Research
To validate secondary data and gain deeper market insights, primary research was conducted with key stakeholders across both the supply and demand sides of the market.
On the demand side, participants included decision-makers and influencers from end-user industries—such as CIOs, CTOs, and CSOs—who provided first-hand perspectives on market needs, product usage, and future expectations.
On the supply side, interviews were conducted with manufacturers, industry associations, and institutional participants to gather insights into current offerings, product pipelines, and market challenges.
Primary interviews provided critical inputs such as:
- Market size and revenue data
- Product and service breakdowns
- Market forecasts
- Regional and application-specific trends
Stakeholders consulted included:
- Leading OEM and solution providers
- Channel and distribution partners
- End users across various applications
- Independent consultants and industry specialists
Market Size Estimation and Data Triangulation
- Identifying Key Market Participants (Secondary Research)
- Goal: To identify the major players or companies in the target market. This typically involves using publicly available data sources such as industry reports, market research publications, and financial statements of companies.
- Tools: Reports from firms like Gartner, Forrester, Euromonitor, Statista, IBISWorld, and others. Public financial statements, news articles, and press releases from top market players.
- Extracting Earnings of Key Market Participants
- Goal: To estimate the earnings generated from the product or service being analyzed. This step helps in understanding the revenue potential of each market player in a specific geography.
- Methods: Earnings data can be gathered from:
- Publicly available financial reports (for listed companies).
- Interviews and primary data sources from professionals, such as Directors, VPs, SVPs, etc. This is especially useful for understanding more nuanced, internal data that isn't publicly disclosed.
- Annual reports and investor presentations of key players.
- Data Collation and Development of a Relevant Data Model
- Goal: To collate inputs from both primary and secondary sources into a structured, data-driven model for market estimation. This model will incorporate key market KPIs and any independent variables relevant to the market.
- Key KPIs: These could include:
- Market size, growth rate, and demand drivers.
- Industry-specific metrics like market share, average revenue per customer (ARPC), or average deal size.
- External variables, such as economic growth rates, inflation rates, or commodity prices, that could affect the market.
- Data Modeling: Based on this data, the market forecasts are developed for the next 5 years. A combination of trend analysis, scenario modeling, and statistical regression might be used to generate projections.
- Scenario Analysis
- Goal: To test different assumptions and validate how sensitive the market is to changes in key variables (e.g., market demand, regulatory changes, technological disruptions).
- Types of Scenarios:
- Base Case: Based on current assumptions and historical data.
- Best-Case Scenario: Assuming favorable market conditions, regulatory environments, and technological advancements.
- Worst-Case Scenario: Accounting for adverse factors, such as economic downturns, stricter regulations, or unexpected disruptions.


