Latin America Industrial Gases Market Report: Trends, Growth and Forecast (2026-2032)
Gas Type (Nitrogen Gas, Oxygen Gas, Carbon Dioxide Gas, Argon Gas, Helium Gas, Hydrogen Gas, Other), Supply Mode (Cylinders, Bulk, On-Site Production, Captive, Other), Application (Combustion and Process Oxygen, Welding and Metal Fabrication, Inerting Blanketing and Heat Treating, Cryogenics and liquefaction, Chemical Synthesis and Hydrogenation, Purging and Purifications, Analytical and Calibration), End User Industry (General Manufacturing, Food, Metallurgy, Chemicals, Healthcare, Electronics, Refining & Energy, Glass, Pulp & Paper, Others), Country (Brazil, Mexico, Argentina, Chile, Colombia, Peru, Rest of Latin America) ... Read more
|
Major Players
|
Latin America Industrial Gases Market Statistics and Insights, 2026
- Market Size Statistics
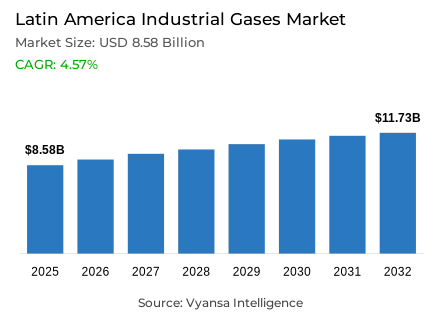
- Latin America industrial gases market is estimated at USD 8.58 billion in 2025.
- The market size is expected to grow to USD 11.73 billion by 2032.
- Market to register a cagr of around 4.57% during 2026-32.
- Gas Type Shares
- Oxygen gas grabbed market share of 40%.
- Competition
- More than 10 companies are actively engaged in producing industrial gases in Latin America.
- Top 5 companies acquired around 80% of the market share.
- IBG (Indústria Brasileira de Gases); Taiyo Nippon Sanso; Iwatani Corporation; Linde; Air Products etc., are few of the top companies.
- Supply Mode
- Cylinders grabbed 45% of the market.
- Country
- Brazil leads with a 40% share of the Latin America market.
Latin America Industrial Gases Market Outlook
Latin America industrial gases market is expected to grow steadily in the period between 2026 and 2032 due to the growing manufacturing and food processing operations in the region. Valued at USD 8.58 billion in 2025, the market is projected to reach USD 11.73 billion by 2032, registering an annual growth rate of approximately 4.57%. Rising demand for oxygen, nitrogen, and specialty gases is driven by robust industrial output, with economic growth forecasts of 2.3% for 2025 and 2.5% for 2026 reinforcing market momentum. The pulp and paper, metal fabrication, petrochemicals, healthcare, and food processing industries are among the key sectors that are still using industrial gases to improve their production efficiency and meet the environmental standards.
This perspective is further reinforced by the growth of renewable-energy, with Brazil, Mexico, Chile, and Argentina expanding their clean-energy potential. Brazil alone has 213.9 gigawatts of installed renewable power, representing 58% of the region’s total, while the International Energy Agency projects an addition of 165 gigawatts of new capacity across the region between 2023 and 2028. This change increases the demand of industrial gases used in hydrogen production, energy infrastructure and maintenance processes. At the same time, the growing hydrogen initiatives are making Latin America a new clean-energy hub.
However, infrastructural issues are a significant limitation. Poor transport systems, port congestion, and expensive logistics are some of the factors that make it difficult to distribute gas efficiently, especially to smaller suppliers. Heavy reliance on nitrogen‑based fertilizer imports-approximately 80% for the region and 95% for Brazil—introduces supply volatility that influences pricing and availability of nitrogen‑related gases. In spite of these pressures, the region has a great potential of local production of fertilizers, which in the long run, would expand the gas demand.
Additionally, oxygen commands a 40% share, supported by its extensive use in pulp and paper, metal processing, and healthcare. Cylinders remain the dominant mode of supply, holding a 45% share, especially among small and mid‑sized industries. Brazil accounts for 40% of the regional market, driven by its diversified industrial base, strong renewable‑energy growth, and expanding manufacturing and healthcare sectors.

Latin America Industrial Gases Market Growth Driver
Expanding Industrial Base Strengthens Market Growth
The growing manufacturing and food-processing industries in Latin America are creating a long-term demand in industrial gases due to the increased demand of oxygen, nitrogen, and specialty gases in the region in the production-intensive industries. The strong pulp and paper industry in Brazil, along with the growing manufacturing and export-driven food production in Mexico and Brazil, underpins the growth in the use of industrial gas solutions in bleaching, freezing, packaging, and fabrication. Broader macroeconomic momentum reinforces this trend, with the World Bank projecting economic growth of 2.3% in 2025 and 2.5% in 2026 for Latin America and the Caribbean, enabling higher industrial output and deepening gas requirements across end‑use industries that rely heavily on process gases for operational continuity and efficiency.
Renewable‑energy expansion further amplifies market growth, with Brazil leading the region’s 2024 installed renewable capacity at 213.9 gigawatts-equivalent to 58% of Latin America’s total—followed by Mexico at 34 gigawatts. The International Energy Agency predicts that by 2023 to 2028, Brazil, Chile, Mexico, and Argentina will add 165 gigawatts of renewable capacity, which will strain the demand of industrial gases in hydrogen projects, maintenance work, and energy infrastructure. This shift to clean energy increases the demand of oxygen, nitrogen, and specialty gases, which strengthens a robust growth trend of the Latin America industrial gases market.
Latin America Industrial Gases Market Challenge
Infrastructure Inefficiencies Create Persistent Market Barriers
Latin America infrastructure constraints remain a limiting factor to the efficiency of industrial-gas distribution, which increases logistics expenses and operational complexity to a significant degree. Poor road and rail infrastructure, and overloaded ports, result in significant freight delays, compelling gas suppliers to maintain decentralized production and storage systems in more than one country. These inefficiencies are disproportionately impacting smaller industrial-gas distributors, which are less competitive and have higher delivery costs. The discontinuous logistics landscape makes it more expensive to serve distributed end users, exacerbating regional differences in supply reliability and slowing the adoption of advanced gas delivery systems.
The reliance of the region on imports of nitrogen-based fertilizers further complicates supply chains, which directly affects the prices and supply of industrial-gas. Brazil imports nearly 95% of its nitrogenous fertilizers, while Latin America collectively imports about 80%, producing a trade deficit of up to 0.4% of GDP for major economies. This dependence increases vulnerability to international price volatility and supply shocks of nitrogen-related gases to make fertilizers and agricultural purposes. To solve these infrastructure and importation issues, it is necessary to invest in the long term and coordinate policies to enhance the efficiency of distribution and competitiveness in the Latin America industrial gases market.
Unlock Market Intelligence
Explore the market potential with our data-driven report
Latin America Industrial Gases Market Trend
Hydrogen Development Gains Momentum Across the Region
Latin America is quickly becoming a strategic hydrogen hub, with substantial renewable-energy sources and national decarbonization efforts. Regional hydrogen demand reached 4 million tonnes in 2023, representing approximately 4% of global consumption, driven largely by refining and chemical manufacturing. The International Energy Agency, in its Global Hydrogen Review 2024, indicates that by 2030, Latin America may produce over 7 million tonnes of hydrogen each year due to large-scale renewable-powered electrolysis projects in Chile, Argentina, and Brazil. Chile is the only country that contributes almost half of the expected low-carbon hydrogen production because of the rich renewable energy sources and strong policy frameworks.
This growing hydrogen environment increases the local demand of industrial gases that are vital in hydrogen production, purification and distribution. Oxygen, nitrogen, and specialty gases are needed in large-scale hydrogen and ammonia export projects to achieve efficiency and infrastructure development. With Latin America’s electricity matrix already 65% renewable-double the global average-equipment manufacturers and gas suppliers are expanding operations to support the emerging hydrogen economy. With the increased clean-energy commitments by countries, the industrial-gas demand associated with hydrogen production, storage, and downstream use will reinforce the long-term perspective of the Latin America industrial gases market.
Latin America Industrial Gases Market Opportunity
Localized Fertilizer Manufacturing
Latin America has a great potential of producing domestic nitrogen-fertilizers, which is a revolution in the long-term growth of the industrial-gas market. Despite consuming 13.6 million tonnes of nitrogen‑based fertilizers in 2021—surpassing the European Union’s demand-the region imports approximately 85% of its requirements. With Brazil importing 95% of its nitrogen fertilizers, localized ammonia and urea production represents a strategic pathway to improve food security while fostering sustained demand for oxygen, nitrogen, hydrogen, and specialty gases used throughout fertilizer synthesis and processing.
This opportunity is reinforced by the availability of natural-gas resources, with the Vaca Muerta reserve in Argentina, access to U.S. natural gas in Mexico, and Brazilian shale potential providing dependable feedstocks to produce ammonia. The International Energy Agency identifies green ammonia as a significant decarbonization route, further matching agricultural requirements with clean-energy goals. Localized investments in fertilizer production would establish high-value industrialization, decrease reliance on imports, and make the region an emerging exporter of low-carbon fertilizer products. This would significantly increase the consumption of industrial-gas, which would facilitate structural market development throughout the Latin America industrial gases market.
Latin America Industrial Gases Market Country Analysis
By Country
- Brazil
- Mexico
- Argentina
- Chile
- Colombia
- Peru
- Rest of Latin America
Brazil leads the Latin America industrial gases market with a market share of aroud 40%. It is due to its status as the region’s largest economy and most diversified industrial center. Key industries-including pulp and paper, petrochemical refining, automotive production, and large-scale food processing-drive substantial demand for oxygen, nitrogen, and specialty gases. Growing healthcare infrastructure and expansion of export-oriented manufacturing further strengthen Brazil’s consumption profile, reinforcing its central role in shaping regional industrial gas requirements.
Brazil also leads renewable energy development, hosting 213.9 gigawatts of installed capacity, representing 58% of Latin America’s total. This positions the country as a pivotal player in emerging hydrogen markets, supported by ongoing clean hydrogen initiatives and offshore pre-salt oil and gas projects. Strong distribution networks and the presence of major international suppliers such as Linde, Air Liquide, and Air Products enhance market stability. With continued industrial expansion and nearshoring trends, Brazil is expected to maintain its dominant position through 2026–2032, serving as the primary anchor for regional industrial gas demand.
Unlock Market Intelligence
Explore the market potential with our data-driven report
Latin America Industrial Gases Market Segmentation Analysis
By Gas Type
- Nitrogen Gas
- Oxygen Gas
- Carbon Dioxide Gas
- Argon Gas
- Helium Gas
- Hydrogen Gas
- Other
Oxygen remains the dominant segment in the Latin America industrial gases market, accounting for approximately 40% of total gas-type demand due to its extensive application across high-use industrial sectors. Brazil’s pulp and paper industry-one of the region’s largest—relies heavily on oxygen for bleaching, delignification, chemical recovery, and wastewater treatment. Additionally, oxygen plays a critical role in metal fabrication, welding processes, petrochemical refining, and healthcare infrastructure, supporting consistent demand as these industries expand across Brazil, Mexico, and Argentina.
Growth within the region’s food processing, healthcare, and manufacturing sectors further reinforces oxygen’s leading position. Its versatility and importance in achieving environmental compliance, particularly in emissions control and wastewater treatment, contribute to stable and rising demand. As manufacturing output strengthens alongside economic recovery, oxygen consumption closely mirrors industrial production trends. This deep integration across essential industries ensures oxygen maintains its leadership within the gas-type segmentation, underscoring its foundational role in supporting the operational needs of diverse end users throughout the 2026-2032 forecast period.

By Supply Mode
- Cylinders
- Bulk
- On-Site Production
- Captive
- Other
Cylinder-based supply accounts for 45% of the Latin America industrial gases market, making it the leading distribution method across the region’s industrial landscape. This dominance is driven by the prevalence of small and mid-sized manufacturing units, food processing facilities, and healthcare institutions that require flexible, portable, and cost-effective gas delivery systems. Moreover due to the region’s geographically dispersed industrial operations and uneven infrastructure development, cylinders remain the most practical and accessible mode for end users lacking bulk storage capabilities or onsite generation facilities.
Although cylinders dominate due to accessibility and logistical suitability, market dynamics are gradually shifting as large-scale industrial clusters in Brazil and Mexico adopt bulk liquid and onsite gas generation systems to optimize costs and ensure steady supply. These transitions reflect growing industrial consolidation and rising sophistication among major manufacturers. However, the widespread use of cylinder delivery across emerging industrial zones ensures its continued relevance, supporting diverse application needs and offering reliable access to industrial gases for a broad base of end users across Latin America.
Various Market Players in Latin America Industrial Gases Market
The companies mentioned below are highly active in the Latin America industrial gases market, occupying a considerable portion of the market and shaping industry progress.
- IBG (Indústria Brasileira de Gases)
- Taiyo Nippon Sanso
- Iwatani Corporation
- Linde
- Air Products
- Air Liquide
- Messer Group
- Grupo Infra
- AOC México
- Exel Air
- Praxair
Market News & Updates
- Linde, 2025:
White Martins expanded Latin America’s green hydrogen landscape with the startup of a 5 MW pressurized alkaline electrolyzer in Jacareí, São Paulo. Powered by solar and wind energy, the plant supplies green hydrogen to Cebrace and other industrial users in glass, metals, chemicals, and food processing. The investment reinforces Linde’s first-mover advantage in industrial-scale green hydrogen production in South America.
- Air Products, 2025:
Air Products restructured its Latin America strategy in 2025 by shifting focus toward lower-risk, contract-secured industrial gases projects. The company prioritized core products-oxygen, nitrogen, hydrogen, and CO₂-to support petrochemical refining, large-scale mining in Chile, and the expanding food and beverage sectors in Brazil, Mexico, and Argentina.
Frequently Asked Questions
Related Report
1. Market Segmentation
1.1. Research Scope
1.2. Research Methodology
1.3. Definitions and Assumptions
2. Executive Summary
3. Latin America Industrial Gases Market Policies, Regulations, and Standards
4. Latin America Industrial Gases Market Dynamics
4.1. Growth Factors
4.2. Challenges
4.3. Trends
4.4. Opportunities
5. Latin America Industrial Gases Market Statistics, 2022-2032F
5.1. Market Size & Growth Outlook
5.1.1.By Revenues in USD Million
5.1.2.By Quantity Sold in Tons
5.2. Market Segmentation & Growth Outlook
5.2.1.By Gas Type
5.2.1.1. Nitrogen Gas- Market Insights and Forecast 2022-2032, USD Million & Quantity in Tons
5.2.1.2. Oxygen Gas- Market Insights and Forecast 2022-2032, USD Million & Quantity in Tons
5.2.1.3. Carbon Dioxide Gas- Market Insights and Forecast 2022-2032, USD Million & Quantity in Tons
5.2.1.4. Argon Gas- Market Insights and Forecast 2022-2032, USD Million & Quantity in Tons
5.2.1.5. Helium Gas- Market Insights and Forecast 2022-2032, USD Million & Quantity in Tons
5.2.1.6. Hydrogen Gas- Market Insights and Forecast 2022-2032, USD Million & Quantity in Tons
5.2.1.7. Other- Market Insights and Forecast 2022-2032, USD Million & Quantity in Tons
5.2.2.By Supply Mode
5.2.2.1. Cylinders- Market Insights and Forecast 2022-2032, USD Million & Quantity in Tons
5.2.2.2. Bulk- Market Insights and Forecast 2022-2032, USD Million & Quantity in Tons
5.2.2.3. On-Site Production- Market Insights and Forecast 2022-2032, USD Million & Quantity in Tons
5.2.2.4. Captive- Market Insights and Forecast 2022-2032, USD Million & Quantity in Tons
5.2.2.5. Other- Market Insights and Forecast 2022-2032, USD Million & Quantity in Tons
5.2.3.By Application
5.2.3.1. Combustion and Process Oxygen- Market Insights and Forecast 2022-2032, USD Million & Quantity in Tons
5.2.3.2. Welding and Metal Fabrication- Market Insights and Forecast 2022-2032, USD Million & Quantity in Tons
5.2.3.3. Inerting Blanketing and Heat Treating- Market Insights and Forecast 2022-2032, USD Million & Quantity in Tons
5.2.3.4. Cryogenics and liquefaction- Market Insights and Forecast 2022-2032, USD Million & Quantity in Tons
5.2.3.5. Chemical Synthesis and Hydrogenation- Market Insights and Forecast 2022-2032, USD Million & Quantity in Tons
5.2.3.6. Purging and Purifications- Market Insights and Forecast 2022-2032, USD Million & Quantity in Tons
5.2.3.7. Analytical and Calibration- Market Insights and Forecast 2022-2032, USD Million & Quantity in Tons
5.2.4.By End User Industry
5.2.4.1. General Manufacturing- Market Insights and Forecast 2022-2032, USD Million & Quantity in Tons
5.2.4.2. Food- Market Insights and Forecast 2022-2032, USD Million & Quantity in Tons
5.2.4.3. Metallurgy- Market Insights and Forecast 2022-2032, USD Million & Quantity in Tons
5.2.4.4. Chemicals- Market Insights and Forecast 2022-2032, USD Million & Quantity in Tons
5.2.4.5. Healthcare- Market Insights and Forecast 2022-2032, USD Million & Quantity in Tons
5.2.4.6. Electronics- Market Insights and Forecast 2022-2032, USD Million & Quantity in Tons
5.2.4.7. Refining & Energy- Market Insights and Forecast 2022-2032, USD Million & Quantity in Tons
5.2.4.8. Glass- Market Insights and Forecast 2022-2032, USD Million & Quantity in Tons
5.2.4.9. Pulp & Paper- Market Insights and Forecast 2022-2032, USD Million & Quantity in Tons
5.2.4.10. Others- Market Insights and Forecast 2022-2032, USD Million & Quantity in Tons
5.2.5.By Country
5.2.5.1. Brazil
5.2.5.2. Mexico
5.2.5.3. Argentina
5.2.5.4. Chile
5.2.5.5. Colombia
5.2.5.6. Peru
5.2.5.7. Rest of Latin America
5.2.6.By Competitors
5.2.6.1. Competition Characteristics
5.2.6.2. Market Share & Analysis
6. Brazil Industrial Gases Market Statistics, 2022-2032F
6.1. Market Size & Growth Outlook
6.1.1.By Revenues in USD Million
6.1.2.By Quantity Sold in Tons
6.2. Market Segmentation & Growth Outlook
6.2.1.By Gas Type- Market Insights and Forecast 2022-2032, USD Million & Quantity in Tons
6.2.2.By Supply Mode- Market Insights and Forecast 2022-2032, USD Million & Quantity in Tons
6.2.3.By Application- Market Insights and Forecast 2022-2032, USD Million & Quantity in Tons
6.2.4.By End User Industry- Market Insights and Forecast 2022-2032, USD Million & Quantity in Tons
7. Mexico Industrial Gases Market Statistics, 2022-2032F
7.1. Market Size & Growth Outlook
7.1.1.By Revenues in USD Million
7.1.2.By Quantity Sold in Tons
7.2. Market Segmentation & Growth Outlook
7.2.1.By Gas Type- Market Insights and Forecast 2022-2032, USD Million & Quantity in Tons
7.2.2.By Supply Mode- Market Insights and Forecast 2022-2032, USD Million & Quantity in Tons
7.2.3.By Application- Market Insights and Forecast 2022-2032, USD Million & Quantity in Tons
7.2.4.By End User Industry- Market Insights and Forecast 2022-2032, USD Million & Quantity in Tons
8. Argentina Industrial Gases Market Statistics, 2022-2032F
8.1. Market Size & Growth Outlook
8.1.1.By Revenues in USD Million
8.1.2.By Quantity Sold in Tons
8.2. Market Segmentation & Growth Outlook
8.2.1.By Gas Type- Market Insights and Forecast 2022-2032, USD Million & Quantity in Tons
8.2.2.By Supply Mode- Market Insights and Forecast 2022-2032, USD Million & Quantity in Tons
8.2.3.By Application- Market Insights and Forecast 2022-2032, USD Million & Quantity in Tons
8.2.4.By End User Industry- Market Insights and Forecast 2022-2032, USD Million & Quantity in Tons
9. Chile Industrial Gases Market Statistics, 2022-2032F
9.1. Market Size & Growth Outlook
9.1.1.By Revenues in USD Million
9.1.2.By Quantity Sold in Tons
9.2. Market Segmentation & Growth Outlook
9.2.1.By Gas Type- Market Insights and Forecast 2022-2032, USD Million & Quantity in Tons
9.2.2.By Supply Mode- Market Insights and Forecast 2022-2032, USD Million & Quantity in Tons
9.2.3.By Application- Market Insights and Forecast 2022-2032, USD Million & Quantity in Tons
9.2.4.By End User Industry- Market Insights and Forecast 2022-2032, USD Million & Quantity in Tons
10. Colombia Industrial Gases Market Statistics, 2022-2032F
10.1. Market Size & Growth Outlook
10.1.1. By Revenues in USD Million
10.1.2. By Quantity Sold in Tons
10.2. Market Segmentation & Growth Outlook
10.2.1. By Gas Type- Market Insights and Forecast 2022-2032, USD Million & Quantity in Tons
10.2.2. By Supply Mode- Market Insights and Forecast 2022-2032, USD Million & Quantity in Tons
10.2.3. By Application- Market Insights and Forecast 2022-2032, USD Million & Quantity in Tons
10.2.4. By End User Industry- Market Insights and Forecast 2022-2032, USD Million & Quantity in Tons
11. Peru Industrial Gases Market Statistics, 2022-2032F
11.1. Market Size & Growth Outlook
11.1.1. By Revenues in USD Million
11.1.2. By Quantity Sold in Tons
11.2. Market Segmentation & Growth Outlook
11.2.1. By Gas Type- Market Insights and Forecast 2022-2032, USD Million & Quantity in Tons
11.2.2. By Supply Mode- Market Insights and Forecast 2022-2032, USD Million & Quantity in Tons
11.2.3. By Application- Market Insights and Forecast 2022-2032, USD Million & Quantity in Tons
11.2.4. By End User Industry- Market Insights and Forecast 2022-2032, USD Million & Quantity in Tons
12. Competitive Outlook
12.1. Company Profiles
12.1.1. Linde
12.1.1.1. Business Description
12.1.1.2. Product Portfolio
12.1.1.3. Collaborations & Alliances
12.1.1.4. Recent Developments
12.1.1.5. Financial Details
12.1.1.6. Others
12.1.2. Air Products
12.1.2.1. Business Description
12.1.2.2. Product Portfolio
12.1.2.3. Collaborations & Alliances
12.1.2.4. Recent Developments
12.1.2.5. Financial Details
12.1.2.6. Others
12.1.3. Air Liquide
12.1.3.1. Business Description
12.1.3.2. Product Portfolio
12.1.3.3. Collaborations & Alliances
12.1.3.4. Recent Developments
12.1.3.5. Financial Details
12.1.3.6. Others
12.1.4. Messer Group
12.1.4.1. Business Description
12.1.4.2. Product Portfolio
12.1.4.3. Collaborations & Alliances
12.1.4.4. Recent Developments
12.1.4.5. Financial Details
12.1.4.6. Others
12.1.5. Grupo Infra
12.1.5.1. Business Description
12.1.5.2. Product Portfolio
12.1.5.3. Collaborations & Alliances
12.1.5.4. Recent Developments
12.1.5.5. Financial Details
12.1.5.6. Others
12.1.6. IBG (Indústria Brasileira de Gases)
12.1.6.1. Business Description
12.1.6.2. Product Portfolio
12.1.6.3. Collaborations & Alliances
12.1.6.4. Recent Developments
12.1.6.5. Financial Details
12.1.6.6. Others
12.1.7. Taiyo Nippon Sanso
12.1.7.1. Business Description
12.1.7.2. Product Portfolio
12.1.7.3. Collaborations & Alliances
12.1.7.4. Recent Developments
12.1.7.5. Financial Details
12.1.7.6. Others
12.1.8. Iwatani Corporation
12.1.8.1. Business Description
12.1.8.2. Product Portfolio
12.1.8.3. Collaborations & Alliances
12.1.8.4. Recent Developments
12.1.8.5. Financial Details
12.1.8.6. Others
12.1.9. AOC México
12.1.9.1. Business Description
12.1.9.2. Product Portfolio
12.1.9.3. Collaborations & Alliances
12.1.9.4. Recent Developments
12.1.9.5. Financial Details
12.1.9.6. Others
12.1.10. Exel Air
12.1.10.1.Business Description
12.1.10.2.Product Portfolio
12.1.10.3.Collaborations & Alliances
12.1.10.4.Recent Developments
12.1.10.5.Financial Details
12.1.10.6.Others
13. Disclaimer
| Segment | Sub-Segment |
|---|---|
| By Gas Type |
|
| By Supply Mode |
|
| By Application |
|
| By End User Industry |
|
| By Country |
|
Research Methodology
This study followed a structured approach comprising four key phases to assess the size and scope of the electro-oxidation market. The process began with thorough secondary research to collect data on the target market, related markets, and broader industry context. These findings, along with preliminary assumptions and estimates, were then validated through extensive primary research involving industry experts from across the value chain. To calculate the overall market size, both top-down and bottom-up methodologies were employed. Finally, market segmentation and data triangulation techniques were applied to refine and validate segment-level estimations.
Secondary Research
The secondary research phase involved gathering data from a wide range of credible and published sources. This step helped in identifying industry trends, defining market segmentation, and understanding the market landscape and value chain.
Sources consulted during this phase included:
- Company annual reports, investor presentations, and press releases
- Industry white papers and certified publications
- Trade directories and market-recognized databases
- Articles from authoritative authors and reputable journals
- Gold and silver standard websites
Secondary research was critical in mapping out the industry's value chain and monetary flow, identifying key market segments, understanding regional variations, and tracking significant industry developments.
Other key sources:
- Financial disclosures
- Industry associations and trade bodies
- News outlets and business magazines
- Academic journals and research studies
- Paid industry databases
Primary Research
To validate secondary data and gain deeper market insights, primary research was conducted with key stakeholders across both the supply and demand sides of the market.
On the demand side, participants included decision-makers and influencers from end-user industries—such as CIOs, CTOs, and CSOs—who provided first-hand perspectives on market needs, product usage, and future expectations.
On the supply side, interviews were conducted with manufacturers, industry associations, and institutional participants to gather insights into current offerings, product pipelines, and market challenges.
Primary interviews provided critical inputs such as:
- Market size and revenue data
- Product and service breakdowns
- Market forecasts
- Regional and application-specific trends
Stakeholders consulted included:
- Leading OEM and solution providers
- Channel and distribution partners
- End users across various applications
- Independent consultants and industry specialists
Market Size Estimation and Data Triangulation
- Identifying Key Market Participants (Secondary Research)
- Goal: To identify the major players or companies in the target market. This typically involves using publicly available data sources such as industry reports, market research publications, and financial statements of companies.
- Tools: Reports from firms like Gartner, Forrester, Euromonitor, Statista, IBISWorld, and others. Public financial statements, news articles, and press releases from top market players.
- Extracting Earnings of Key Market Participants
- Goal: To estimate the earnings generated from the product or service being analyzed. This step helps in understanding the revenue potential of each market player in a specific geography.
- Methods: Earnings data can be gathered from:
- Publicly available financial reports (for listed companies).
- Interviews and primary data sources from professionals, such as Directors, VPs, SVPs, etc. This is especially useful for understanding more nuanced, internal data that isn't publicly disclosed.
- Annual reports and investor presentations of key players.
- Data Collation and Development of a Relevant Data Model
- Goal: To collate inputs from both primary and secondary sources into a structured, data-driven model for market estimation. This model will incorporate key market KPIs and any independent variables relevant to the market.
- Key KPIs: These could include:
- Market size, growth rate, and demand drivers.
- Industry-specific metrics like market share, average revenue per customer (ARPC), or average deal size.
- External variables, such as economic growth rates, inflation rates, or commodity prices, that could affect the market.
- Data Modeling: Based on this data, the market forecasts are developed for the next 5 years. A combination of trend analysis, scenario modeling, and statistical regression might be used to generate projections.
- Scenario Analysis
- Goal: To test different assumptions and validate how sensitive the market is to changes in key variables (e.g., market demand, regulatory changes, technological disruptions).
- Types of Scenarios:
- Base Case: Based on current assumptions and historical data.
- Best-Case Scenario: Assuming favorable market conditions, regulatory environments, and technological advancements.
- Worst-Case Scenario: Accounting for adverse factors, such as economic downturns, stricter regulations, or unexpected disruptions.


