Kenya Beer Market Report: Trends, Growth and Forecast (2026-2032)
Product Type (Dark Beer (Ale, Sorghum Beer, Weissbier/Weizen/Wheat Beer), Lager (Flavoured/Mixed Lager, Standard Lager (Premium Lager (Domestic Premium Lager, Imported Premium Lager), Mid-Priced Lager (Domestic Mid-Priced Lager, Imported Mid-Priced Lager), Economy Lager (Domestic Economy Lager, Imported Economy Lager))), Non/Low Alcohol Beer (Low Alcohol Beer, Non Alcoholic Beer), Stout, Others (Porter, Malt etc.)), Production (Macro Brewery, Micro Brewery, Craft Brewery), Packaging Type (Bottles, Cans, Others), Sales Channel (On-Trade, Off-Trade) ... Read more
|
Major Players
|
Kenya Beer Market Statistics and Insights, 2026
- Market Size Statistics
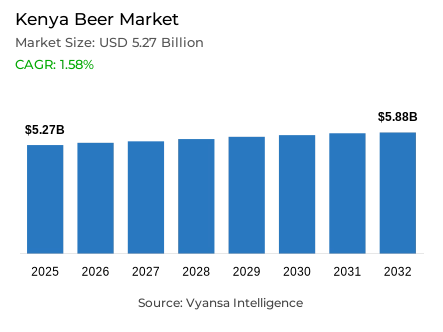
- Beer in Kenya is estimated at USD 5.27 billion.
- The market size is expected to grow to USD 5.88 billion by 2032.
- Market to register a cagr of around 1.58% during 2026-32.
- Product Type Shares
- Lager grabbed market share of 80%.
- Lager to witness a volume cagr of around 2.31%.
- Competition
- More than 5 companies are actively engaged in producing beer in Kenya.
- Top 5 companies acquired around 60% of the market share.
- Ozzbeco Kenya Ltd, Crown Beverages Ltd, Jovet Tanzania Ltd, East African Breweries Ltd, Keroche Breweries Ltd etc., are few of the top companies.
- Sales Channel
- On-trade grabbed 90% of the market.
Kenya Beer Market Outlook
The Kenya beer market is $5.27 billion in 2025 and will be $5.88 billion in 2032, with a CAGR of about 1.58% during 2026–2032. The market will continue to show moderate volume growth, supported by strong demand for domestically flavored beers and growing experimentation among younger legal drinking-age end users. Off-trade, which accounts for nearly 90% of total sales, will prevail because beer is still a social beverage, especially for end users under the age of 30. However, Retail online will witness steady expansion, driven by convenience and retail digitalisation.
Lager with a market share of 80% will remain the most consumed beer in Kenya, with a volume CAGR of some 2.31%. Economy brands as Senator Lager will sustain affordability-led demand, while premium and mid-priced lagers such as Tusker, Pilsner, and Heineken will gain popularity with urban end users as a quest for more quality and taste. Shift to quality over quantity will be in evidence, driven by Kenya's emerging middle class and urbanisation.
Locally made, locally inspired beers will gain even more momentum, with majors such as Bila Shaka's Capitan Lager and EABL's Manyatta craft range using local inputs to tap end users who are passionate about authenticity and sustainability. The movement, not just encourages local sourcing but also reaffirms brand identity among younger, experience-driven end users looking for products that have a story to tell.
Innovation will remain a key growth driver throughout the forecast period. Breweries will introduce additional flavour variants, expand craft volumes, and introduce green packaging to complement sustainability initiatives. Increasing social media consumption and experiential formats such as microbreweries and taprooms will also boost beer manufacturers to build relationship and brand affinity in Kenya's evolving beer market.

Kenya Beer Market Growth DriverHigh Demand for Economy Beers at Reasonable Prices Drives Market Growth
The Kenya Beer Market continues to grow, with most of its growth being spurred by the strong performance of economy beer brands such as Senator Lager. Regardless of inflation being an issue, end users are still inclined towards low-cost beers, ensuring steady market demand. Cavernation of these beers across the country and new additions of flavors and pack sizes also make them more appealing among low- and middle-income earners.
At the same time, companies like EABL diversify portfolios by offering economy and mid-range beers, catering to the largest possible number of end users. This strategy not only propels volume sales but also supports brand visibility in urban and rural regions. The continued popularity of inexpensive beers keeps the market strong and accessible to a wide range of end end users.
Kenya Beer Market TrendIncreasing Urban End-Users Demand for Premium and Craft Beers
There is a definite drift towards premium and craft beers defining the Kenya Beer Market. With there being greater urbanization and incomes, there is greater selectivity by end users who are ready to pay a premium for good-quality items that are distinctive in taste and appearance. Tusker Ndimu and Manyatta are capturing this evolving palate by combining quality with innovation to cater to new-generation end users.
This expanding demand for premium beers is within a broader trend in lifestyle and consumption shifts. As end users in cities prioritize taste, experience, and authenticity above volume, brewers are responding with locally inspired, innovative products. The movement from mainstream lagers to premium and craft beers signals growing maturity of Kenyan beer culture.
Unlock Market Intelligence
Explore the market potential with our data-driven report
Kenya Beer Market OpportunityExpansion Through Locally Inspired and Innovative Craft Beers
Kenya Beer Market is ready for expansion through the development of locally born craft beers using local ingredients. Businesses such as Bila Shaka and EABL's Manyatta brand are at the forefront of developing beers that connect well with local culture and sustainability values. They find appeal among urban, youth end users who seek authenticity and quality and also want to support their local economy.
In future, this focus on local innovation, unique taste, and eco-friendly packaging will offer new opportunities for growth among brewers. More taproom experiences, storytelling marketing, and online activity will also increasingly cement the relationship between brands and final end users, enabling companies to build loyalty and differentiation in a competitive marketplace.
Unlock Market Intelligence
Explore the market potential with our data-driven report
Kenya Beer Market Segmentation Analysis

By Product Type
- Dark Beer
- Lager
- Non/Low Alcohol Beer
- Stout
The segment with highest market share under Product Type is Lager, with a market share of around 80%. Lager is the beer market leader in Kenya, spurred by strong demand for economy and mid-range brands such as Senator and Tusker. Its global availability, affordability, and consistency of taste profile make it the most desired brand among Kenyan beer end users. Despite inflationary pressures, the category is supported by steady demand in both urban and rural markets since brands keep innovating package and flavor innovations to appeal to different end-users.
Lager,will also record a volume CAGR of approximately 2.31%, exhibiting continued growth momentum. The segment will be supported by additional resilience through growing demand for premium and craft-style lagers such as Tusker Ndimu and Manyatta, which resonate with urban end users for quality and variety. The combination of price affordability and innovation assures lager dominance in Kenya's beer market.
By Sales Channel
- On-Trade
- Off-Trade
The segment with highest market share under Sales Channel is On-Trade with approximately 90% market share. Taprooms, restaurants, and bars are among the on-trade channels that remain at the center of Kenya's beer culture, especially among young final end users who favor social drinking occasions. The supremacy is backed by strong consumption of beer in social and recreational channels where the brands such as Tusker and Guinness have excellent visibility and popularity.
Moreover, brewers are enhancing the on-trade experience with developments such as EABL's microbrewery taprooms, offering fresh craft beer and interactive tasting sessions. Although e-commerce and supermarkets are gradually increasing, on-trade will continue to control the market due to Kenya's vibrant nightlife and social booze culture. The cultural deeply embedded importance of the channel and experiential appeal will continue to hold a strong grip over the forecast period.
Top Companies in Kenya Beer Market
The top companies operating in the market include Ozzbeco Kenya Ltd, Crown Beverages Ltd, Jovet Tanzania Ltd, East African Breweries Ltd, Keroche Breweries Ltd, Coca-Cola East & Central Africa Division, etc., are the top players operating in the Kenya beer market.
Frequently Asked Questions
Related Report
1. Market Segmentation
1.1. Research Scope
1.2. Research Methodology
1.3. Definitions and Assumptions
2. Executive Summary
3. Kenya Beer Market Policies, Regulations, and Standards
4. Kenya Beer Market Dynamics
4.1. Growth Factors
4.2. Challenges
4.3. Trends
4.4. Opportunities
5. Kenya Beer Market Statistics, 2022-2032F
5.1. Market Size & Growth Outlook
5.1.1.By Revenues in US$ Million
5.1.2.By Quantity Sold in Million Litres
5.2. Market Segmentation & Growth Outlook
5.2.1.By Product Type
5.2.1.1. Dark Beer- Market Insights and Forecast 2022-2032, USD Million
5.2.1.1.1. Ale- Market Insights and Forecast 2022-2032, USD Million
5.2.1.1.2. Sorghum Beer- Market Insights and Forecast 2022-2032, USD Million
5.2.1.1.3. Weissbier/Weizen/Wheat Beer- Market Insights and Forecast 2022-2032, USD Million
5.2.1.2. Lager- Market Insights and Forecast 2022-2032, USD Million
5.2.1.2.1. Flavoured/Mixed Lager- Market Insights and Forecast 2022-2032, USD Million
5.2.1.2.2. Standard Lager- Market Insights and Forecast 2022-2032, USD Million
5.2.1.2.2.1. Premium Lager- Market Insights and Forecast 2022-2032, USD Million
5.2.1.2.2.1.1. Domestic Premium Lager- Market Insights and Forecast 2022-2032, USD Million
5.2.1.2.2.1.2. Imported Premium Lager- Market Insights and Forecast 2022-2032, USD Million
5.2.1.2.2.2. Mid-Priced Lager- Market Insights and Forecast 2022-2032, USD Million
5.2.1.2.2.2.1. Domestic Mid-Priced Lager- Market Insights and Forecast 2022-2032, USD Million
5.2.1.2.2.2.2. Imported Mid-Priced Lager- Market Insights and Forecast 2022-2032, USD Million
5.2.1.2.2.3. Economy Lager- Market Insights and Forecast 2022-2032, USD Million
5.2.1.2.2.3.1. Domestic Economy Lager- Market Insights and Forecast 2022-2032, USD Million
5.2.1.2.2.3.2. Imported Economy Lager- Market Insights and Forecast 2022-2032, USD Million
5.2.1.3. Non/Low Alcohol Beer- Market Insights and Forecast 2022-2032, USD Million
5.2.1.3.1. Low Alcohol Beer- Market Insights and Forecast 2022-2032, USD Million
5.2.1.3.2. Non Alcoholic Beer- Market Insights and Forecast 2022-2032, USD Million
5.2.1.4. Stout- Market Insights and Forecast 2022-2032, USD Million
5.2.1.5. Others (Porter, Malt etc.) - Market Insights and Forecast 2022-2032, USD Million
5.2.2.By Production
5.2.2.1. Macro Brewery- Market Insights and Forecast 2022-2032, USD Million
5.2.2.2. Micro Brewery- Market Insights and Forecast 2022-2032, USD Million
5.2.2.3. Craft Brewery- Market Insights and Forecast 2022-2032, USD Million
5.2.3.By Packaging Type
5.2.3.1. Bottles- Market Insights and Forecast 2022-2032, USD Million
5.2.3.2. Cans- Market Insights and Forecast 2022-2032, USD Million
5.2.3.3. Others- Market Insights and Forecast 2022-2032, USD Million
5.2.4.By Sales Channel
5.2.4.1. On-Trade- Market Insights and Forecast 2022-2032, USD Million
5.2.4.2. Off-Trade- Market Insights and Forecast 2022-2032, USD Million
5.2.5.By Competitors
5.2.5.1. Competition Characteristics
5.2.5.2. Market Share & Analysis
6. Kenya Dark Beer Market Statistics, 2022-2032F
6.1. Market Size & Growth Outlook
6.1.1.By Revenues in US$ Million
6.1.2.By Quantity Sold in Million Litres
6.2. Market Segmentation & Growth Outlook
6.2.1.By Product Type- Market Insights and Forecast 2022-2032, USD Million
6.2.2.By Production- Market Insights and Forecast 2022-2032, USD Million
6.2.3.By Packaging Type- Market Insights and Forecast 2022-2032, USD Million
6.2.4.By Sales Channel- Market Insights and Forecast 2022-2032, USD Million
7. Kenya Lager Beer Market Statistics, 2022-2032F
7.1. Market Size & Growth Outlook
7.1.1.By Revenues in US$ Million
7.1.2.By Quantity Sold in Million Litres
7.2. Market Segmentation & Growth Outlook
7.2.1.By Product Type- Market Insights and Forecast 2022-2032, USD Million
7.2.2.By Production- Market Insights and Forecast 2022-2032, USD Million
7.2.3.By Packaging Type- Market Insights and Forecast 2022-2032, USD Million
7.2.4.By Sales Channel- Market Insights and Forecast 2022-2032, USD Million
8. Kenya Non/Low Alcohol Beer Market Statistics, 2022-2032F
8.1. Market Size & Growth Outlook
8.1.1.By Revenues in US$ Million
8.1.2.By Quantity Sold in Million Litres
8.2. Market Segmentation & Growth Outlook
8.2.1.By Production- Market Insights and Forecast 2022-2032, USD Million
8.2.2.By Packaging Type- Market Insights and Forecast 2022-2032, USD Million
8.2.3.By Sales Channel- Market Insights and Forecast 2022-2032, USD Million
9. Kenya Stout Beer Market Statistics, 2022-2032F
9.1. Market Size & Growth Outlook
9.1.1.By Revenues in US$ Million
9.1.2.By Quantity Sold in Million Litres
9.2. Market Segmentation & Growth Outlook
9.2.1.By Production- Market Insights and Forecast 2022-2032, USD Million
9.2.2.By Packaging Type- Market Insights and Forecast 2022-2032, USD Million
9.2.3.By Sales Channel- Market Insights and Forecast 2022-2032, USD Million
10. Competitive Outlook
10.1. Company Profiles
10.1.1. East African Breweries Ltd
10.1.1.1. Business Description
10.1.1.2. Product Portfolio
10.1.1.3. Collaborations & Alliances
10.1.1.4. Recent Developments
10.1.1.5. Financial Details
10.1.1.6. Others
10.1.2. Keroche Breweries Ltd
10.1.2.1. Business Description
10.1.2.2. Product Portfolio
10.1.2.3. Collaborations & Alliances
10.1.2.4. Recent Developments
10.1.2.5. Financial Details
10.1.2.6. Others
10.1.3. Crown Beverages Ltd
10.1.3.1. Business Description
10.1.3.2. Product Portfolio
10.1.3.3. Collaborations & Alliances
10.1.3.4. Recent Developments
10.1.3.5. Financial Details
10.1.3.6. Others
10.1.4. Jovet Tanzania Ltd
10.1.4.1. Business Description
10.1.4.2. Product Portfolio
10.1.4.3. Collaborations & Alliances
10.1.4.4. Recent Developments
10.1.4.5. Financial Details
10.1.4.6. Others
10.1.5. Coca-Cola East & Central Africa Division
10.1.5.1. Business Description
10.1.5.2. Product Portfolio
10.1.5.3. Collaborations & Alliances
10.1.5.4. Recent Developments
10.1.5.5. Financial Details
10.1.5.6. Others
10.1.6. Ozzbeco Kenya Ltd
10.1.6.1. Business Description
10.1.6.2. Product Portfolio
10.1.6.3. Collaborations & Alliances
10.1.6.4. Recent Developments
10.1.6.5. Financial Details
10.1.6.6. Others
11. Disclaimer
| Segment | Sub-Segment |
|---|---|
| By Product Type |
|
| By Production |
|
| By Packaging Type |
|
| By Sales Channel |
|
Research Methodology
This study followed a structured approach comprising four key phases to assess the size and scope of the electro-oxidation market. The process began with thorough secondary research to collect data on the target market, related markets, and broader industry context. These findings, along with preliminary assumptions and estimates, were then validated through extensive primary research involving industry experts from across the value chain. To calculate the overall market size, both top-down and bottom-up methodologies were employed. Finally, market segmentation and data triangulation techniques were applied to refine and validate segment-level estimations.
Secondary Research
The secondary research phase involved gathering data from a wide range of credible and published sources. This step helped in identifying industry trends, defining market segmentation, and understanding the market landscape and value chain.
Sources consulted during this phase included:
- Company annual reports, investor presentations, and press releases
- Industry white papers and certified publications
- Trade directories and market-recognized databases
- Articles from authoritative authors and reputable journals
- Gold and silver standard websites
Secondary research was critical in mapping out the industry's value chain and monetary flow, identifying key market segments, understanding regional variations, and tracking significant industry developments.
Other key sources:
- Financial disclosures
- Industry associations and trade bodies
- News outlets and business magazines
- Academic journals and research studies
- Paid industry databases
Primary Research
To validate secondary data and gain deeper market insights, primary research was conducted with key stakeholders across both the supply and demand sides of the market.
On the demand side, participants included decision-makers and influencers from end-user industries—such as CIOs, CTOs, and CSOs—who provided first-hand perspectives on market needs, product usage, and future expectations.
On the supply side, interviews were conducted with manufacturers, industry associations, and institutional participants to gather insights into current offerings, product pipelines, and market challenges.
Primary interviews provided critical inputs such as:
- Market size and revenue data
- Product and service breakdowns
- Market forecasts
- Regional and application-specific trends
Stakeholders consulted included:
- Leading OEM and solution providers
- Channel and distribution partners
- End users across various applications
- Independent consultants and industry specialists
Market Size Estimation and Data Triangulation
- Identifying Key Market Participants (Secondary Research)
- Goal: To identify the major players or companies in the target market. This typically involves using publicly available data sources such as industry reports, market research publications, and financial statements of companies.
- Tools: Reports from firms like Gartner, Forrester, Euromonitor, Statista, IBISWorld, and others. Public financial statements, news articles, and press releases from top market players.
- Extracting Earnings of Key Market Participants
- Goal: To estimate the earnings generated from the product or service being analyzed. This step helps in understanding the revenue potential of each market player in a specific geography.
- Methods: Earnings data can be gathered from:
- Publicly available financial reports (for listed companies).
- Interviews and primary data sources from professionals, such as Directors, VPs, SVPs, etc. This is especially useful for understanding more nuanced, internal data that isn't publicly disclosed.
- Annual reports and investor presentations of key players.
- Data Collation and Development of a Relevant Data Model
- Goal: To collate inputs from both primary and secondary sources into a structured, data-driven model for market estimation. This model will incorporate key market KPIs and any independent variables relevant to the market.
- Key KPIs: These could include:
- Market size, growth rate, and demand drivers.
- Industry-specific metrics like market share, average revenue per customer (ARPC), or average deal size.
- External variables, such as economic growth rates, inflation rates, or commodity prices, that could affect the market.
- Data Modeling: Based on this data, the market forecasts are developed for the next 5 years. A combination of trend analysis, scenario modeling, and statistical regression might be used to generate projections.
- Scenario Analysis
- Goal: To test different assumptions and validate how sensitive the market is to changes in key variables (e.g., market demand, regulatory changes, technological disruptions).
- Types of Scenarios:
- Base Case: Based on current assumptions and historical data.
- Best-Case Scenario: Assuming favorable market conditions, regulatory environments, and technological advancements.
- Worst-Case Scenario: Accounting for adverse factors, such as economic downturns, stricter regulations, or unexpected disruptions.


