Japan Robotaxi Market Report: Trends, Growth and Forecast (2026-2032)
By Level of Autonomy (Level 4, Level 5), By Vehicle Type (Cars, Shuttles/Vans, Purpose-Built Pods, Others), By Propulsion Type (Electric Vehicles (BEV), Hybrid Electric Vehicles (HEV), Fuel Cell Vehicles (FCV)), By Application (Passenger Transportation, Goods Transportation, Others), By Service Type (Ride-Hailing (On-Demand), Station-Based Shuttles, Goods Delivery, Others), By Component Type (LiDAR, Radar (mmWave), Camera, Ultrasonic Sensors, Sensor Fusion Systems, Others) ... Read more
|
Major Players
|
Japan Robotaxi Market Statistics and Insights, 2026
- Market Size Statistics
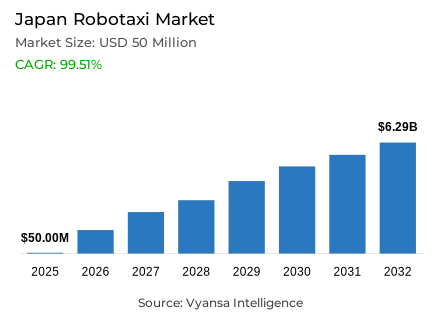
- Robotaxi market size in Japan was valued at USD 50 million in 2025 and is estimated at USD 60 million in 2026.
- The market size is expected to grow to USD 6.29 billion by 2032.
- Market to register a CAGR of around 99.51% during 2026-32.
- Application Shares
- Passenger transportation grabbed market share of 85%.
- Competition
- Robotaxi in Japan is currently being catered to by more than 10 companies.
- Top 5 companies acquired around 90% of the market share in 2026.
- Toyota Motor Corporation, NTT DOCOMO INC., Advanced Smart Mobility Co. Ltd., TIER IV Inc., BOLDLY Inc. etc., are few of the top companies.
- Service Type
- Station-based shuttles grabbed 55% of the market.
Japan Robotaxi Market Outlook
The Japan robotaxi market covers autonomous passenger vehicles, dispatch platforms, remote supervision, fleet orchestration, mapping, sensors, and mobility services across urban districts, airports, stations, campuses, and underserved communities. Demand comes from taxi operators, municipalities, transport authorities, property developers, tourism operators, and mobility platforms seeking dependable capacity without proportional driver recruitment. Valued at USD 50 million in 2025, the Japan robotaxi market reaches USD 60 million in 2026 and is projected at USD 6.29 billion by 2032, reflecting a 99.51% CAGR during 2026-32. The Japan robotaxi industry is moving from demonstrations toward structured commercial programs.
Operational adoption is supported by transport labor constraints, aging communities, dense urban demand, and government coordination around automated mobility. Level 4 deployment, connected infrastructure, high-definition mapping, electric drivetrains, and remote-assisted autonomous driving shape procurement specifications. Japan MaaS platforms strengthen integration with reservations, payment, station access, and municipal planning. These capabilities help robotaxi services in Japan move beyond isolated pilots, while geofenced deployment lets suppliers control safety exposure, validate performance, and progressively expand operational design domains.
Economic value increasingly concentrates in software, fleet operations, data collection, sensor integration, maintenance, teleoperations, and service assurance rather than vehicle hardware alone. The Japan robotaxi market can improve utilization, extend service hours, and reduce dependence on scarce drivers, but commercialization requires coordinated investment in depots, charging, mapping, communications, insurance, cybersecurity, and passenger support. The Japan robotaxi industry creates procurement opportunities for automakers, system developers, telecom operators, mapping specialists, infrastructure providers, and local partners supporting continuous operations and regulatory compliance.
Commercial momentum in 2026 centers on phased urban launches, municipal shuttle programs, data-centric AI development, and partnerships with established taxi fleets. The Japan autonomous taxi market rewards safe scaling, measurable availability, support, and transitions from supervised trials to paid operations, strengthening supplier positioning across software, vehicles, connectivity, and service delivery.

Japan Robotaxi Market Growth Driver
Workforce Scarcity Accelerates Autonomous Fleet Demand
Transport workforce shortages are accelerating demand for automated mobility because taxi and community-transport operators need capacity that is less dependent on driver availability. The Japan robotaxi market benefits from this structural gap across dense cities and depopulating municipalities, where service continuity, longer operating hours, and predictable fleet utilization increasingly influence procurement. The Japan robotaxi industry also gains from government efforts to connect autonomous operations with demand-responsive transport, digital dispatch, and regional mobility planning.
Japan’s Digital Agency stated in April 2026 that autonomous driving can satisfy travel demand constrained by driver shortages and that expanding Level 4 operating areas improves economics through scale. This direction strengthens the Level 4 robotaxi Japan pathway by encouraging municipalities and operators to move from route-specific trials toward territories. It supports vehicle procurement, remote-operations investment, and autonomous fleet management while showing that driverless taxi Japan deployments can address transport-supply deficits rather than remain technology demonstrations.
Japan Robotaxi Market Challenge
Operational Resilience Limits Commercial Scaling
Weather resilience, mixed traffic, narrow streets, dense pedestrian movement, and complex pickup zones constrain commercial scaling. The Japan robotaxi market must demonstrate stable performance across changing visibility, roadworks, bicycles, delivery vehicles, and irregular curb activity before operators can widen service areas. The Japan robotaxi industry therefore faces high validation costs, conservative operational design domains, and continued dependence on onboard safety personnel or remote intervention, which can delay cost reductions and weaken near-term fleet productivity.
MONET Technologies reported weather-related suspensions during its 2025 Tokyo Bay autonomous mobility demonstration, despite operating two vehicles, four boarding points, and twelve routes. The interruption shows how environmental conditions affect availability and passenger confidence. Japan robotaxi regulations, insurance requirements, and safety approvals must accommodate these risks, while suppliers need redundant sensing, localization, communications, and fallback procedures. Resilience spending materially increases deployment cost and can slow expansion of autonomous taxi services Japan beyond favorable routes and conditions.
Unlock Market Intelligence
Explore the market potential with our data-driven report
Japan Robotaxi Market Trend
Data-Centric AI Reframes Competitive Advantage
Data-centric autonomous-driving development is shifting competition from isolated vehicle testing toward scalable learning systems. The Japan robotaxi market increasingly values high-quality driving datasets, simulation, software updates, and fleet-wide model improvement because complex urban edge cases cannot be resolved through hardware upgrades alone. The Japan robotaxi industry is consequently prioritizing open software, shared data pipelines, sensor-rich collection vehicles, and autonomous vehicle MLOps that shorten validation cycles and support operational design domain expansion.
TIER IV and Nihon Kotsu began collecting road data in February 2025 using five operating taxis, with plans to expand to twenty vehicles. Their Co-MLOps approach creates datasets for autonomous-driving developers. The deployment strengthens the Autoware robotaxi platform by connecting commercial taxi operations with continuous AI improvement. It advances Tokyo robotaxi trials, improves perception-model localization, and reduces the cost of gathering representative traffic scenarios, reinforcing supplier differentiation through software performance rather than fleet ownership alone at national operating scale.
Japan Robotaxi Market Opportunity
Regional Mobility Gaps Create Contracting Potential
Regional transport gaps create an underpenetrated opportunity for municipal and station-linked autonomous services. The Japan robotaxi market can capture demand where aging populations, declining bus frequency, and limited driver supply leave residents with inadequate first-mile and last-mile connectivity. The Japan robotaxi industry can expand through public-private operating contracts that combine vehicles, dispatch, remote supervision, maintenance, and accessibility support, allowing suppliers to build recurring service relationships instead of relying only on vehicle sales.
According to Japan’s Digital Agency in January 2025, autonomous shuttle deployment in rural areas should be prioritized alongside the government target of one hundred locations by 2027. This direction supports rural autonomous mobility Japan by creating a pipeline for municipal procurement, route conversion, and operating partnerships. Suppliers offering fleets, remote monitoring, charging, mapping, and integrated MaaS can improve demand capture. The opportunity also strengthens station-to-destination autonomous transport and smart city robotaxi deployment where fixed-route economics are weakening.
Unlock Market Intelligence
Explore the market potential with our data-driven report
Japan Robotaxi Market Segmentation Analysis
By Application
- Passenger Transportation
- Goods Transportation
- Others
Passenger Transportation holds an 85% share under Application because current deployments concentrate on moving residents, commuters, tourists, older passengers, and mobility-constrained users. The Japan robotaxi market is therefore shaped primarily by service reliability, safe boarding, accessible vehicle design, dispatch integration, and coverage during periods when conventional taxis or buses are unavailable. Passenger use also generates repeat trip data, enabling operators to refine routes, pickup locations, service windows, and fleet allocation more quickly than lower-frequency applications.
Nissan announced in March 2025 that it planned automated ride-hailing demonstration tests involving twenty vehicles in Yokohama during fiscal years 2025 and 2026. The program provides a commercialization pathway for passenger transportation robotaxi services within a complex urban environment. It strengthens the Japan automated ride-hailing market by combining vehicle technology with an operating framework and stakeholder ecosystem. Repeated passenger trials improve service design, public familiarity, safety validation, and procurement confidence, supporting autonomous ride-hailing Japan adoption.

By Service Type
- Ride-Hailing (On-Demand)
- Station-Based Shuttles
- Goods Delivery
- Others
Station-Based Shuttles hold a 55% share under Service Type because fixed boarding points, repeatable routes, predictable schedules, and bounded operating areas reduce deployment complexity. The Japan robotaxi market benefits from this model across railway stations, airports, business districts, campuses, tourism zones, and municipal loops. Station-based robotaxi operations simplify mapping, charging, passenger communications, and remote supervision, while providing operators with clearer demand patterns and higher control over curb access and fleet circulation.
BOLDLY and Kajima advanced a Level 4 autonomous bus service near Haneda Airport in 2024 on an 800-meter circuit, with the vehicle operating at up to twelve kilometers per hour. The deployment demonstrates how controlled shuttle corridors can support driverless service delivery. Dedicated autonomous shuttle models improve operational reliability and compliance readiness because routes, stops, and fallback procedures are predefined. This strengthens investment in fleet-management systems, connected infrastructure, and service integration while creating reference projects for wider station-based deployment.
List of Companies Covered in Japan Robotaxi Market
The companies listed below are highly influential in the Japan robotaxi market, with a significant market share and a strong impact on industry developments.
- Toyota Motor Corporation
- NTT DOCOMO INC.
- Advanced Smart Mobility Co. Ltd.
- TIER IV Inc.
- BOLDLY Inc.
- MONET Technologies Inc.
- Macnica Inc.
- May Mobility Inc.
- Nissan Motor Co. Ltd.
- Waymo LLC
Market News & Updates
- May Mobility Inc., 2026:
May Mobility launched an autonomous mobility pilot in Toyota City using a fixed-route circulator and an on-demand service. The two routes cover approximately 10 miles and test first-mile and last-mile passenger demand on busy city streets. The deployment expands May Mobility’s Japanese operating footprint and evaluates two autonomous passenger-service models within one local program.
- Waymo LLC, 2025:
Waymo brought its autonomous vehicles to Tokyo and began preparing public-road operations with Nihon Kotsu and the GO taxi platform. Professionally driven vehicles are mapping seven central wards and collecting local traffic data to adapt the Waymo Driver to Japanese road conditions. The program establishes a technical and operational foundation for future autonomous ride-hailing deployment in Japan.
Frequently Asked Questions
Related Report
- Market Segmentation
- Research Scope
- Research Methodology
- Definitions and Assumptions
- Executive Summary
- Japan Robotaxi Market Policies, Regulations, and Standards
- Japan Robotaxi Market Dynamics
- Growth Factors
- Challenges
- Trends
- Opportunities
- Japan Robotaxi Market Statistics, 2022-2032F
- Market Size & Growth Outlook
- By Revenues in USD Million
- Market Segmentation & Growth Outlook
- By Level of Autonomy
- Level 4- Market Insights and Forecast 2022-2032, USD Million
- Level 5- Market Insights and Forecast 2022-2032, USD Million
- By Vehicle Type
- Cars- Market Insights and Forecast 2022-2032, USD Million
- Shuttles/Vans- Market Insights and Forecast 2022-2032, USD Million
- Purpose-Built Pods- Market Insights and Forecast 2022-2032, USD Million
- Others- Market Insights and Forecast 2022-2032, USD Million
- By Propulsion Type
- Electric Vehicles (BEV)- Market Insights and Forecast 2022-2032, USD Million
- Hybrid Electric Vehicles (HEV)- Market Insights and Forecast 2022-2032, USD Million
- Fuel Cell Vehicles (FCV)- Market Insights and Forecast 2022-2032, USD Million
- By Application
- Passenger Transportation- Market Insights and Forecast 2022-2032, USD Million
- Goods Transportation- Market Insights and Forecast 2022-2032, USD Million
- Others- Market Insights and Forecast 2022-2032, USD Million
- By Service Type
- Ride-Hailing (On-Demand)- Market Insights and Forecast 2022-2032, USD Million
- Station-Based Shuttles- Market Insights and Forecast 2022-2032, USD Million
- Goods Delivery- Market Insights and Forecast 2022-2032, USD Million
- Others- Market Insights and Forecast 2022-2032, USD Million
- By Component Type
- LiDAR- Market Insights and Forecast 2022-2032, USD Million
- Radar (mmWave)- Market Insights and Forecast 2022-2032, USD Million
- Camera- Market Insights and Forecast 2022-2032, USD Million
- Ultrasonic Sensors- Market Insights and Forecast 2022-2032, USD Million
- Sensor Fusion Systems- Market Insights and Forecast 2022-2032, USD Million
- Others- Market Insights and Forecast 2022-2032, USD Million
- By Competitors
- Competition Characteristics
- Market Share & Analysis
- By Level of Autonomy
- Market Size & Growth Outlook
- Japan Ride-Hailing (On-Demand) Market Statistics, 2022-2032
- Market Size & Growth Outlook
- By Revenues in USD Million
- Market Segmentation & Growth Outlook
- By Vehicle Type- Market Insights and Forecast 2022-2032, USD Million
- By Propulsion Type- Market Insights and Forecast 2022-2032, USD Million
- By Application- Market Insights and Forecast 2022-2032, USD Million
- By Service Type- Market Insights and Forecast 2022-2032, USD Million
- By Component Type- Market Insights and Forecast 2022-2032, USD Million
- Market Size & Growth Outlook
- Japan Station-Based Shuttles Market Statistics, 2022-2032
- Market Size & Growth Outlook
- By Revenues in USD Million
- Market Segmentation & Growth Outlook
- By Vehicle Type- Market Insights and Forecast 2022-2032, USD Million
- By Propulsion Type- Market Insights and Forecast 2022-2032, USD Million
- By Application- Market Insights and Forecast 2022-2032, USD Million
- By Service Type- Market Insights and Forecast 2022-2032, USD Million
- By Component Type- Market Insights and Forecast 2022-2032, USD Million
- Market Size & Growth Outlook
- Japan Goods Delivery Market Statistics, 2022-2032
- Market Size & Growth Outlook
- By Revenues in USD Million
- Market Segmentation & Growth Outlook
- By Vehicle Type- Market Insights and Forecast 2022-2032, USD Million
- By Propulsion Type- Market Insights and Forecast 2022-2032, USD Million
- By Application- Market Insights and Forecast 2022-2032, USD Million
- By Service Type- Market Insights and Forecast 2022-2032, USD Million
- By Component Type- Market Insights and Forecast 2022-2032, USD Million
- Market Size & Growth Outlook
- Competitive Outlook
- Company Profiles
- TIER IV Inc.
- Business Description
- Product Portfolio
- Collaborations & Alliances
- Recent Developments
- Financial Details
- Others
- BOLDLY Inc.
- Business Description
- Product Portfolio
- Collaborations & Alliances
- Recent Developments
- Financial Details
- Others
- MONET Technologies Inc.
- Business Description
- Product Portfolio
- Collaborations & Alliances
- Recent Developments
- Financial Details
- Others
- Macnica Inc.
- Business Description
- Product Portfolio
- Collaborations & Alliances
- Recent Developments
- Financial Details
- Others
- May Mobility Inc.
- Business Description
- Product Portfolio
- Collaborations & Alliances
- Recent Developments
- Financial Details
- Others
- Toyota Motor Corporation
- Business Description
- Product Portfolio
- Collaborations & Alliances
- Recent Developments
- Financial Details
- Others
- NTT DOCOMO INC.
- Business Description
- Product Portfolio
- Collaborations & Alliances
- Recent Developments
- Financial Details
- Others
- Advanced Smart Mobility Co. Ltd.
- Business Description
- Product Portfolio
- Collaborations & Alliances
- Recent Developments
- Financial Details
- Others
- Nissan Motor Co. Ltd.
- Business Description
- Product Portfolio
- Collaborations & Alliances
- Recent Developments
- Financial Details
- Others
- Waymo LLC
- Business Description
- Product Portfolio
- Collaborations & Alliances
- Recent Developments
- Financial Details
- Others
- TIER IV Inc.
- Company Profiles
- Disclaimer
| Segment | Sub-Segment |
|---|---|
| By Level of Autonomy |
|
| By Vehicle Type |
|
| By Propulsion Type |
|
| By Application |
|
| By Service Type |
|
| By Component Type |
|
Research Methodology
This study followed a structured approach comprising four key phases to assess the size and scope of the electro-oxidation market. The process began with thorough secondary research to collect data on the target market, related markets, and broader industry context. These findings, along with preliminary assumptions and estimates, were then validated through extensive primary research involving industry experts from across the value chain. To calculate the overall market size, both top-down and bottom-up methodologies were employed. Finally, market segmentation and data triangulation techniques were applied to refine and validate segment-level estimations.
Secondary Research
The secondary research phase involved gathering data from a wide range of credible and published sources. This step helped in identifying industry trends, defining market segmentation, and understanding the market landscape and value chain.
Sources consulted during this phase included:
- Company annual reports, investor presentations, and press releases
- Industry white papers and certified publications
- Trade directories and market-recognized databases
- Articles from authoritative authors and reputable journals
- Gold and silver standard websites
Secondary research was critical in mapping out the industry's value chain and monetary flow, identifying key market segments, understanding regional variations, and tracking significant industry developments.
Other key sources:
- Financial disclosures
- Industry associations and trade bodies
- News outlets and business magazines
- Academic journals and research studies
- Paid industry databases
Primary Research
To validate secondary data and gain deeper market insights, primary research was conducted with key stakeholders across both the supply and demand sides of the market.
On the demand side, participants included decision-makers and influencers from end-user industries—such as CIOs, CTOs, and CSOs—who provided first-hand perspectives on market needs, product usage, and future expectations.
On the supply side, interviews were conducted with manufacturers, industry associations, and institutional participants to gather insights into current offerings, product pipelines, and market challenges.
Primary interviews provided critical inputs such as:
- Market size and revenue data
- Product and service breakdowns
- Market forecasts
- Regional and application-specific trends
Stakeholders consulted included:
- Leading OEM and solution providers
- Channel and distribution partners
- End users across various applications
- Independent consultants and industry specialists
Market Size Estimation and Data Triangulation
- Identifying Key Market Participants (Secondary Research)
- Goal: To identify the major players or companies in the target market. This typically involves using publicly available data sources such as industry reports, market research publications, and financial statements of companies.
- Tools: Reports from firms like Gartner, Forrester, Euromonitor, Statista, IBISWorld, and others. Public financial statements, news articles, and press releases from top market players.
- Extracting Earnings of Key Market Participants
- Goal: To estimate the earnings generated from the product or service being analyzed. This step helps in understanding the revenue potential of each market player in a specific geography.
- Methods: Earnings data can be gathered from:
- Publicly available financial reports (for listed companies).
- Interviews and primary data sources from professionals, such as Directors, VPs, SVPs, etc. This is especially useful for understanding more nuanced, internal data that isn't publicly disclosed.
- Annual reports and investor presentations of key players.
- Data Collation and Development of a Relevant Data Model
- Goal: To collate inputs from both primary and secondary sources into a structured, data-driven model for market estimation. This model will incorporate key market KPIs and any independent variables relevant to the market.
- Key KPIs: These could include:
- Market size, growth rate, and demand drivers.
- Industry-specific metrics like market share, average revenue per customer (ARPC), or average deal size.
- External variables, such as economic growth rates, inflation rates, or commodity prices, that could affect the market.
- Data Modeling: Based on this data, the market forecasts are developed for the next 5 years. A combination of trend analysis, scenario modeling, and statistical regression might be used to generate projections.
- Scenario Analysis
- Goal: To test different assumptions and validate how sensitive the market is to changes in key variables (e.g., market demand, regulatory changes, technological disruptions).
- Types of Scenarios:
- Base Case: Based on current assumptions and historical data.
- Best-Case Scenario: Assuming favorable market conditions, regulatory environments, and technological advancements.
- Worst-Case Scenario: Accounting for adverse factors, such as economic downturns, stricter regulations, or unexpected disruptions.


