US Robotaxi Market Report: Trends, Growth and Forecast (2026-2032)
By Level of Autonomy (Level 4, Level 5), By Vehicle Type (Cars, Shuttles/Vans, Purpose-Built Pods, Others), By Propulsion Type (Electric Vehicles (BEV), Hybrid Electric Vehicles (HEV), Fuel Cell Vehicles (FCV)), By Application (Passenger Transportation, Goods Transportation, Others), By Service Type (Ride-Hailing (On-Demand), Station-Based Shuttles, Goods Delivery, Others), By Component Type (LiDAR, Radar (mmWave), Camera, Ultrasonic Sensors, Sensor Fusion Systems, Others), By Region (West, Midwest, South, North, Northeast) ... Read more
|
Major Players
|
US Robotaxi Market Statistics and Insights, 2026
- Market Size Statistics
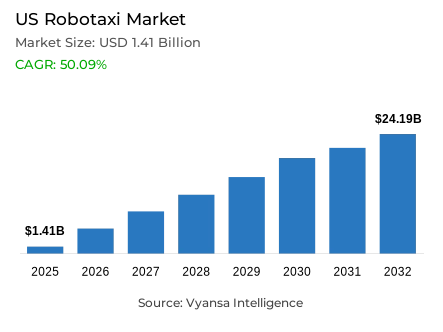
- Robotaxi market size in US was valued at USD 1.41 billion in 2025 and is estimated at USD 1.53 billion in 2026.
- The market size is expected to grow to USD 24.19 billion by 2032.
- Market to register a CAGR of around 50.09% during 2026-32.
- Application Shares
- Passenger transportation grabbed market share of 90%.
- Competition
- Robotaxi in US is currently being catered to by more than 10 companies.
- Top 5 companies acquired around 80% of the market share in 2026.
- Zoox Inc., AVRIDE Inc., Uber Technologies Inc., Waymo LLC (Waymo One), May Mobility Inc. etc., are few of the top companies.
- Service Type
- Ride-hailing (on-demand) grabbed 85% of the market.
US Robotaxi Market Outlook
The US robotaxi market covers autonomous vehicles, ride-hailing platforms, fleet-management systems, remote assistance, mapping, charging, maintenance, and operations. Primary users include commuters, airport travelers, non-drivers, transit agencies, mobility platforms, and campuses. Valued at USD 1.41 billion in 2025, the US robotaxi market reaches USD 1.53 billion in 2026 and is projected to attain USD 24.19 billion by 2032, reflecting a 50.09% CAGR during 2026-2032. Demand is shifting from supervised trials toward geofenced robotaxi services.
Commercial scaling depends on regulatory permission, dependable automated driving systems, mapping, fleet depots, electric charging, and platform integration. The US robotaxi industry benefits from expanding rider-only autonomous service, improving sensor fusion, lower computing costs, and app-based autonomous rides. State deployment rules remain decisive because operating domains, passenger-service permits, insurance, and incident reporting differ. Federal oversight and exemption pathways are also improving commercialization visibility while retaining safety accountability across the robotaxi market in the United States.
Economic value extends beyond fares into vehicle assembly, autonomous software, fleet operations, cloud infrastructure, insurance, cleaning, charging, roadside support, and curbside management. Waymo LLC (Waymo One), May Mobility, Inc., Beep, Inc., Tesla, Inc. (Robotaxi), Perrone Robotics, Inc., Zoox, Inc., AVRIDE Inc., Uber Technologies, Inc., Lyft, Inc., and Via Transportation, Inc. participate through operator, platform, shuttle, technology, and orchestration roles. Their priorities strengthen supplier positioning across the US robotaxi industry and increase demand for electric fleets.
National expansion in 2026 is tied to efficient hardware, generalized driving software, larger service territories, and partnerships connecting autonomous fleets with mobility demand. Waymo began fully autonomous operations with its sixth-generation Driver in February 2026, positioning a streamlined configuration for city deployment. This transition supports the US robotaxi market by reducing complexity, improving fleet scalability, and widening access. Competitive advantage in the US robotaxi industry depends on deployment velocity, utilization, regulatory readiness, and rider availability.

US Robotaxi Market Growth Driver
Urban Mobility Automation Accelerates Commercial Demand
Urban demand for round-the-clock mobility is accelerating autonomous ride-hailing adoption, particularly where service availability, accessibility, and operating consistency remain uneven. The US robotaxi industry gains momentum as fleet operators replace driver-dependent capacity with software-directed vehicles that can be repositioned, charged, and dispatched according to demand. High vehicle utilization, predictable service coverage, and lower marginal labor exposure improve the case for on-demand autonomous transport while encouraging platform operators, cities, and fleet owners to expand procurement commitments.
Waymo reported that its annual fully autonomous ride volume more than tripled to 15 million trips in 2025, taking lifetime rides beyond 20 million. That scale demonstrates repeat rider demand rather than experimental usage and strengthens confidence in commercial robotaxi deployment. The result supports the US robotaxi market by improving utilization visibility, validating app-based booking behavior, and giving vehicle, sensor, charging, maintenance, and remote-support suppliers a basis for capacity planning across expanding metropolitan service territories.
US Robotaxi Market Challenge
Fragmented Oversight Slows Geographic Scaling
Fragmented federal, state, and municipal requirements continue to slow geographic expansion, raise compliance costs, and complicate fleet standardization. The US robotaxi industry must navigate differing rules for testing, driverless deployment, passenger permits, insurance, curb access, data retention, and emergency response. Operators therefore face duplicated legal work and city-specific operating constraints before entering each service territory. These requirements extend launch schedules, constrain geographic scalability, and favor companies with substantial regulatory, safety-case, mapping, and local-government engagement capabilities.
NHTSA’s 2025 automated-vehicle framework retained crash oversight while amending reporting requirements and expanding exemption pathways for domestically produced automated vehicles. The framework improves direction, yet state and local authorization still determines where fare-charging services can operate. For the US robotaxi market, this layered structure increases validation expenditure, insurance complexity, and launch risk. Smaller operators may struggle to finance approval cycles, limiting competitive entry and delaying deployment beyond jurisdictions with established autonomous-vehicle rules and administrative capacity.
Unlock Market Intelligence
Explore the market potential with our data-driven report
US Robotaxi Market Trend
Purpose-Built Fleets Reshape Competitive Positioning
Purpose-built vehicles and vertically integrated fleet architectures are reshaping competitive positioning as operators move beyond retrofitted passenger cars. The US robotaxi industry is increasingly prioritizing bidirectional cabin layouts, redundant controls, electric propulsion, diagnostics, and software-defined maintenance. These configurations improve passenger-space utilization, simplify autonomous operation, and support fleet uptime. Integration with direct booking applications and established ride-hailing platforms also expands distribution, allowing autonomous fleet operators to combine proprietary technology with existing demand aggregation and payment infrastructure.
Zoox officially launched public autonomous rides around the Las Vegas Strip in September 2025 using a purpose-built robotaxi designed without driving controls. The deployment signals a shift from conventional vehicle conversion toward dedicated autonomous passenger platforms. Within the US robotaxi market, purpose-built designs can improve accessibility, cabin utilization, sensor placement, and lifecycle economics, while differentiating service experience. Suppliers supporting interiors, redundant systems, thermal management, charging, and fleet diagnostics gain stronger positions as deployment volumes increase.
US Robotaxi Market Opportunity
New Mobility Corridors Expand Addressable Demand
Underpenetrated airport, campus, suburban, and first-mile or last-mile routes create expansion space beyond urban cores. The US robotaxi industry can capture these corridors through scheduled service, hybrid ride-hailing networks, and autonomous shuttles designed around predictable demand. Platform partnerships reduce customer-acquisition friction, while city and airport agreements improve pickup access and planning. Suppliers offering fleet-as-a-service, charging, depot management, teleoperations support, accessible cabins, and localized maintenance can secure recurring demand as operators broaden service models and territories.
Lyft stated in July 2025 that its network served more than 44 million annual riders and autonomous HOLON shuttles were planned for a U.S. deployment in late 2026. The partnership model combines platform demand, vehicle integration, fleet ownership, and operating support. It expands the US robotaxi market by opening procurement channels with airports and cities, lowering complexity, and creating routes for purpose-built autonomous shuttles to complement on-demand services rather than relying solely on operator expansion.
Unlock Market Intelligence
Explore the market potential with our data-driven report
US Robotaxi Market Segmentation Analysis
By Application
- Passenger Transportation
- Goods Transportation
- Others
Passenger transportation holds 90% share because deployments concentrate on app-booked urban trips, airport connections, campus mobility, and short-distance point-to-point travel. Rider demand is easier to aggregate than goods movement, while passenger platforms already provide booking, payment, dispatch, and support infrastructure. Cars and purpose-built pods can therefore enter defined operating domains with clearer utilization patterns. This concentration strengthens the US robotaxi market by directing fleet investment toward accessible cabins, rider interfaces, pickup accuracy, and service availability.
Waymo’s safety-impact dashboard recorded 170.7 million rider-only miles through December 2025, demonstrating the depth of autonomous passenger service without a human driver. That mileage base supports procurement confidence in vehicles, perception systems, remote assistance, charging, and maintenance capacity designed for continuous passenger operations. It also improves validation across urban conditions, enabling operators to refine routing, pickup behavior, and incident response while building the reliability and trust required for higher ride volumes and broader metropolitan coverage.

By Service Type
- Ride-Hailing (On-Demand)
- Station-Based Shuttles
- Goods Delivery
- Others
Ride-Hailing (On-Demand) holds 85% share because autonomous fleets are commercialized through mobile applications that aggregate trip demand, process payments, optimize matching, and manage customer support. The model offers flexible routing and higher utilization than fixed-station services, while allowing operators to scale within geofenced service areas. Established platforms also reduce acquisition costs and accelerate rider access. These advantages reinforce the US robotaxi market by aligning autonomous fleet supply with real-time metropolitan demand and familiar booking behavior.
Uber and Waymo launched autonomous passenger rides in Atlanta in June 2025, allowing eligible users to be matched with a Waymo vehicle exclusively through the Uber application. The deployment demonstrates how ride-hailing integration converts existing platform demand into autonomous trips without requiring a separate customer channel. It strengthens service scalability, dispatch efficiency, payment integration, and fleet utilization while giving autonomous operators access to established mobility networks, operational support, and demand data needed for phased expansion.
List of Companies Covered in US Robotaxi Market
The companies listed below are highly influential in the US robotaxi market, with a significant market share and a strong impact on industry developments.
- Zoox Inc.
- AVRIDE Inc.
- Uber Technologies Inc.
- Waymo LLC (Waymo One)
- May Mobility Inc.
- Beep Inc.
- Tesla Inc. (Robotaxi)
- Perrone Robotics Inc.
- Lyft Inc.
- Via Transportation Inc.
Market News & Updates
- Waymo LLC (Waymo One), 2026:
Waymo opened its fully autonomous ride-hailing service to the first public riders in Miami. The initial operating area covers approximately 60 square miles, including Wynwood, Brickell, Coral Gables, and the Design District, with riders being added through a managed rollout. The launch expands fare-based robotaxi availability and adds another US metropolitan operating area for Waymo One.
- Zoox Inc., 2025:
Zoox opened a serial production facility in Hayward, California, dedicated to manufacturing its purpose-built robotaxi. The facility can assemble more than 10,000 vehicles annually and supports testing and fleet deployment from one operating site. The expansion strengthens US manufacturing capacity for autonomous passenger vehicles designed without conventional driving controls and supports future service-area growth.
Frequently Asked Questions
Related Report
- Market Segmentation
- Research Scope
- Research Methodology
- Definitions and Assumptions
- Executive Summary
- The US Robotaxi Market Policies, Regulations, and Standards
- The US Robotaxi Market Dynamics
- Growth Factors
- Challenges
- Trends
- Opportunities
- The US Robotaxi Market Statistics, 2022-2032F
- Market Size & Growth Outlook
- By Revenues in USD Million
- Market Segmentation & Growth Outlook
- By Level of Autonomy
- Level 4- Market Insights and Forecast 2022-2032, USD Million
- Level 5- Market Insights and Forecast 2022-2032, USD Million
- By Vehicle Type
- Cars- Market Insights and Forecast 2022-2032, USD Million
- Shuttles/Vans- Market Insights and Forecast 2022-2032, USD Million
- Purpose-Built Pods- Market Insights and Forecast 2022-2032, USD Million
- Others- Market Insights and Forecast 2022-2032, USD Million
- By Propulsion Type
- Electric Vehicles (BEV)- Market Insights and Forecast 2022-2032, USD Million
- Hybrid Electric Vehicles (HEV)- Market Insights and Forecast 2022-2032, USD Million
- Fuel Cell Vehicles (FCV)- Market Insights and Forecast 2022-2032, USD Million
- By Application
- Passenger Transportation- Market Insights and Forecast 2022-2032, USD Million
- Goods Transportation- Market Insights and Forecast 2022-2032, USD Million
- Others- Market Insights and Forecast 2022-2032, USD Million
- By Service Type
- Ride-Hailing (On-Demand)- Market Insights and Forecast 2022-2032, USD Million
- Station-Based Shuttles- Market Insights and Forecast 2022-2032, USD Million
- Goods Delivery- Market Insights and Forecast 2022-2032, USD Million
- Others- Market Insights and Forecast 2022-2032, USD Million
- By Component Type
- LiDAR- Market Insights and Forecast 2022-2032, USD Million
- Radar (mmWave)- Market Insights and Forecast 2022-2032, USD Million
- Camera- Market Insights and Forecast 2022-2032, USD Million
- Ultrasonic Sensors- Market Insights and Forecast 2022-2032, USD Million
- Sensor Fusion Systems- Market Insights and Forecast 2022-2032, USD Million
- Others- Market Insights and Forecast 2022-2032, USD Million
- By Region
- West- Market Insights and Forecast 2022-2032, USD Million
- Midwest- Market Insights and Forecast 2022-2032, USD Million
- South- Market Insights and Forecast 2022-2032, USD Million
- North- Market Insights and Forecast 2022-2032, USD Million
- Northeast- Market Insights and Forecast 2022-2032, USD Million
- By Competitors
- Competition Characteristics
- Market Share & Analysis
- By Level of Autonomy
- Market Size & Growth Outlook
- The US Ride-Hailing (On-Demand) Market Statistics, 2022-2032
- Market Size & Growth Outlook
- By Revenues in USD Million
- Market Segmentation & Growth Outlook
- By Vehicle Type- Market Insights and Forecast 2022-2032, USD Million
- By Propulsion Type- Market Insights and Forecast 2022-2032, USD Million
- By Application- Market Insights and Forecast 2022-2032, USD Million
- By Service Type- Market Insights and Forecast 2022-2032, USD Million
- By Component Type- Market Insights and Forecast 2022-2032, USD Million
- By Region- Market Insights and Forecast 2022-2032, USD Million
- Market Size & Growth Outlook
- The US Station-Based Shuttles Market Statistics, 2022-2032
- Market Size & Growth Outlook
- By Revenues in USD Million
- Market Segmentation & Growth Outlook
- By Vehicle Type- Market Insights and Forecast 2022-2032, USD Million
- By Propulsion Type- Market Insights and Forecast 2022-2032, USD Million
- By Application- Market Insights and Forecast 2022-2032, USD Million
- By Service Type- Market Insights and Forecast 2022-2032, USD Million
- By Component Type- Market Insights and Forecast 2022-2032, USD Million
- By Region- Market Insights and Forecast 2022-2032, USD Million
- Market Size & Growth Outlook
- The US Goods Delivery Market Statistics, 2022-2032
- Market Size & Growth Outlook
- By Revenues in USD Million
- Market Segmentation & Growth Outlook
- By Vehicle Type- Market Insights and Forecast 2022-2032, USD Million
- By Propulsion Type- Market Insights and Forecast 2022-2032, USD Million
- By Application- Market Insights and Forecast 2022-2032, USD Million
- By Service Type- Market Insights and Forecast 2022-2032, USD Million
- By Component Type- Market Insights and Forecast 2022-2032, USD Million
- By Region- Market Insights and Forecast 2022-2032, USD Million
- Market Size & Growth Outlook
- Competitive Outlook
- Company Profiles
- Waymo LLC (Waymo One)
- Business Description
- Product Portfolio
- Collaborations & Alliances
- Recent Developments
- Financial Details
- Others
- May Mobility Inc.
- Business Description
- Product Portfolio
- Collaborations & Alliances
- Recent Developments
- Financial Details
- Others
- Beep Inc.
- Business Description
- Product Portfolio
- Collaborations & Alliances
- Recent Developments
- Financial Details
- Others
- Tesla Inc. (Robotaxi)
- Business Description
- Product Portfolio
- Collaborations & Alliances
- Recent Developments
- Financial Details
- Others
- Perrone Robotics Inc.
- Business Description
- Product Portfolio
- Collaborations & Alliances
- Recent Developments
- Financial Details
- Others
- Zoox Inc.
- Business Description
- Product Portfolio
- Collaborations & Alliances
- Recent Developments
- Financial Details
- Others
- AVRIDE Inc.
- Business Description
- Product Portfolio
- Collaborations & Alliances
- Recent Developments
- Financial Details
- Others
- Uber Technologies Inc.
- Business Description
- Product Portfolio
- Collaborations & Alliances
- Recent Developments
- Financial Details
- Others
- Lyft Inc.
- Business Description
- Product Portfolio
- Collaborations & Alliances
- Recent Developments
- Financial Details
- Others
- Via Transportation Inc.
- Business Description
- Product Portfolio
- Collaborations & Alliances
- Recent Developments
- Financial Details
- Others
- Waymo LLC (Waymo One)
- Company Profiles
- Disclaimer
| Segment | Sub-Segment |
|---|---|
| By Level of Autonomy |
|
| By Vehicle Type |
|
| By Propulsion Type |
|
| By Application |
|
| By Service Type |
|
| By Component Type |
|
| By Region |
|
Research Methodology
This study followed a structured approach comprising four key phases to assess the size and scope of the electro-oxidation market. The process began with thorough secondary research to collect data on the target market, related markets, and broader industry context. These findings, along with preliminary assumptions and estimates, were then validated through extensive primary research involving industry experts from across the value chain. To calculate the overall market size, both top-down and bottom-up methodologies were employed. Finally, market segmentation and data triangulation techniques were applied to refine and validate segment-level estimations.
Secondary Research
The secondary research phase involved gathering data from a wide range of credible and published sources. This step helped in identifying industry trends, defining market segmentation, and understanding the market landscape and value chain.
Sources consulted during this phase included:
- Company annual reports, investor presentations, and press releases
- Industry white papers and certified publications
- Trade directories and market-recognized databases
- Articles from authoritative authors and reputable journals
- Gold and silver standard websites
Secondary research was critical in mapping out the industry's value chain and monetary flow, identifying key market segments, understanding regional variations, and tracking significant industry developments.
Other key sources:
- Financial disclosures
- Industry associations and trade bodies
- News outlets and business magazines
- Academic journals and research studies
- Paid industry databases
Primary Research
To validate secondary data and gain deeper market insights, primary research was conducted with key stakeholders across both the supply and demand sides of the market.
On the demand side, participants included decision-makers and influencers from end-user industries—such as CIOs, CTOs, and CSOs—who provided first-hand perspectives on market needs, product usage, and future expectations.
On the supply side, interviews were conducted with manufacturers, industry associations, and institutional participants to gather insights into current offerings, product pipelines, and market challenges.
Primary interviews provided critical inputs such as:
- Market size and revenue data
- Product and service breakdowns
- Market forecasts
- Regional and application-specific trends
Stakeholders consulted included:
- Leading OEM and solution providers
- Channel and distribution partners
- End users across various applications
- Independent consultants and industry specialists
Market Size Estimation and Data Triangulation
- Identifying Key Market Participants (Secondary Research)
- Goal: To identify the major players or companies in the target market. This typically involves using publicly available data sources such as industry reports, market research publications, and financial statements of companies.
- Tools: Reports from firms like Gartner, Forrester, Euromonitor, Statista, IBISWorld, and others. Public financial statements, news articles, and press releases from top market players.
- Extracting Earnings of Key Market Participants
- Goal: To estimate the earnings generated from the product or service being analyzed. This step helps in understanding the revenue potential of each market player in a specific geography.
- Methods: Earnings data can be gathered from:
- Publicly available financial reports (for listed companies).
- Interviews and primary data sources from professionals, such as Directors, VPs, SVPs, etc. This is especially useful for understanding more nuanced, internal data that isn't publicly disclosed.
- Annual reports and investor presentations of key players.
- Data Collation and Development of a Relevant Data Model
- Goal: To collate inputs from both primary and secondary sources into a structured, data-driven model for market estimation. This model will incorporate key market KPIs and any independent variables relevant to the market.
- Key KPIs: These could include:
- Market size, growth rate, and demand drivers.
- Industry-specific metrics like market share, average revenue per customer (ARPC), or average deal size.
- External variables, such as economic growth rates, inflation rates, or commodity prices, that could affect the market.
- Data Modeling: Based on this data, the market forecasts are developed for the next 5 years. A combination of trend analysis, scenario modeling, and statistical regression might be used to generate projections.
- Scenario Analysis
- Goal: To test different assumptions and validate how sensitive the market is to changes in key variables (e.g., market demand, regulatory changes, technological disruptions).
- Types of Scenarios:
- Base Case: Based on current assumptions and historical data.
- Best-Case Scenario: Assuming favorable market conditions, regulatory environments, and technological advancements.
- Worst-Case Scenario: Accounting for adverse factors, such as economic downturns, stricter regulations, or unexpected disruptions.


