North America Robotaxi Market Report: Trends, Growth and Forecast (2026-2032)
By Level of Autonomy (Level 4, Level 5), By Vehicle Type (Cars, Shuttles/Vans, Purpose-Built Pods, Others), By Propulsion Type (Electric Vehicles (BEV), Hybrid Electric Vehicles (HEV), Fuel Cell Vehicles (FCV)), By Application (Passenger Transportation, Goods Transportation, Others), By Service Type (Ride-Hailing (On-Demand), Station-Based Shuttles, Goods Delivery, Others), By Component Type (LiDAR, Radar (mmWave), Camera, Ultrasonic Sensors, Sensor Fusion Systems, Others), By Country (The US, Canada, Mexico) ... Read more
|
Major Players
|
North America Robotaxi Market Statistics and Insights, 2026
- Market Size Statistics
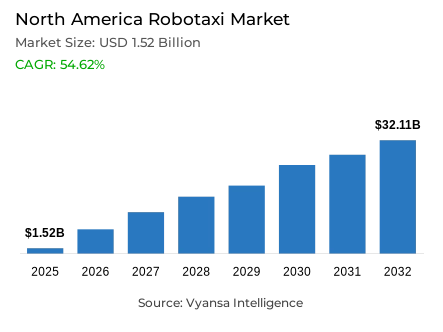
- Robotaxi market size in North America was valued at USD 1.52 billion in 2025 and is estimated at USD 1.69 billion in 2026.
- The market size is expected to grow to USD 32.11 billion by 2032.
- Market to register a CAGR of around 54.62% during 2026-32.
- Application Shares
- Passenger transportation grabbed market share of 85%.
- Competition
- Robotaxi in North America is currently being catered to by more than 10 companies.
- Top 5 companies acquired around 80% of the market share in 2026.
- Zoox Inc., Lyft Inc., AVRIDE Inc., Waymo LLC, Uber Technologies Inc. etc., are few of the top companies.
- Service Type
- Ride-Hailing (On-Demand) grabbed 80% of the market.
- Country
- The US leads with a 93% share of the North America market.
North America Robotaxi Market Outlook
Robotaxi services combine app-based passenger transportation, Level 4 autonomous vehicles, fleet management, remote assistance, mapping, charging, and depot infrastructure. The North America robotaxi market is valued at USD 1.52 billion in 2025 and USD 1.69 billion in 2026, with a projected value of USD 32.11 billion by 2032 at a CAGR of 54.62% during 2026-2032. Demand comes from mobility platforms, vehicle developers, transit agencies, airports, municipalities, property operators, and communities seeking scalable transportation regionally.
Commercialization is supported by broader service territories, improved AI-based driving software, stronger sensor fusion, and fleet support. These capabilities reduce intervention requirements while improving trip completion, dispatch reliability, and vehicle utilization. The North America robotaxi market also benefits from electric robotaxi fleet expansion, autonomous fleet charging, cloud-connected operations, and predictive maintenance. Although policy development remains uneven, evolving permitting and safety-reporting frameworks are improving deployment visibility for operators, investors, and infrastructure partners across major urban corridors.
Economic impact extends beyond fares because deployment requires vehicles, sensors, computing, mapping, insurance, depots, charging, cleaning, maintenance, and remote operations centers. The North America robotaxi industry creates procurement opportunities across the autonomous mobility supply chain while encouraging rideshare platforms to integrate autonomous vehicles into mixed fleets. Partnerships among developers, fleet owners, manufacturers, and mobility marketplaces improve specialization, cost absorption, asset utilization, and service availability, strengthening competitive positioning as commercial volumes rise across North American cities.
Expansion during 2026 is moving from pilots toward multi-city robotaxi expansion and standardized models. The North America robotaxi market rewards fleet uptime and regulatory readiness. The North America robotaxi industry is consolidating more rapidly.

North America Robotaxi Market Growth Driver
Commercial Ride Density Strengthens Fleet Economics
Rising demand for on-demand autonomous mobility is improving the utilization case for fleets. Dense urban trip volumes allow operators to spread vehicle, mapping, charging, maintenance, and remote-support costs across more rides, while app-based booking lowers customer-acquisition friction. The North America robotaxi market gains momentum as service reliability improves and operating hours expand. For mobility platforms, higher robotaxi fleet utilization supports faster asset payback, broader service coverage, and stronger integration between autonomous vehicles and ride-hailing networks.
Waymo reported more than 14 million fully autonomous trips during 2025, over three times its public ride volume in 2024, demonstrating that repeated rider usage can move beyond pilot-scale demand. Waymo’s 2025 operational update indicates that commercial ride density is becoming measurable across multiple metropolitan areas. This demand signal strengthens the North America robotaxi industry by supporting fleet procurement, depot investment, software scaling, and supplier commitments tied to fare-charging driverless rides and expanding service territories.
North America Robotaxi Market Challenge
Fragmented Rules Slow Cross-Border Scaling
Fragmented regulation remains the principal barrier to scalable deployment because operators must satisfy different testing, passenger-service, reporting, insurance, accessibility, and local operating requirements across jurisdictions. These variations lengthen approval cycles, complicate fleet transfers between cities, and raise legal and compliance costs. The North America robotaxi market therefore faces slower geographic replication than software-led mobility models. Uncertainty around liability, remote assistance, minimum-risk behavior, cybersecurity, and vehicles without conventional controls also increases procurement caution among fleet owners and public agencies.
NHTSA’s 2025 automated vehicle framework revised crash-reporting requirements and expanded the Automated Vehicle Exemption Program for domestically produced vehicles, while continuing federal oversight of automated driving systems. NHTSA’s automated vehicle safety framework shows that national rules are still evolving alongside state-level permissions. This regulatory transition constrains the North America robotaxi industry by requiring continuous compliance investment, market-specific operating design, and extensive documentation before commercial deployment can expand across state and national borders.
Unlock Market Intelligence
Explore the market potential with our data-driven report
North America Robotaxi Market Trend
Purpose-Built Platforms Redefine Autonomous Fleets
Purpose-built vehicles are shifting robotaxi design away from retrofitted passenger cars toward cabins, controls, redundancy, and maintenance systems engineered specifically for autonomous service. Bidirectional layouts, no-manual-controls architectures, centralized sensing, and software-defined interiors can improve passenger capacity, cleaning workflows, accessibility planning, and fleet uptime. The North America robotaxi market is consequently moving toward differentiated vehicle platforms that support autonomous fleet orchestration rather than merely adding self-driving capability to conventional models used in mixed human-operated fleets commercially.
Zoox launched its public autonomous ride-hailing service in Las Vegas on September 10, 2025, using a purpose-built robotaxi and app-based booking around selected Strip destinations. Zoox’s official Las Vegas launch update confirms the transition from testing to public service deployment. This development strengthens the North America robotaxi industry by validating purpose-built vehicle commercialization, expanding passenger exposure to no-manual-controls designs, and raising competitive pressure on operators relying solely on converted production vehicles for future multi-city scaling.
North America Robotaxi Market Opportunity
Partnership-Led Models Expand Commercial Access
Platform-led fleet partnerships create the largest underpenetrated opportunity by separating vehicle ownership, autonomous-driving software, fleet operations, and customer acquisition into commercial roles. This structure allows manufacturers, technology providers, financiers, charging operators, insurers, and mobility platforms to enter without controlling the entire value chain. The North America robotaxi market can therefore expand faster when standardized interfaces, depot services, maintenance networks, and marketplace integration reduce execution burdens for new fleets and improve access to established ride demand.
Nuro, Lucid, and Uber announced a program to build and deploy at least 20,000 robotaxis across US and international markets, combining Lucid vehicles, the Nuro Driver, and Uber’s platform and fleet network. The official program overview demonstrates how shared investment can accelerate production validation and commercial rollout. This model strengthens the North America robotaxi industry by widening supplier participation, improving demand capture, and creating deployment channels for vehicles, software, charging, maintenance, and fleet services.
North America Robotaxi Market Country Analysis
By Country
- The US
- Canada
- Mexico
The US holds a 93% share, supported by the deepest concentration of commercial deployments, autonomous-driving developers, rideshare platforms, testing infrastructure, and city-level operating permissions. California, Arizona, Texas, Nevada, Georgia, and Florida provide operating environments that accelerate validation across dense urban, suburban, and mixed-traffic conditions. The North America robotaxi market remains US-led because operators can combine large ride-hailing demand pools with established venture ecosystems, vehicle supply, mapping capability, and public-sector experimentation across metropolitan areas.
Waymo opened fully autonomous public ride-hailing in Dallas, Houston, San Antonio, and Orlando in February 2026, bringing its commercial footprint to ten metropolitan areas. Waymo’s official multi-city launch update demonstrates how US operators are advancing simultaneous market entry rather than isolated pilots. This deployment density strengthens the North America robotaxi industry by concentrating regulatory learning, fleet infrastructure, rider familiarity, supplier demand, and operational data within a commercially active national ecosystem capable of supporting faster subsequent expansion regionally.
Unlock Market Intelligence
Explore the market potential with our data-driven report
North America Robotaxi Market Segmentation Analysis
By Application
- Passenger Transportation
- Goods Transportation
- Others
Passenger Transportation holds an 85% share under the application category because commercial robotaxi demand is currently concentrated in urban and suburban passenger movement rather than goods carriage. Ride frequency, recurring commuter needs, airport access, first-mile and last-mile connectivity, and app-based dispatch create stronger monetization pathways for autonomous fleets. The North America robotaxi market therefore prioritizes vehicles, cabin systems, safety protocols, and routing software designed around passenger comfort, trip reliability, accessibility, and efficient pickup and drop-off operations.
May Mobility launched its first commercial driver-out transportation service in Peachtree Corners, Georgia, in February 2025, offering public autonomous rides across eight predetermined stops with vehicles accommodating up to five passengers. May Mobility’s official deployment announcement shows how localized passenger services can transition from supervised pilots to driverless operations. Such deployments strengthen passenger-led demand by validating booking workflows, municipal coordination, connected infrastructure, and service reliability in defined operating areas before wider commercial geographic expansion.

By Service Type
- Ride-Hailing (On-Demand)
- Station-Based Shuttles
- Goods Delivery
- Others
Ride-Hailing (On-Demand) holds an 80% share under the service type category because flexible booking aligns robotaxi capacity with real-time passenger demand. Dynamic dispatch, app-based payments, route optimization, and automated vehicle matching support higher utilization than fixed-route models, particularly across dense metropolitan service zones. The North America robotaxi market benefits from established rideshare interfaces that reduce adoption friction, provide immediate demand aggregation, and allow autonomous vehicles to operate alongside human-driven fleets during staged commercial expansion regionally.
Uber and Avride launched robotaxi rides in Dallas in December 2025 across a nine-square-mile operating area covering Downtown, Uptown, Turtle Creek, and Deep Ellum. Uber’s official Dallas launch announcement states that eligible UberX, Comfort, and Comfort Electric requests can be matched with an all-electric Avride vehicle. This integration strengthens on-demand service leadership by combining familiar booking workflows, existing customer access, fleet dispatch, and gradual territory expansion without requiring a separate mobility platform at commercial scale.
Various Market Players in North America Robotaxi Market
The companies mentioned below are highly active in the North America robotaxi market, occupying a considerable portion of the market and shaping industry progress.
- Zoox Inc.
- Lyft Inc.
- AVRIDE Inc.
- Waymo LLC
- Uber Technologies Inc.
- May Mobility Inc.
- Beep Inc.
- Tesla Inc.
- Oxa Autonomy Ltd
- Nuro Inc.
- Lucid Group Inc.
- Motional AD Inc.
Market News & Updates
- May Mobility Inc., 2025:
May Mobility and Lyft launched their first shared autonomous vehicle deployment in Midtown Atlanta. Lyft riders can be matched with May Mobility’s hybrid-electric Toyota Sienna autonomous vehicles through the existing Lyft application. The service adds a platform-integrated robotaxi fleet in a major North American city and provides a pathway to expand operating hours, vehicle availability, and geographic coverage.
- Beep Inc., 2025:
Beep began operating NAVI, a fully autonomous public transportation service in Jacksonville, Florida. The service uses 14 electric Ford E-Transit vehicles equipped with Oxa automated-driving technology and is supported by a five-year operations and maintenance contract. The launch adds a long-term autonomous fleet model covering vehicle deployment, command-center operations, maintenance, and passenger transport.
Frequently Asked Questions
Related Report
- Market Segmentation
- Research Scope
- Research Methodology
- Definitions and Assumptions
- Executive Summary
- North America Robotaxi Market Policies, Regulations, and Standards
- North America Robotaxi Market Dynamics
- Growth Factors
- Challenges
- Trends
- Opportunities
- North America Robotaxi Market Statistics, 2022-2032F
- Market Size & Growth Outlook
- By Revenues in USD Million
- Market Segmentation & Growth Outlook
- By Level of Autonomy
- Level 4- Market Insights and Forecast 2022-2032, USD Million
- Level 5- Market Insights and Forecast 2022-2032, USD Million
- By Vehicle Type
- Cars- Market Insights and Forecast 2022-2032, USD Million
- Shuttles/Vans- Market Insights and Forecast 2022-2032, USD Million
- Purpose-Built Pods- Market Insights and Forecast 2022-2032, USD Million
- Others- Market Insights and Forecast 2022-2032, USD Million
- By Propulsion Type
- Electric Vehicles (BEV)- Market Insights and Forecast 2022-2032, USD Million
- Hybrid Electric Vehicles (HEV)- Market Insights and Forecast 2022-2032, USD Million
- Fuel Cell Vehicles (FCV)- Market Insights and Forecast 2022-2032, USD Million
- By Application
- Passenger Transportation- Market Insights and Forecast 2022-2032, USD Million
- Goods Transportation- Market Insights and Forecast 2022-2032, USD Million
- Others- Market Insights and Forecast 2022-2032, USD Million
- By Service Type
- Ride-Hailing (On-Demand)- Market Insights and Forecast 2022-2032, USD Million
- Station-Based Shuttles- Market Insights and Forecast 2022-2032, USD Million
- Goods Delivery- Market Insights and Forecast 2022-2032, USD Million
- Others- Market Insights and Forecast 2022-2032, USD Million
- By Component Type
- LiDAR- Market Insights and Forecast 2022-2032, USD Million
- Radar (mmWave)- Market Insights and Forecast 2022-2032, USD Million
- Camera- Market Insights and Forecast 2022-2032, USD Million
- Ultrasonic Sensors- Market Insights and Forecast 2022-2032, USD Million
- Sensor Fusion Systems- Market Insights and Forecast 2022-2032, USD Million
- Others- Market Insights and Forecast 2022-2032, USD Million
- By Country
- The US
- Canada
- Mexico
- By Competitors
- Competition Characteristics
- Market Share & Analysis
- By Level of Autonomy
- Market Size & Growth Outlook
- The US Robotaxi Market Statistics, 2022-2032F
- Market Size & Growth Outlook
- By Revenues in USD Million
- Market Segmentation & Growth Outlook
- By Level of Autonomy- Market Insights and Forecast 2022-2032, USD Million
- By Vehicle Type- Market Insights and Forecast 2022-2032, USD Million
- By Propulsion Type- Market Insights and Forecast 2022-2032, USD Million
- By Application- Market Insights and Forecast 2022-2032, USD Million
- By Service Type- Market Insights and Forecast 2022-2032, USD Million
- By Component Type- Market Insights and Forecast 2022-2032, USD Million
- Market Size & Growth Outlook
- Canada Robotaxi Market Statistics, 2022-2032F
- Market Size & Growth Outlook
- By Revenues in USD Million
- Market Segmentation & Growth Outlook
- By Level of Autonomy- Market Insights and Forecast 2022-2032, USD Million
- By Vehicle Type- Market Insights and Forecast 2022-2032, USD Million
- By Propulsion Type- Market Insights and Forecast 2022-2032, USD Million
- By Application- Market Insights and Forecast 2022-2032, USD Million
- By Service Type- Market Insights and Forecast 2022-2032, USD Million
- By Component Type- Market Insights and Forecast 2022-2032, USD Million
- Market Size & Growth Outlook
- Mexico Robotaxi Market Statistics, 2022-2032F
- Market Size & Growth Outlook
- By Revenues in USD Million
- Market Segmentation & Growth Outlook
- By Level of Autonomy- Market Insights and Forecast 2022-2032, USD Million
- By Vehicle Type- Market Insights and Forecast 2022-2032, USD Million
- By Propulsion Type- Market Insights and Forecast 2022-2032, USD Million
- By Application- Market Insights and Forecast 2022-2032, USD Million
- By Service Type- Market Insights and Forecast 2022-2032, USD Million
- By Component Type- Market Insights and Forecast 2022-2032, USD Million
- Market Size & Growth Outlook
- Competitive Outlook
- Company Profiles
- Waymo LLC
- Business Description
- Product Portfolio
- Collaborations & Alliances
- Recent Developments
- Financial Details
- Others
- Uber Technologies Inc.
- Business Description
- Product Portfolio
- Collaborations & Alliances
- Recent Developments
- Financial Details
- Others
- May Mobility Inc.
- Business Description
- Product Portfolio
- Collaborations & Alliances
- Recent Developments
- Financial Details
- Others
- Beep Inc.
- Business Description
- Product Portfolio
- Collaborations & Alliances
- Recent Developments
- Financial Details
- Others
- Tesla Inc.
- Business Description
- Product Portfolio
- Collaborations & Alliances
- Recent Developments
- Financial Details
- Others
- Zoox Inc.
- Business Description
- Product Portfolio
- Collaborations & Alliances
- Recent Developments
- Financial Details
- Others
- Lyft Inc.
- Business Description
- Product Portfolio
- Collaborations & Alliances
- Recent Developments
- Financial Details
- Others
- AVRIDE Inc.
- Business Description
- Product Portfolio
- Collaborations & Alliances
- Recent Developments
- Financial Details
- Others
- Oxa Autonomy Ltd
- Business Description
- Product Portfolio
- Collaborations & Alliances
- Recent Developments
- Financial Details
- Others
- Nuro Inc.
- Business Description
- Product Portfolio
- Collaborations & Alliances
- Recent Developments
- Financial Details
- Others
- Lucid Group Inc.
- Business Description
- Product Portfolio
- Collaborations & Alliances
- Recent Developments
- Financial Details
- Others
- Motional AD Inc.
- Business Description
- Product Portfolio
- Collaborations & Alliances
- Recent Developments
- Financial Details
- Others
- Waymo LLC
- Company Profiles
- Disclaimer
| Segment | Sub-Segment |
|---|---|
| By Level of Autonomy |
|
| By Vehicle Type |
|
| By Propulsion Type |
|
| By Application |
|
| By Service Type |
|
| By Component Type |
|
| By Country |
|
Research Methodology
This study followed a structured approach comprising four key phases to assess the size and scope of the electro-oxidation market. The process began with thorough secondary research to collect data on the target market, related markets, and broader industry context. These findings, along with preliminary assumptions and estimates, were then validated through extensive primary research involving industry experts from across the value chain. To calculate the overall market size, both top-down and bottom-up methodologies were employed. Finally, market segmentation and data triangulation techniques were applied to refine and validate segment-level estimations.
Secondary Research
The secondary research phase involved gathering data from a wide range of credible and published sources. This step helped in identifying industry trends, defining market segmentation, and understanding the market landscape and value chain.
Sources consulted during this phase included:
- Company annual reports, investor presentations, and press releases
- Industry white papers and certified publications
- Trade directories and market-recognized databases
- Articles from authoritative authors and reputable journals
- Gold and silver standard websites
Secondary research was critical in mapping out the industry's value chain and monetary flow, identifying key market segments, understanding regional variations, and tracking significant industry developments.
Other key sources:
- Financial disclosures
- Industry associations and trade bodies
- News outlets and business magazines
- Academic journals and research studies
- Paid industry databases
Primary Research
To validate secondary data and gain deeper market insights, primary research was conducted with key stakeholders across both the supply and demand sides of the market.
On the demand side, participants included decision-makers and influencers from end-user industries—such as CIOs, CTOs, and CSOs—who provided first-hand perspectives on market needs, product usage, and future expectations.
On the supply side, interviews were conducted with manufacturers, industry associations, and institutional participants to gather insights into current offerings, product pipelines, and market challenges.
Primary interviews provided critical inputs such as:
- Market size and revenue data
- Product and service breakdowns
- Market forecasts
- Regional and application-specific trends
Stakeholders consulted included:
- Leading OEM and solution providers
- Channel and distribution partners
- End users across various applications
- Independent consultants and industry specialists
Market Size Estimation and Data Triangulation
- Identifying Key Market Participants (Secondary Research)
- Goal: To identify the major players or companies in the target market. This typically involves using publicly available data sources such as industry reports, market research publications, and financial statements of companies.
- Tools: Reports from firms like Gartner, Forrester, Euromonitor, Statista, IBISWorld, and others. Public financial statements, news articles, and press releases from top market players.
- Extracting Earnings of Key Market Participants
- Goal: To estimate the earnings generated from the product or service being analyzed. This step helps in understanding the revenue potential of each market player in a specific geography.
- Methods: Earnings data can be gathered from:
- Publicly available financial reports (for listed companies).
- Interviews and primary data sources from professionals, such as Directors, VPs, SVPs, etc. This is especially useful for understanding more nuanced, internal data that isn't publicly disclosed.
- Annual reports and investor presentations of key players.
- Data Collation and Development of a Relevant Data Model
- Goal: To collate inputs from both primary and secondary sources into a structured, data-driven model for market estimation. This model will incorporate key market KPIs and any independent variables relevant to the market.
- Key KPIs: These could include:
- Market size, growth rate, and demand drivers.
- Industry-specific metrics like market share, average revenue per customer (ARPC), or average deal size.
- External variables, such as economic growth rates, inflation rates, or commodity prices, that could affect the market.
- Data Modeling: Based on this data, the market forecasts are developed for the next 5 years. A combination of trend analysis, scenario modeling, and statistical regression might be used to generate projections.
- Scenario Analysis
- Goal: To test different assumptions and validate how sensitive the market is to changes in key variables (e.g., market demand, regulatory changes, technological disruptions).
- Types of Scenarios:
- Base Case: Based on current assumptions and historical data.
- Best-Case Scenario: Assuming favorable market conditions, regulatory environments, and technological advancements.
- Worst-Case Scenario: Accounting for adverse factors, such as economic downturns, stricter regulations, or unexpected disruptions.


