Japan Cards and Payments Market Report: Trends, Growth and Forecast (2026-2032)
By Instrument Type (Cards (Debit Card, Charge Card, ATM Card, Pre-Paid Card, Credit Card, Store Card), Mobile Wallets, Cheques, Others), By Card Type (Contact Smart Card, Contactless Smart Card, Non-Smart Card), By Type of Payments (B2B, B2C, C2C, C2B (E-commerce Shopping, Payment at POS Terminals)), By Transaction Type (Domestic, Foreign), By Application (Food & Groceries, Health & Pharmacies, Travel & Tourism, Hospitality, Others (Media & Entertainment)) ... Read more
|
Major Players
|
Japan Cards and Payments Market Statistics and Insights, 2026
- Market Size Statistics
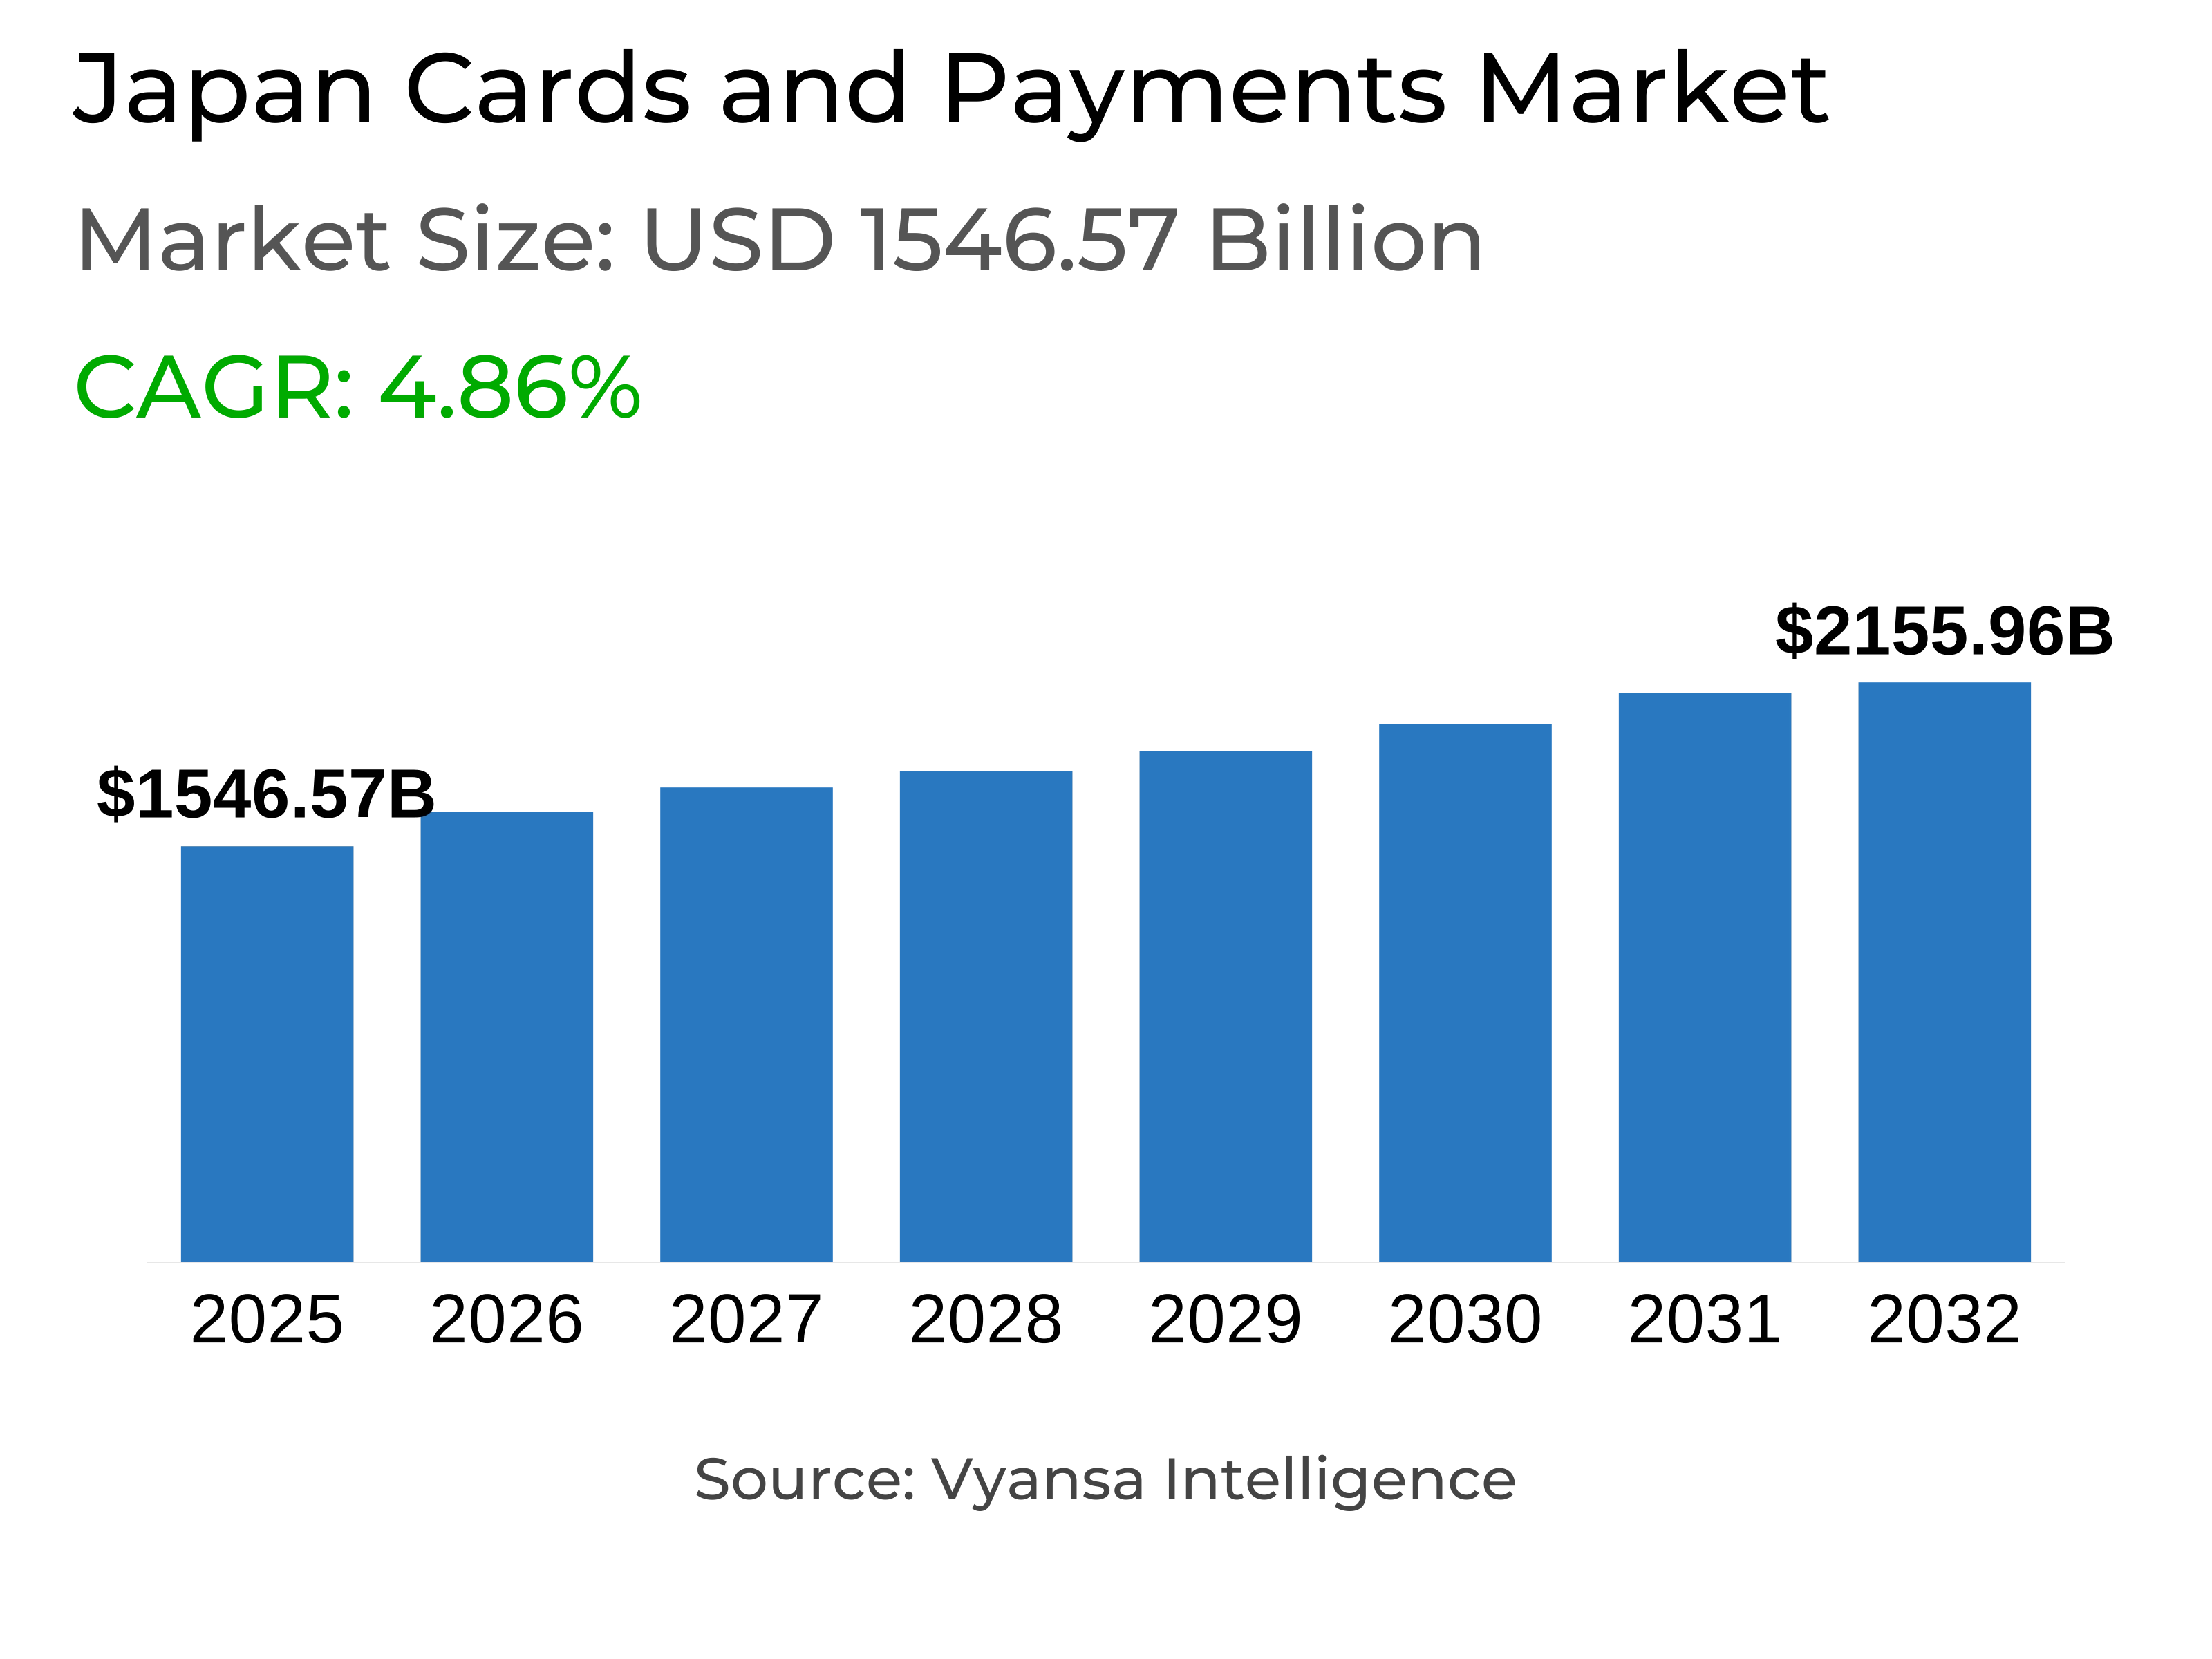
- Cards and Payments in Japan is estimated at $ 1546.57 Billion.
- The market size is expected to grow to $ 2155.96 Billion by 2032.
- Market to register a CAGR of around 4.86% during 2026-32.
- Instrument Type Shares
- Cards grabbed market share of 90%.
- Cards to witness a volume CAGR of around 1.44%.
- Competition
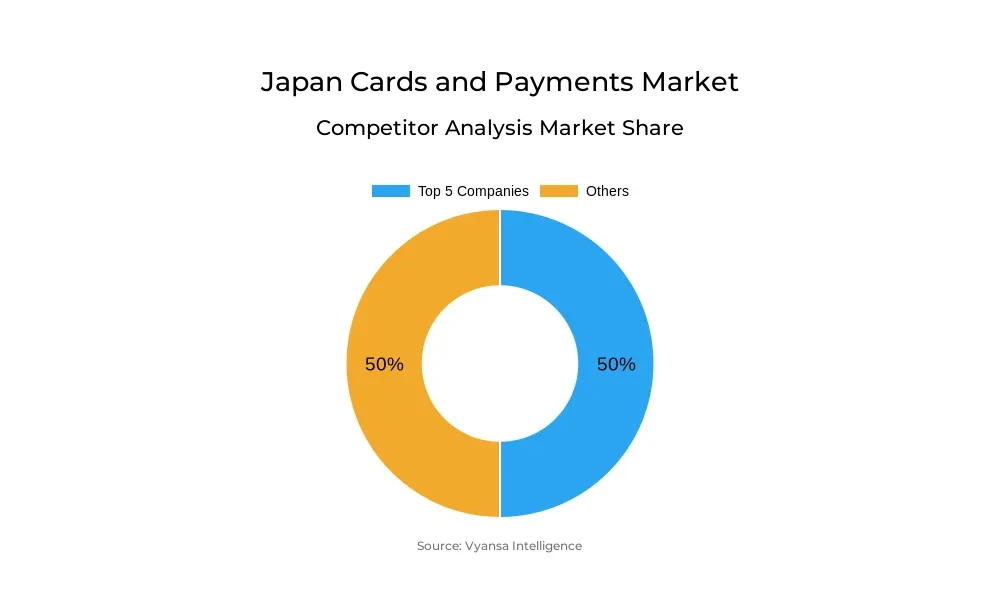
- More than 20 companies are actively engaged in producing Cards and Payments in Japan.
- Top 5 companies acquired 50% of the market share.
- Credit Saison Co Ltd, Epos Card Co Ltd, Orient Corp, Rakuten Card Co Ltd, Sumitomo Mitsui Card Co Ltd etc., are few of the top companies.
- Card Type
- Contact Smart Card grabbed 54% of the market.
Japan Cards and Payments Market Outlook
The Japan cards and payments market is expected to rise from USD 1546.57 billion to USD 2155.96 billion by 2032, indicating a gradual and consistent trend towards digital and card-based payments from cash. While debit cards are appreciated for their ability to limit overspending, credit cards are becoming increasingly popular with the proliferation of contactless payment methods, and QR code payments are decreasing the role for cash in smaller stores and food stalls. These changes reflect Japan's further drift toward a cashless society.
Contactless adoption is also fueled by the rollout of terminals supporting the international "ripple mark," primarily in public transport and retail. Railways, long dependent on prepaid IC cards, are starting to add Visa and other contactless options to enhance convenience, especially for foreign visitors. This is assisting contactless smart cards to reinforce their market leadership, already controlling about 54% of the market.
Premium and specialised cards also remain important, with the traditional “Gaisho” culture sustaining department store cards for wealthy End users. At the same time, modernisation is reshaping this segment, as issuers enhance digital services and promote premium benefits to appeal to younger affluent users. Innovative services such as Sumitomo Mitsui’s Olive card, which combines multiple payment functions into one, also highlight the growing importance of integrated and flexible payment options for younger demographics.
In the future, the release of new banknotes in 2024, which needs vending machine, ATM, and ticketing system updates, will be a big driver for cashless growth. For most businesses, it is expensive to keep cash infrastructure in place, so they will switch towards digital alternatives. With cards expected to have a volume CAGR of 1.44%, coupled with QR code payment growth and operator efforts, Japan payments market will continue to modernise and grow steadily up to 2032.
Japan Cards and Payments Market Growth Driver
Increase Move Towards Cashless Transactions
Japan is seeing a gradual fall in cash use, with increasing End users opting for financial cards in regular transactions. Debit cards, useful for spending control, and credit cards, facilitated by contactless payments, are gaining traction. Concurrently, QR code transactions are widely expanding, and cashless payments have become simpler even at small stores, street stalls, and on-the-move sellers who only used to accept cash.
This increasing trend for cashless payments is changing the way Japanese End users transact. With historical constraints, including payment device installation costs, being removed progressively through QR code and contactless alternatives, End users and businesses alike are embracing the ease of digital payments. This phenomenon is one of the major drivers of growth and development of the cards and payments market in Japan.
Japan Cards and Payments Market Trend
Rise of Contactless and Multi-Functional Cards
In Japan, contactless payments are spreading continuously. More and more stores are setting up devices with Visa's ripple mark compatibility, and usage of cards with ripple mark technology is on the rise continuously. Major cities such as Osaka are witnessing concentrated projects, particularly in coordination with events like Expo 2025, and the railway business is also embracing contactless payments. These advancements bring greater convenience for domestic users and overseas tourists alike, and cashless payment becomes a normal part of life.
Concurrently, multi-functional cards are in vogue. Such services as Sumitomo Mitsui Financial Group's Olive card converge cash, credit, debit, and pre-paid functionalities into one card. Such characteristics as payment switching through a mobile app, loyalty point collection without a hitch, and mobile-first design attract younger End users. Such a trend is an expression of the shift to seamless, flexible, and technology-oriented payments in Japan, which changes the way End users hold and use their cards.
Unlock Market Intelligence
Explore the market potential with our data-driven report
Japan Cards and Payments Market Opportunity
Cash Infrastructure Upgrades to Support Cashless Payments
The market will gain from cash-handling infrastructure being updated because new banknotes necessitate ATMs, vending machines, and ticketing systems being upgraded. The upgrade represents an organic opportunity for firms to embrace cashless forms of payment like debit cards, credit cards, pre-paid cards, and QR code payments. Cash handling is expensive for companies, and going digital will hence be an economic and appealing option.
As the majority of equipment is equipped with cashless-friendly technology, competition among the payment providers will be heightened, which will fuel innovation and improved services to end users. This trend will underpin a wider transition to the cashless economy, promoting effortless and convenient digital payments. Payment providers will have the platform to capitalize on this trend to grow usage, increase volumes of transactions, and reinforce their position in the changing cards and payments landscape in China.
Unlock Market Intelligence
Explore the market potential with our data-driven report
Japan Cards and Payments Market Segmentation Analysis

By Card Type
- Contact Smart Card
- Contactless Smart Card
- Non-Smart Card
The most market-share dominated segment under the Card Type category is Contact Smart Card, which took 54% of the market. But The increased use of the "ripple mark" on credit and debit cards shows increased compatibility with contactless payments. More and more stores now accept devices with international ripple mark compatibility, increasing both the number of people using them and the frequency of use. This change caters to End users' desire for quicker, more convenient payments, complementing the overall trend towards a cashless society in Japan.
Contactless payment is spreading to other areas beyond retail, with significant adoption in the rail network. Historically dominated by pre-paid transportation IC cards using FeliCa technology, the rail network is now embracing contactless payments via international cards like Visa. This development lowers the cost of operations, increases convenience for foreign tourists, and illustrates Japan's move towards a modern, open payment landscape encompassing large financial institutions and small merchants.
Top Companies in Japan Cards and Payments Market
The top companies operating in the market include Credit Saison Co Ltd, Epos Card Co Ltd, Orient Corp, Rakuten Card Co Ltd, Sumitomo Mitsui Card Co Ltd, Mitsubishi UFJ Nicos Co Ltd, Aeon Credit Service Co Ltd, JCB Co Ltd, Toyota Finance Corp, Sumitomo Mitsui Trust Club Co Ltd, etc., are the top players operating in the Japan Cards and Payments Market.
Frequently Asked Questions
Related Report
1. Market Segmentation
1.1. Research Scope
1.2. Research Methodology
1.3. Definitions and Assumptions
2. Executive Summary
3. Japan Cards and Payments Market Policies, Regulations, and Standards
4. Japan Cards and Payments Market Dynamics
4.1. Growth Factors
4.2. Challenges
4.3. Trends
4.4. Opportunities
5. Japan Cards and Payments Market Statistics, 2022-2032F
5.1. Market Size & Growth Outlook
5.1.1. By Revenues in US$ Million
5.2. Market Segmentation & Growth Outlook
5.2.1. By Instrument Type
5.2.1.1. Cards- Market Insights and Forecast 2022-2032, USD Million
5.2.1.1.1. Debit Card- Market Insights and Forecast 2022-2032, USD Million
5.2.1.1.2. Charge Card- Market Insights and Forecast 2022-2032, USD Million
5.2.1.1.3. ATM Card- Market Insights and Forecast 2022-2032, USD Million
5.2.1.1.4. Pre-Paid Card- Market Insights and Forecast 2022-2032, USD Million
5.2.1.1.5. Credit Card- Market Insights and Forecast 2022-2032, USD Million
5.2.1.1.6. Store Card- Market Insights and Forecast 2022-2032, USD Million
5.2.1.2. Mobile Wallets- Market Insights and Forecast 2022-2032, USD Million
5.2.1.3. Cheques- Market Insights and Forecast 2022-2032, USD Million
5.2.1.4. Others- Market Insights and Forecast 2022-2032, USD Million
5.2.2. By Card Type
5.2.2.1. Contact Smart Card- Market Insights and Forecast 2022-2032, USD Million
5.2.2.2. Contactless Smart Card- Market Insights and Forecast 2022-2032, USD Million
5.2.2.3. Non-Smart Card- Market Insights and Forecast 2022-2032, USD Million
5.2.3. By Type of Payments
5.2.3.1. B2B- Market Insights and Forecast 2022-2032, USD Million
5.2.3.2. B2C- Market Insights and Forecast 2022-2032, USD Million
5.2.3.3. C2C- Market Insights and Forecast 2022-2032, USD Million
5.2.3.4. C2B- Market Insights and Forecast 2022-2032, USD Million
5.2.3.4.1. E-commerce Shopping- Market Insights and Forecast 2022-2032, USD Million
5.2.3.4.2. Payment at POS Terminals- Market Insights and Forecast 2022-2032, USD Million
5.2.4. By Transaction Type
5.2.4.1. Domestic- Market Insights and Forecast 2022-2032, USD Million
5.2.4.2. Foreign- Market Insights and Forecast 2022-2032, USD Million
5.2.5. By Application
5.2.5.1. Food & Groceries- Market Insights and Forecast 2022-2032, USD Million
5.2.5.2. Health & Pharmacies- Market Insights and Forecast 2022-2032, USD Million
5.2.5.3. Travel & Tourism- Market Insights and Forecast 2022-2032, USD Million
5.2.5.4. Hospitality- Market Insights and Forecast 2022-2032, USD Million
5.2.5.5. Others (Media & Entertainment)- Market Insights and Forecast 2022-2032, USD Million
5.2.6. By Competitors
5.2.6.1. Competition Characteristics
5.2.6.2. Market Share & Analysis
6. Japan Cards Market Statistics, 2022-2032F
6.1. Market Size & Growth Outlook
6.1.1. By Revenues in US$ Million
6.2. Market Segmentation & Growth Outlook
6.2.1. By Card Type- Market Insights and Forecast 2022-2032, USD Million
6.2.2. By Type of Payments- Market Insights and Forecast 2022-2032, USD Million
6.2.3. By Transaction Type- Market Insights and Forecast 2022-2032, USD Million
6.2.4. By Application- Market Insights and Forecast 2022-2032, USD Million
7. Japan Mobile Wallets Market Statistics, 2022-2032F
7.1. Market Size & Growth Outlook
7.1.1. By Revenues in US$ Million
7.2. Market Segmentation & Growth Outlook
7.2.1. By Type of Payments- Market Insights and Forecast 2022-2032, USD Million
7.2.2. By Transaction Type- Market Insights and Forecast 2022-2032, USD Million
7.2.3. By Application- Market Insights and Forecast 2022-2032, USD Million
8. Japan Cheques Market Statistics, 2022-2032F
8.1. Market Size & Growth Outlook
8.1.1. By Revenues in US$ Million
8.2. Market Segmentation & Growth Outlook
8.2.1. By Type of Payments- Market Insights and Forecast 2022-2032, USD Million
8.2.2. By Transaction Type- Market Insights and Forecast 2022-2032, USD Million
8.2.3. By Application- Market Insights and Forecast 2022-2032, USD Million
9. Competitive Outlook
9.1. Company Profiles
9.1.1. Rakuten Card Co Ltd
9.1.1.1. Business Description
9.1.1.2. Product Portfolio
9.1.1.3. Collaborations & Alliances
9.1.1.4. Recent Developments
9.1.1.5. Financial Details
9.1.1.6. Others
9.1.2. Sumitomo Mitsui Card Co Ltd
9.1.2.1. Business Description
9.1.2.2. Product Portfolio
9.1.2.3. Collaborations & Alliances
9.1.2.4. Recent Developments
9.1.2.5. Financial Details
9.1.2.6. Others
9.1.3. Mitsubishi UFJ Nicos Co Ltd
9.1.3.1. Business Description
9.1.3.2. Product Portfolio
9.1.3.3. Collaborations & Alliances
9.1.3.4. Recent Developments
9.1.3.5. Financial Details
9.1.3.6. Others
9.1.4. Aeon Credit Service Co Ltd
9.1.4.1. Business Description
9.1.4.2. Product Portfolio
9.1.4.3. Collaborations & Alliances
9.1.4.4. Recent Developments
9.1.4.5. Financial Details
9.1.4.6. Others
9.1.5. JCB Co Ltd
9.1.5.1. Business Description
9.1.5.2. Product Portfolio
9.1.5.3. Collaborations & Alliances
9.1.5.4. Recent Developments
9.1.5.5. Financial Details
9.1.5.6. Others
9.1.6. Credit Saison Co Ltd
9.1.6.1. Business Description
9.1.6.2. Product Portfolio
9.1.6.3. Collaborations & Alliances
9.1.6.4. Recent Developments
9.1.6.5. Financial Details
9.1.6.6. Others
9.1.7. Epos Card Co Ltd
9.1.7.1. Business Description
9.1.7.2. Product Portfolio
9.1.7.3. Collaborations & Alliances
9.1.7.4. Recent Developments
9.1.7.5. Financial Details
9.1.7.6. Others
9.1.8. Orient Corp
9.1.8.1. Business Description
9.1.8.2. Product Portfolio
9.1.8.3. Collaborations & Alliances
9.1.8.4. Recent Developments
9.1.8.5. Financial Details
9.1.8.6. Others
9.1.9. Toyota Finance Corp
9.1.9.1. Business Description
9.1.9.2. Product Portfolio
9.1.9.3. Collaborations & Alliances
9.1.9.4. Recent Developments
9.1.9.5. Financial Details
9.1.9.6. Others
9.1.10. Sumitomo Mitsui Trust Club Co Ltd
9.1.10.1. Business Description
9.1.10.2. Product Portfolio
9.1.10.3. Collaborations & Alliances
9.1.10.4. Recent Developments
9.1.10.5. Financial Details
9.1.10.6. Others
10. Disclaimer
| Segment | Sub-Segment |
|---|---|
| By Instrument Type |
|
| By Card Type |
|
| By Type of Payments |
|
| By Transaction Type |
|
| By Application |
|
Research Methodology
This study followed a structured approach comprising four key phases to assess the size and scope of the electro-oxidation market. The process began with thorough secondary research to collect data on the target market, related markets, and broader industry context. These findings, along with preliminary assumptions and estimates, were then validated through extensive primary research involving industry experts from across the value chain. To calculate the overall market size, both top-down and bottom-up methodologies were employed. Finally, market segmentation and data triangulation techniques were applied to refine and validate segment-level estimations.
Secondary Research
The secondary research phase involved gathering data from a wide range of credible and published sources. This step helped in identifying industry trends, defining market segmentation, and understanding the market landscape and value chain.
Sources consulted during this phase included:
- Company annual reports, investor presentations, and press releases
- Industry white papers and certified publications
- Trade directories and market-recognized databases
- Articles from authoritative authors and reputable journals
- Gold and silver standard websites
Secondary research was critical in mapping out the industry's value chain and monetary flow, identifying key market segments, understanding regional variations, and tracking significant industry developments.
Other key sources:
- Financial disclosures
- Industry associations and trade bodies
- News outlets and business magazines
- Academic journals and research studies
- Paid industry databases
Primary Research
To validate secondary data and gain deeper market insights, primary research was conducted with key stakeholders across both the supply and demand sides of the market.
On the demand side, participants included decision-makers and influencers from end-user industries—such as CIOs, CTOs, and CSOs—who provided first-hand perspectives on market needs, product usage, and future expectations.
On the supply side, interviews were conducted with manufacturers, industry associations, and institutional participants to gather insights into current offerings, product pipelines, and market challenges.
Primary interviews provided critical inputs such as:
- Market size and revenue data
- Product and service breakdowns
- Market forecasts
- Regional and application-specific trends
Stakeholders consulted included:
- Leading OEM and solution providers
- Channel and distribution partners
- End users across various applications
- Independent consultants and industry specialists
Market Size Estimation and Data Triangulation
- Identifying Key Market Participants (Secondary Research)
- Goal: To identify the major players or companies in the target market. This typically involves using publicly available data sources such as industry reports, market research publications, and financial statements of companies.
- Tools: Reports from firms like Gartner, Forrester, Euromonitor, Statista, IBISWorld, and others. Public financial statements, news articles, and press releases from top market players.
- Extracting Earnings of Key Market Participants
- Goal: To estimate the earnings generated from the product or service being analyzed. This step helps in understanding the revenue potential of each market player in a specific geography.
- Methods: Earnings data can be gathered from:
- Publicly available financial reports (for listed companies).
- Interviews and primary data sources from professionals, such as Directors, VPs, SVPs, etc. This is especially useful for understanding more nuanced, internal data that isn't publicly disclosed.
- Annual reports and investor presentations of key players.
- Data Collation and Development of a Relevant Data Model
- Goal: To collate inputs from both primary and secondary sources into a structured, data-driven model for market estimation. This model will incorporate key market KPIs and any independent variables relevant to the market.
- Key KPIs: These could include:
- Market size, growth rate, and demand drivers.
- Industry-specific metrics like market share, average revenue per customer (ARPC), or average deal size.
- External variables, such as economic growth rates, inflation rates, or commodity prices, that could affect the market.
- Data Modeling: Based on this data, the market forecasts are developed for the next 5 years. A combination of trend analysis, scenario modeling, and statistical regression might be used to generate projections.
- Scenario Analysis
- Goal: To test different assumptions and validate how sensitive the market is to changes in key variables (e.g., market demand, regulatory changes, technological disruptions).
- Types of Scenarios:
- Base Case: Based on current assumptions and historical data.
- Best-Case Scenario: Assuming favorable market conditions, regulatory environments, and technological advancements.
- Worst-Case Scenario: Accounting for adverse factors, such as economic downturns, stricter regulations, or unexpected disruptions.


