Israel Beer Market Report: Trends, Growth and Forecast (2026-2032)
By Product Type (Dark Beer (Ale, Sorghum Beer, Weissbier/Weizen/Wheat Beer), Lager (Flavoured/Mixed Lager, Standard Lager (Premium Lager (Domestic Premium Lager, Imported Premium Lager), Mid-Priced Lager (Domestic Mid-Priced Lager, Imported Mid-Priced Lager), Economy Lager (Domestic Economy Lager, Imported Economy Lager))), Non/Low Alcohol Beer (Low Alcohol Beer, Non Alcoholic Beer), Stout, Others (Porter, Malt etc.)), By Production (Macro Brewery, Micro Brewery, Craft Brewery), By Packaging Type (Bottles, Cans, Others), By Sales Channel (On-Trade, Off-Trade) ... Read more
|
Major Players
|
Israel Beer Market Statistics and Insights, 2026
- Market Size Statistics
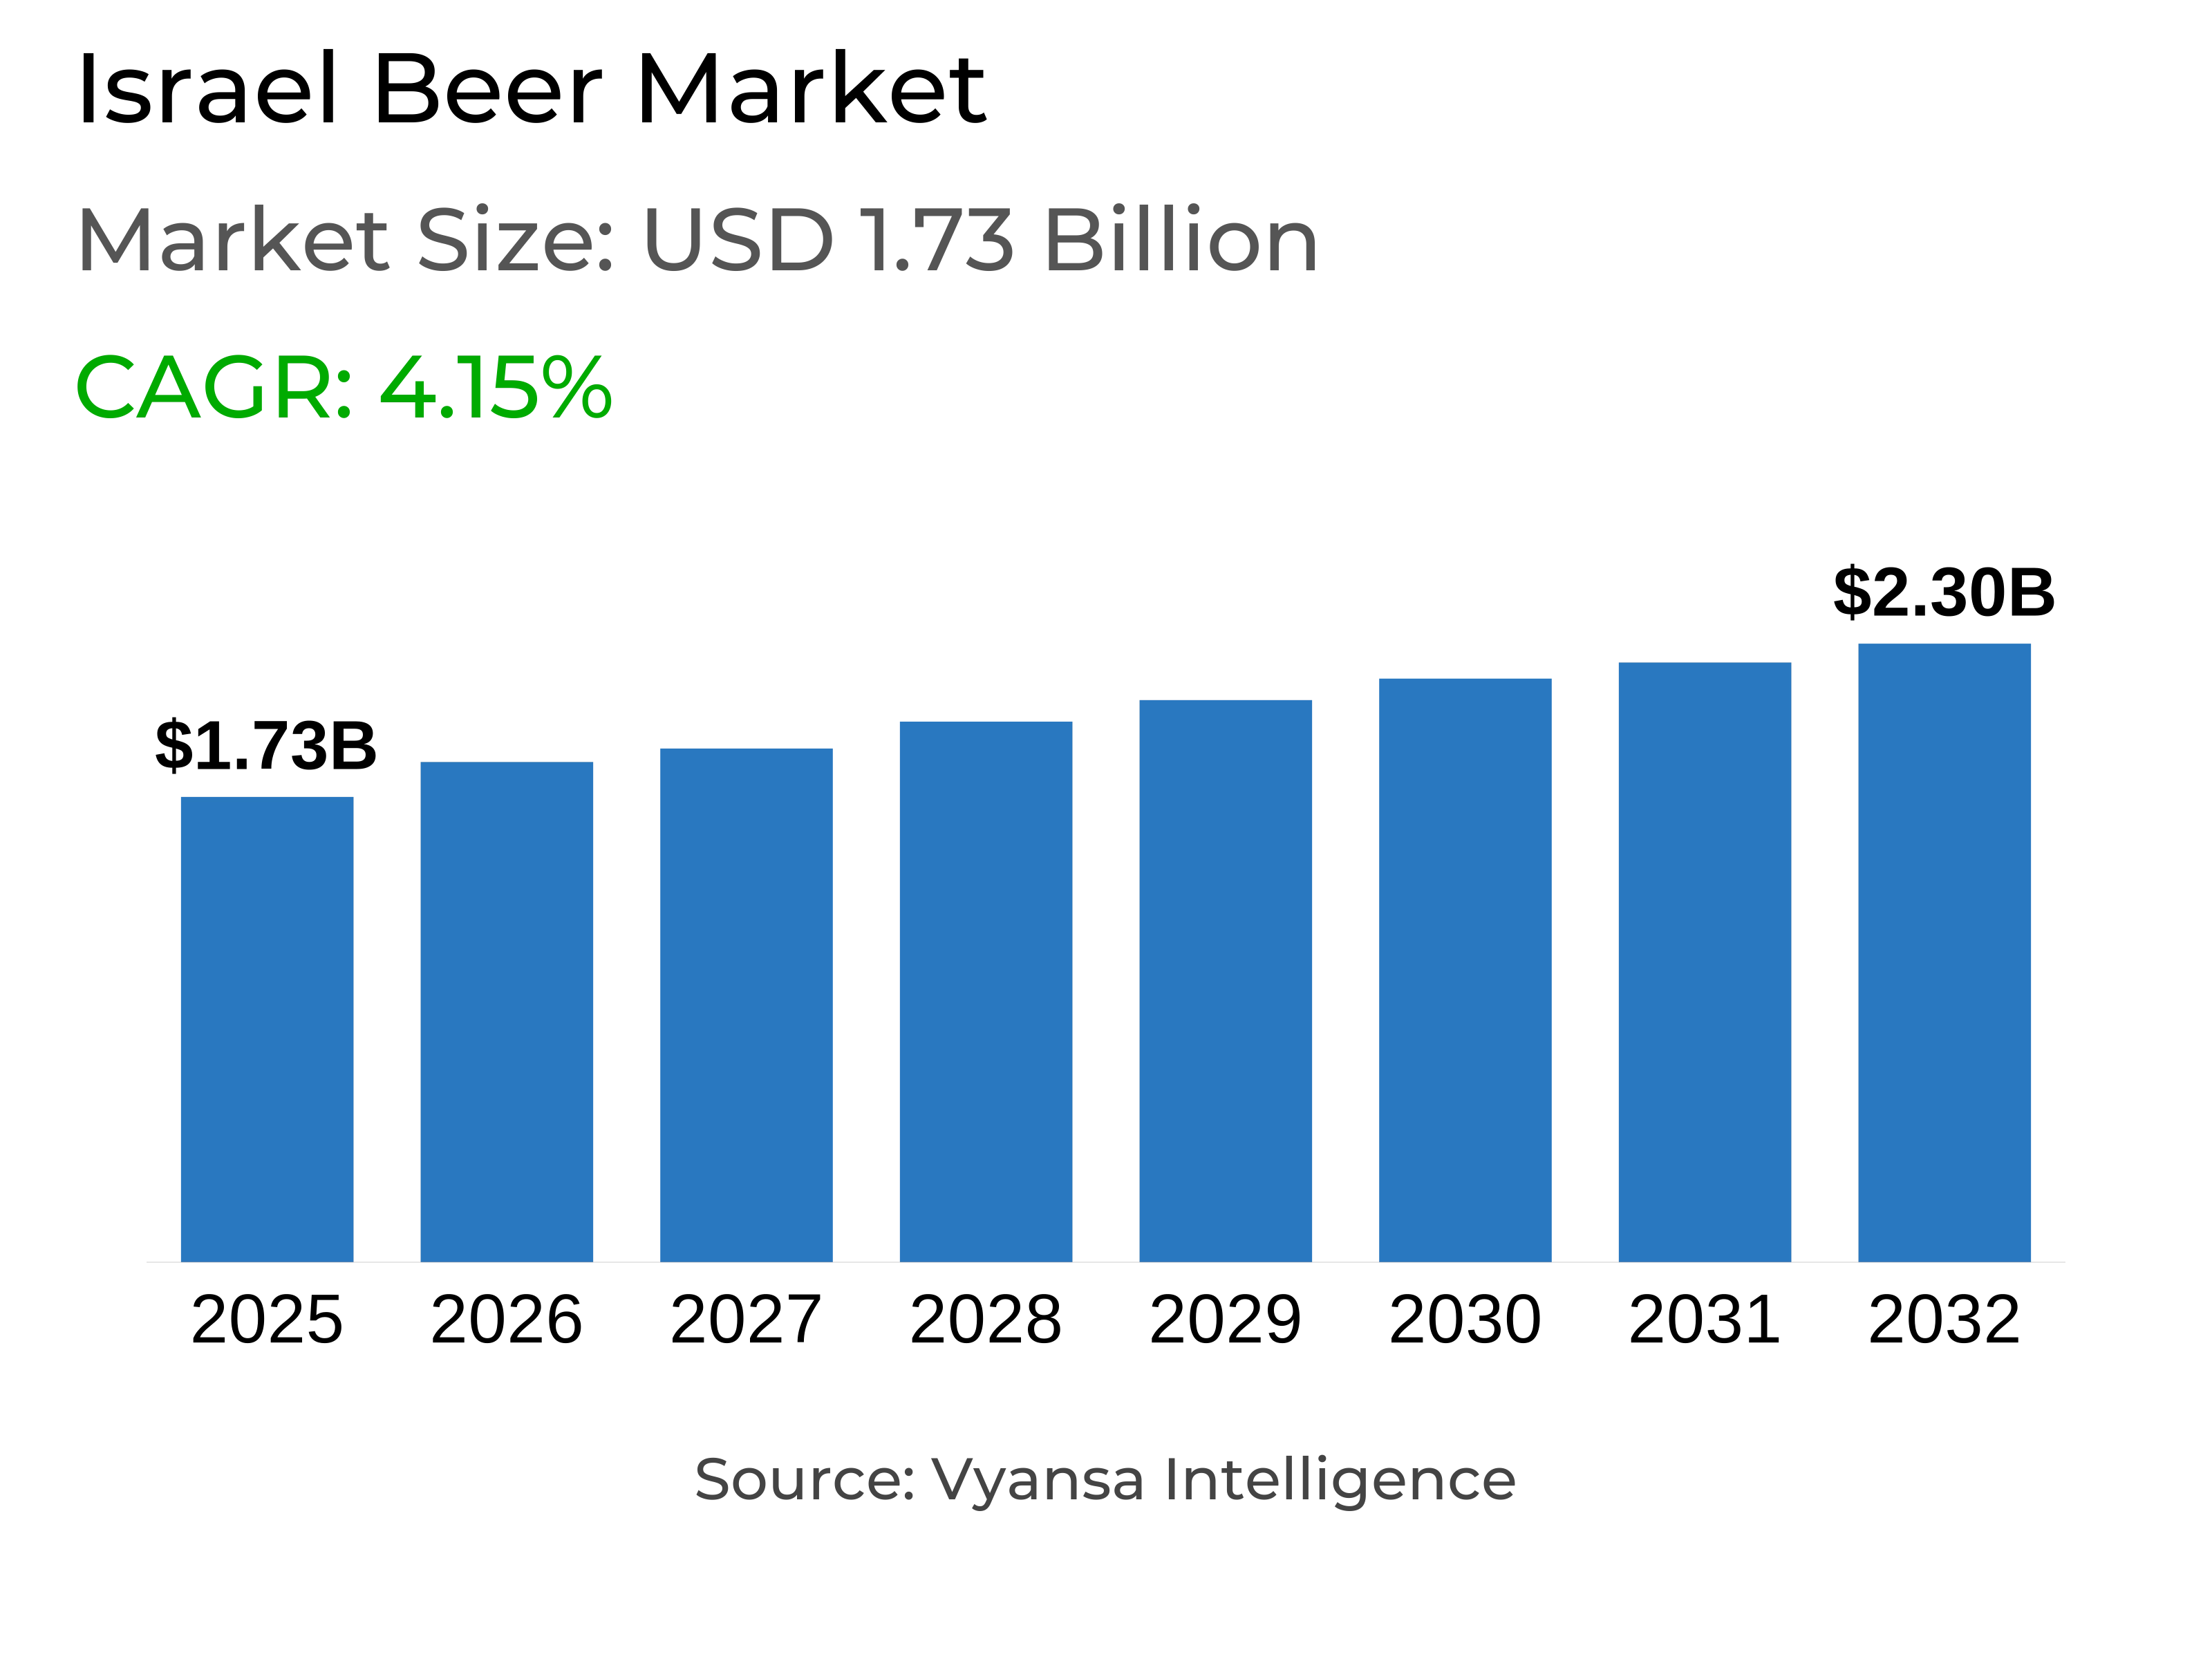
- Beer in israel is estimated at USD 1.73 billion.
- The market size is expected to grow to USD 2.3 billion by 2032.
- Market to register a cagr of around 4.15% during 2026-32.
- Product Type Shares
- Lager grabbed market share of 80%.
- Lager to witness a volume cagr of around 3.51%.
- Competition
- More than 15 companies are actively engaged in producing beer in israel.
- Top 5 companies acquired around 70% of the market share.
- Hacarem Spirits Ltd, Y & D Enterprises Ltd, Jems Brewery Ltd, Tempo Beer Industries Ltd, Israel Beer Breweries Ltd etc., are few of the top companies.
- Sales Channel
- On-trade grabbed 55% of the market.
Israel Beer Market Outlook
The Israel beer market stands at $1.73 billion in 2025 and will grow to $2.3 billion by 2032, recording a CAGR of approximately 4.15% between 2026–2032. Beer volumes will recover slowly as the socio-political environment stabilizes and on-trade outlets open in full again. Domestic tourism returning and higher end users confidence will drive growth, especially in restaurants, bars, and cafés, which have traditionally been the main drivers of beer consumption.
Lager holds a market share of 80% and is set to experience a volume CAGR of approximately 3.51%. Domestic mid-priced lagers, especially Goldstar, will remain in front thanks to sustained brand loyalty and extensive availability. Premium brands such as Corona Extra and limited-issue launches will also drive value growth, and the niche area of non- and low-alcohol beers will continue to grow in line with increasing health consciousness among end users.
By sales channel, 55% of the market is on-trade, hence critical to overall growth. On-trade recovery will be the primary driver of volume sales, with consistent off-trade performance, particularly via discounters, that are the biggest off-trade channel due to competitive pricing and increasing availability of craft beer. Retail e-commerce also will gain incremental share, offering convenience and access to niche products.
Craft and ale beers will witness the strongest growth during the forecast period. Local breweries will keep experimenting with new tastes, fruit styles, and cans, which maintain beer quality and appeal to contemporary end users. In general, Israel beer market will expand steadily, fueled by a recovering on-trade, premiumisation, and growing end users interest in distinctive and craft beer varieties.

Israel Beer Market Growth DriverRising Prices Support Value Growth
Beer value sales in Israel continue to grow steadily as retailers and distributors hike prices to cover increasing raw material and import costs. Premium brands and mid-range brands continue to hold their ground owing to end users confidence in local brews such as Goldstar and Carlsberg. Even if volume sales remain flat, the market continues to drive revenue growth because end users derive confidence in these brands as portraying quality and reliability.
Strategic marketing efforts highlighting cultural salience and local actions enhance brand loyalty, ensuring sustained demand in the face of market vagaries. Limited supply of specialty local and niche beers also contributes to the growth of value of established brands. Price steps and dependable brand equity combined enable breweries to achieve revenue growth, thus rising prices become a central driver of the market's financial performance.
Israel Beer Market ChallengeGeopolitical Tensions Affect Market Stability
The Israel-Hamas conflict imposes major challenges to beer drinking and production. Increased security fears minimize social occasions and parties, impacting the sales volumes directly as residents cut back on discretionary spending. end users behavior is defined by safety needs, which minimizes consumption throughout the market.
Local breweries experience business interruptions when employees are summoned for reserve duty, and production plans may be delayed. The downturn in tourism also restricts access to new end users and overall market activity. Such geopolitical tensions introduce uncertainty, and it is challenging for breweries to effectively plan marketing, distribution, and expansion strategies, thus limiting growth prospects.
Unlock Market Intelligence
Explore the market potential with our data-driven report
Israel Beer Market TrendCraft Innovation and Health-Conscious Beers Gain Momentum
End users in Israel are increasingly turn to craft beers and health-based alternatives. Craft breweries lead innovation through ales, fruit-flavored versions, and specialty brews, presenting differentiated taste and experience. Local breweries based on creativity, quality, and cultural connection enjoy high end users take-up as a sign of a move toward adventurous consumption.
At the same time, low-alcohol and non-alcoholic beers become increasingly popular with health-conscious end users. Carlsberg 0% is one such product that attracts end users who pursue moderation while avoiding impacts on taste. Craft innovation combined with health-driven options redefines end users taste, prompting breweries to release innovative flavors, premium products, and healthier options that respond to changing demand.
Israel Beer Market OpportunityGrowth Potential in the Premium Craft Segment
The premium craft beer category in Israel also has good growth prospects as end users look for distinctive, locally oriented flavors more and more. Ales, specialty beers, and fruit beers enable breweries to differentiate and reach out to premium-paying end users.
Health-conscious trends will increase the market for non-alcoholic and low-alcohol craft beers, presenting a wider end users base. Breweries that use storytelling, local culture, and quality ingredients can enhance brand strength and engage new end users. The premium craft sector has opportunities for revenue growth and expansion in the market, especially through product innovation and growing demand for high-quality, distinctive, and culturally appropriate beers.
Unlock Market Intelligence
Explore the market potential with our data-driven report
Israel Beer Market Segmentation Analysis

By Product Type
- Dark Beer
- Lager
- Non/Low Alcohol Beer
- Stout
The segment with highest market share under Product Type of lager, and that highest market share is approximately 80%. Lager keeps ruling the Israel beer market because of the strong local end users base, high availability, and established brands like Goldstar and Carlsberg. Mid-range lagers are still the most common choice for daily consumption, and premium and imported lagers serve niche and celebratory occasions.
lager will experience a volume CAGR of approximately 3.51% due to end users appeal for local flavors and packaging innovations like canned formats. Whereas craft ales and flavored beers receive traction, the segment of lagers continues to hold its pivotal position, backed by steady household demand and brand loyalty towards mature domestic brands. Players will also continue promoting campaigns based on local heritage and quality to promote the largest share of lagers.
By Sales Channel
- On-Trade
- Off-Trade
The segment has the largest proportion under the Channel of Sales is on-trade, with this largest market share being approximately 55%. On-trade channels, such as bars, pubs, and restaurants, continue to be significant for social drinking in Israel. These establishments are central for sampling premium and craft beer and draw end users who prioritize experience over quantity, rendering them critical for driving both brand awareness and loyalty.
on-trade will recover progressively, particularly as social conditions normalise and tourism returns. Breweries will concentrate on building relationships with on-trade operators and providing specialty products and promotions to keep end users interested. The channel will also gain from the growing popularity of craft and canned beers, which interest end users looking for new flavours and easy packaging in social environments.
Top Companies in Israel Beer Market
The top companies operating in the market include Hacarem Spirits Ltd, Y & D Enterprises Ltd, Jems Brewery Ltd, Tempo Beer Industries Ltd, Israel Beer Breweries Ltd, Tymco Beer Ltd, Carmel Corp Ltd, SIL Rubin Ltd, Alexander Ltd, AGTD Ltd, etc., are the top players operating in the israel beer market.
Frequently Asked Questions
Related Report
1. Market Segmentation
1.1. Research Scope
1.2. Research Methodology
1.3. Definitions and Assumptions
2. Executive Summary
3. Israel Beer Market Policies, Regulations, and Standards
4. Israel Beer Market Dynamics
4.1. Growth Factors
4.2. Challenges
4.3. Trends
4.4. Opportunities
5. Israel Beer Market Statistics, 2022-2032F
5.1. Market Size & Growth Outlook
5.1.1. By Revenues in US$ Million
5.1.2. By Quantity Sold in Million Litres
5.2. Market Segmentation & Growth Outlook
5.2.1. By Product Type
5.2.1.1. Dark Beer- Market Insights and Forecast 2022-2032, USD Million
5.2.1.1.1. Ale- Market Insights and Forecast 2022-2032, USD Million
5.2.1.1.2. Sorghum Beer- Market Insights and Forecast 2022-2032, USD Million
5.2.1.1.3. Weissbier/Weizen/Wheat Beer- Market Insights and Forecast 2022-2032, USD Million
5.2.1.2. Lager- Market Insights and Forecast 2022-2032, USD Million
5.2.1.2.1. Flavoured/Mixed Lager- Market Insights and Forecast 2022-2032, USD Million
5.2.1.2.2. Standard Lager- Market Insights and Forecast 2022-2032, USD Million
5.2.1.2.2.1. Premium Lager- Market Insights and Forecast 2022-2032, USD Million
5.2.1.2.2.1.1. Domestic Premium Lager- Market Insights and Forecast 2022-2032, USD Million
5.2.1.2.2.1.2. Imported Premium Lager- Market Insights and Forecast 2022-2032, USD Million
5.2.1.2.2.2. Mid-Priced Lager- Market Insights and Forecast 2022-2032, USD Million
5.2.1.2.2.2.1. Domestic Mid-Priced Lager- Market Insights and Forecast 2022-2032, USD Million
5.2.1.2.2.2.2. Imported Mid-Priced Lager- Market Insights and Forecast 2022-2032, USD Million
5.2.1.2.2.3. Economy Lager- Market Insights and Forecast 2022-2032, USD Million
5.2.1.2.2.3.1. Domestic Economy Lager- Market Insights and Forecast 2022-2032, USD Million
5.2.1.2.2.3.2. Imported Economy Lager- Market Insights and Forecast 2022-2032, USD Million
5.2.1.3. Non/Low Alcohol Beer- Market Insights and Forecast 2022-2032, USD Million
5.2.1.3.1. Low Alcohol Beer- Market Insights and Forecast 2022-2032, USD Million
5.2.1.3.2. Non Alcoholic Beer- Market Insights and Forecast 2022-2032, USD Million
5.2.1.4. Stout- Market Insights and Forecast 2022-2032, USD Million
5.2.1.5. Others (Porter, Malt etc.) - Market Insights and Forecast 2022-2032, USD Million
5.2.2. By Production
5.2.2.1. Macro Brewery- Market Insights and Forecast 2022-2032, USD Million
5.2.2.2. Micro Brewery- Market Insights and Forecast 2022-2032, USD Million
5.2.2.3. Craft Brewery- Market Insights and Forecast 2022-2032, USD Million
5.2.3. By Packaging Type
5.2.3.1. Bottles- Market Insights and Forecast 2022-2032, USD Million
5.2.3.2. Cans- Market Insights and Forecast 2022-2032, USD Million
5.2.3.3. Others- Market Insights and Forecast 2022-2032, USD Million
5.2.4. By Sales Channel
5.2.4.1. On-Trade- Market Insights and Forecast 2022-2032, USD Million
5.2.4.2. Off-Trade- Market Insights and Forecast 2022-2032, USD Million
5.2.5. By Competitors
5.2.5.1. Competition Characteristics
5.2.5.2. Market Share & Analysis
6. Israel Dark Beer Market Statistics, 2022-2032F
6.1. Market Size & Growth Outlook
6.1.1. By Revenues in US$ Million
6.1.2. By Quantity Sold in Million Litres
6.2. Market Segmentation & Growth Outlook
6.2.1. By Product Type- Market Insights and Forecast 2022-2032, USD Million
6.2.2. By Production- Market Insights and Forecast 2022-2032, USD Million
6.2.3. By Packaging Type- Market Insights and Forecast 2022-2032, USD Million
6.2.4. By Sales Channel- Market Insights and Forecast 2022-2032, USD Million
7. Israel Lager Beer Market Statistics, 2022-2032F
7.1. Market Size & Growth Outlook
7.1.1. By Revenues in US$ Million
7.1.2. By Quantity Sold in Million Litres
7.2. Market Segmentation & Growth Outlook
7.2.1. By Product Type- Market Insights and Forecast 2022-2032, USD Million
7.2.2. By Production- Market Insights and Forecast 2022-2032, USD Million
7.2.3. By Packaging Type- Market Insights and Forecast 2022-2032, USD Million
7.2.4. By Sales Channel- Market Insights and Forecast 2022-2032, USD Million
8. Israel Non/Low Alcohol Beer Market Statistics, 2022-2032F
8.1. Market Size & Growth Outlook
8.1.1. By Revenues in US$ Million
8.1.2. By Quantity Sold in Million Litres
8.2. Market Segmentation & Growth Outlook
8.2.1. By Production- Market Insights and Forecast 2022-2032, USD Million
8.2.2. By Packaging Type- Market Insights and Forecast 2022-2032, USD Million
8.2.3. By Sales Channel- Market Insights and Forecast 2022-2032, USD Million
9. Israel Stout Beer Market Statistics, 2022-2032F
9.1. Market Size & Growth Outlook
9.1.1. By Revenues in US$ Million
9.1.2. By Quantity Sold in Million Litres
9.2. Market Segmentation & Growth Outlook
9.2.1. By Production- Market Insights and Forecast 2022-2032, USD Million
9.2.2. By Packaging Type- Market Insights and Forecast 2022-2032, USD Million
9.2.3. By Sales Channel- Market Insights and Forecast 2022-2032, USD Million
10. Competitive Outlook
10.1.Company Profiles
10.1.1. Tempo Beer Industries Ltd
10.1.1.1. Business Description
10.1.1.2. Product Portfolio
10.1.1.3. Collaborations & Alliances
10.1.1.4. Recent Developments
10.1.1.5. Financial Details
10.1.1.6. Others
10.1.2. Israel Beer Breweries Ltd
10.1.2.1. Business Description
10.1.2.2. Product Portfolio
10.1.2.3. Collaborations & Alliances
10.1.2.4. Recent Developments
10.1.2.5. Financial Details
10.1.2.6. Others
10.1.3. Tymco Beer Ltd
10.1.3.1. Business Description
10.1.3.2. Product Portfolio
10.1.3.3. Collaborations & Alliances
10.1.3.4. Recent Developments
10.1.3.5. Financial Details
10.1.3.6. Others
10.1.4. Carmel Corp Ltd
10.1.4.1. Business Description
10.1.4.2. Product Portfolio
10.1.4.3. Collaborations & Alliances
10.1.4.4. Recent Developments
10.1.4.5. Financial Details
10.1.4.6. Others
10.1.5. SIL Rubin Ltd
10.1.5.1. Business Description
10.1.5.2. Product Portfolio
10.1.5.3. Collaborations & Alliances
10.1.5.4. Recent Developments
10.1.5.5. Financial Details
10.1.5.6. Others
10.1.6. Hacarem Spirits Ltd
10.1.6.1. Business Description
10.1.6.2. Product Portfolio
10.1.6.3. Collaborations & Alliances
10.1.6.4. Recent Developments
10.1.6.5. Financial Details
10.1.6.6. Others
10.1.7. Y & D Enterprises Ltd
10.1.7.1. Business Description
10.1.7.2. Product Portfolio
10.1.7.3. Collaborations & Alliances
10.1.7.4. Recent Developments
10.1.7.5. Financial Details
10.1.7.6. Others
10.1.8. Jems Brewery Ltd
10.1.8.1. Business Description
10.1.8.2. Product Portfolio
10.1.8.3. Collaborations & Alliances
10.1.8.4. Recent Developments
10.1.8.5. Financial Details
10.1.8.6. Others
10.1.9. Alexander Ltd
10.1.9.1. Business Description
10.1.9.2. Product Portfolio
10.1.9.3. Collaborations & Alliances
10.1.9.4. Recent Developments
10.1.9.5. Financial Details
10.1.9.6. Others
10.1.10. AGTD Ltd
10.1.10.1. Business Description
10.1.10.2. Product Portfolio
10.1.10.3. Collaborations & Alliances
10.1.10.4. Recent Developments
10.1.10.5. Financial Details
10.1.10.6. Others
11. Disclaimer
| Segment | Sub-Segment |
|---|---|
| By Product Type |
|
| By Production |
|
| By Packaging Type |
|
| By Sales Channel |
|
Research Methodology
This study followed a structured approach comprising four key phases to assess the size and scope of the electro-oxidation market. The process began with thorough secondary research to collect data on the target market, related markets, and broader industry context. These findings, along with preliminary assumptions and estimates, were then validated through extensive primary research involving industry experts from across the value chain. To calculate the overall market size, both top-down and bottom-up methodologies were employed. Finally, market segmentation and data triangulation techniques were applied to refine and validate segment-level estimations.
Secondary Research
The secondary research phase involved gathering data from a wide range of credible and published sources. This step helped in identifying industry trends, defining market segmentation, and understanding the market landscape and value chain.
Sources consulted during this phase included:
- Company annual reports, investor presentations, and press releases
- Industry white papers and certified publications
- Trade directories and market-recognized databases
- Articles from authoritative authors and reputable journals
- Gold and silver standard websites
Secondary research was critical in mapping out the industry's value chain and monetary flow, identifying key market segments, understanding regional variations, and tracking significant industry developments.
Other key sources:
- Financial disclosures
- Industry associations and trade bodies
- News outlets and business magazines
- Academic journals and research studies
- Paid industry databases
Primary Research
To validate secondary data and gain deeper market insights, primary research was conducted with key stakeholders across both the supply and demand sides of the market.
On the demand side, participants included decision-makers and influencers from end-user industries—such as CIOs, CTOs, and CSOs—who provided first-hand perspectives on market needs, product usage, and future expectations.
On the supply side, interviews were conducted with manufacturers, industry associations, and institutional participants to gather insights into current offerings, product pipelines, and market challenges.
Primary interviews provided critical inputs such as:
- Market size and revenue data
- Product and service breakdowns
- Market forecasts
- Regional and application-specific trends
Stakeholders consulted included:
- Leading OEM and solution providers
- Channel and distribution partners
- End users across various applications
- Independent consultants and industry specialists
Market Size Estimation and Data Triangulation
- Identifying Key Market Participants (Secondary Research)
- Goal: To identify the major players or companies in the target market. This typically involves using publicly available data sources such as industry reports, market research publications, and financial statements of companies.
- Tools: Reports from firms like Gartner, Forrester, Euromonitor, Statista, IBISWorld, and others. Public financial statements, news articles, and press releases from top market players.
- Extracting Earnings of Key Market Participants
- Goal: To estimate the earnings generated from the product or service being analyzed. This step helps in understanding the revenue potential of each market player in a specific geography.
- Methods: Earnings data can be gathered from:
- Publicly available financial reports (for listed companies).
- Interviews and primary data sources from professionals, such as Directors, VPs, SVPs, etc. This is especially useful for understanding more nuanced, internal data that isn't publicly disclosed.
- Annual reports and investor presentations of key players.
- Data Collation and Development of a Relevant Data Model
- Goal: To collate inputs from both primary and secondary sources into a structured, data-driven model for market estimation. This model will incorporate key market KPIs and any independent variables relevant to the market.
- Key KPIs: These could include:
- Market size, growth rate, and demand drivers.
- Industry-specific metrics like market share, average revenue per customer (ARPC), or average deal size.
- External variables, such as economic growth rates, inflation rates, or commodity prices, that could affect the market.
- Data Modeling: Based on this data, the market forecasts are developed for the next 5 years. A combination of trend analysis, scenario modeling, and statistical regression might be used to generate projections.
- Scenario Analysis
- Goal: To test different assumptions and validate how sensitive the market is to changes in key variables (e.g., market demand, regulatory changes, technological disruptions).
- Types of Scenarios:
- Base Case: Based on current assumptions and historical data.
- Best-Case Scenario: Assuming favorable market conditions, regulatory environments, and technological advancements.
- Worst-Case Scenario: Accounting for adverse factors, such as economic downturns, stricter regulations, or unexpected disruptions.


