Indonesia Pet Products Market Report: Trends, Growth and Forecast (2026-2032)
By Product (Cat Litter, Pet Healthcare (Flea/Tick Treatments, Pet Dietary Supplements, Worming Treatments, Others), Other Pet Products (Beauty Products, Accessories, Others)), By Sales Channel (Retail Offline, Retail E-Commerce, Veterinary Clinics) ... Read more
|
Major Players
|
Indonesia Pet Products Market Statistics and Insights, 2026
- Market Size Statistics
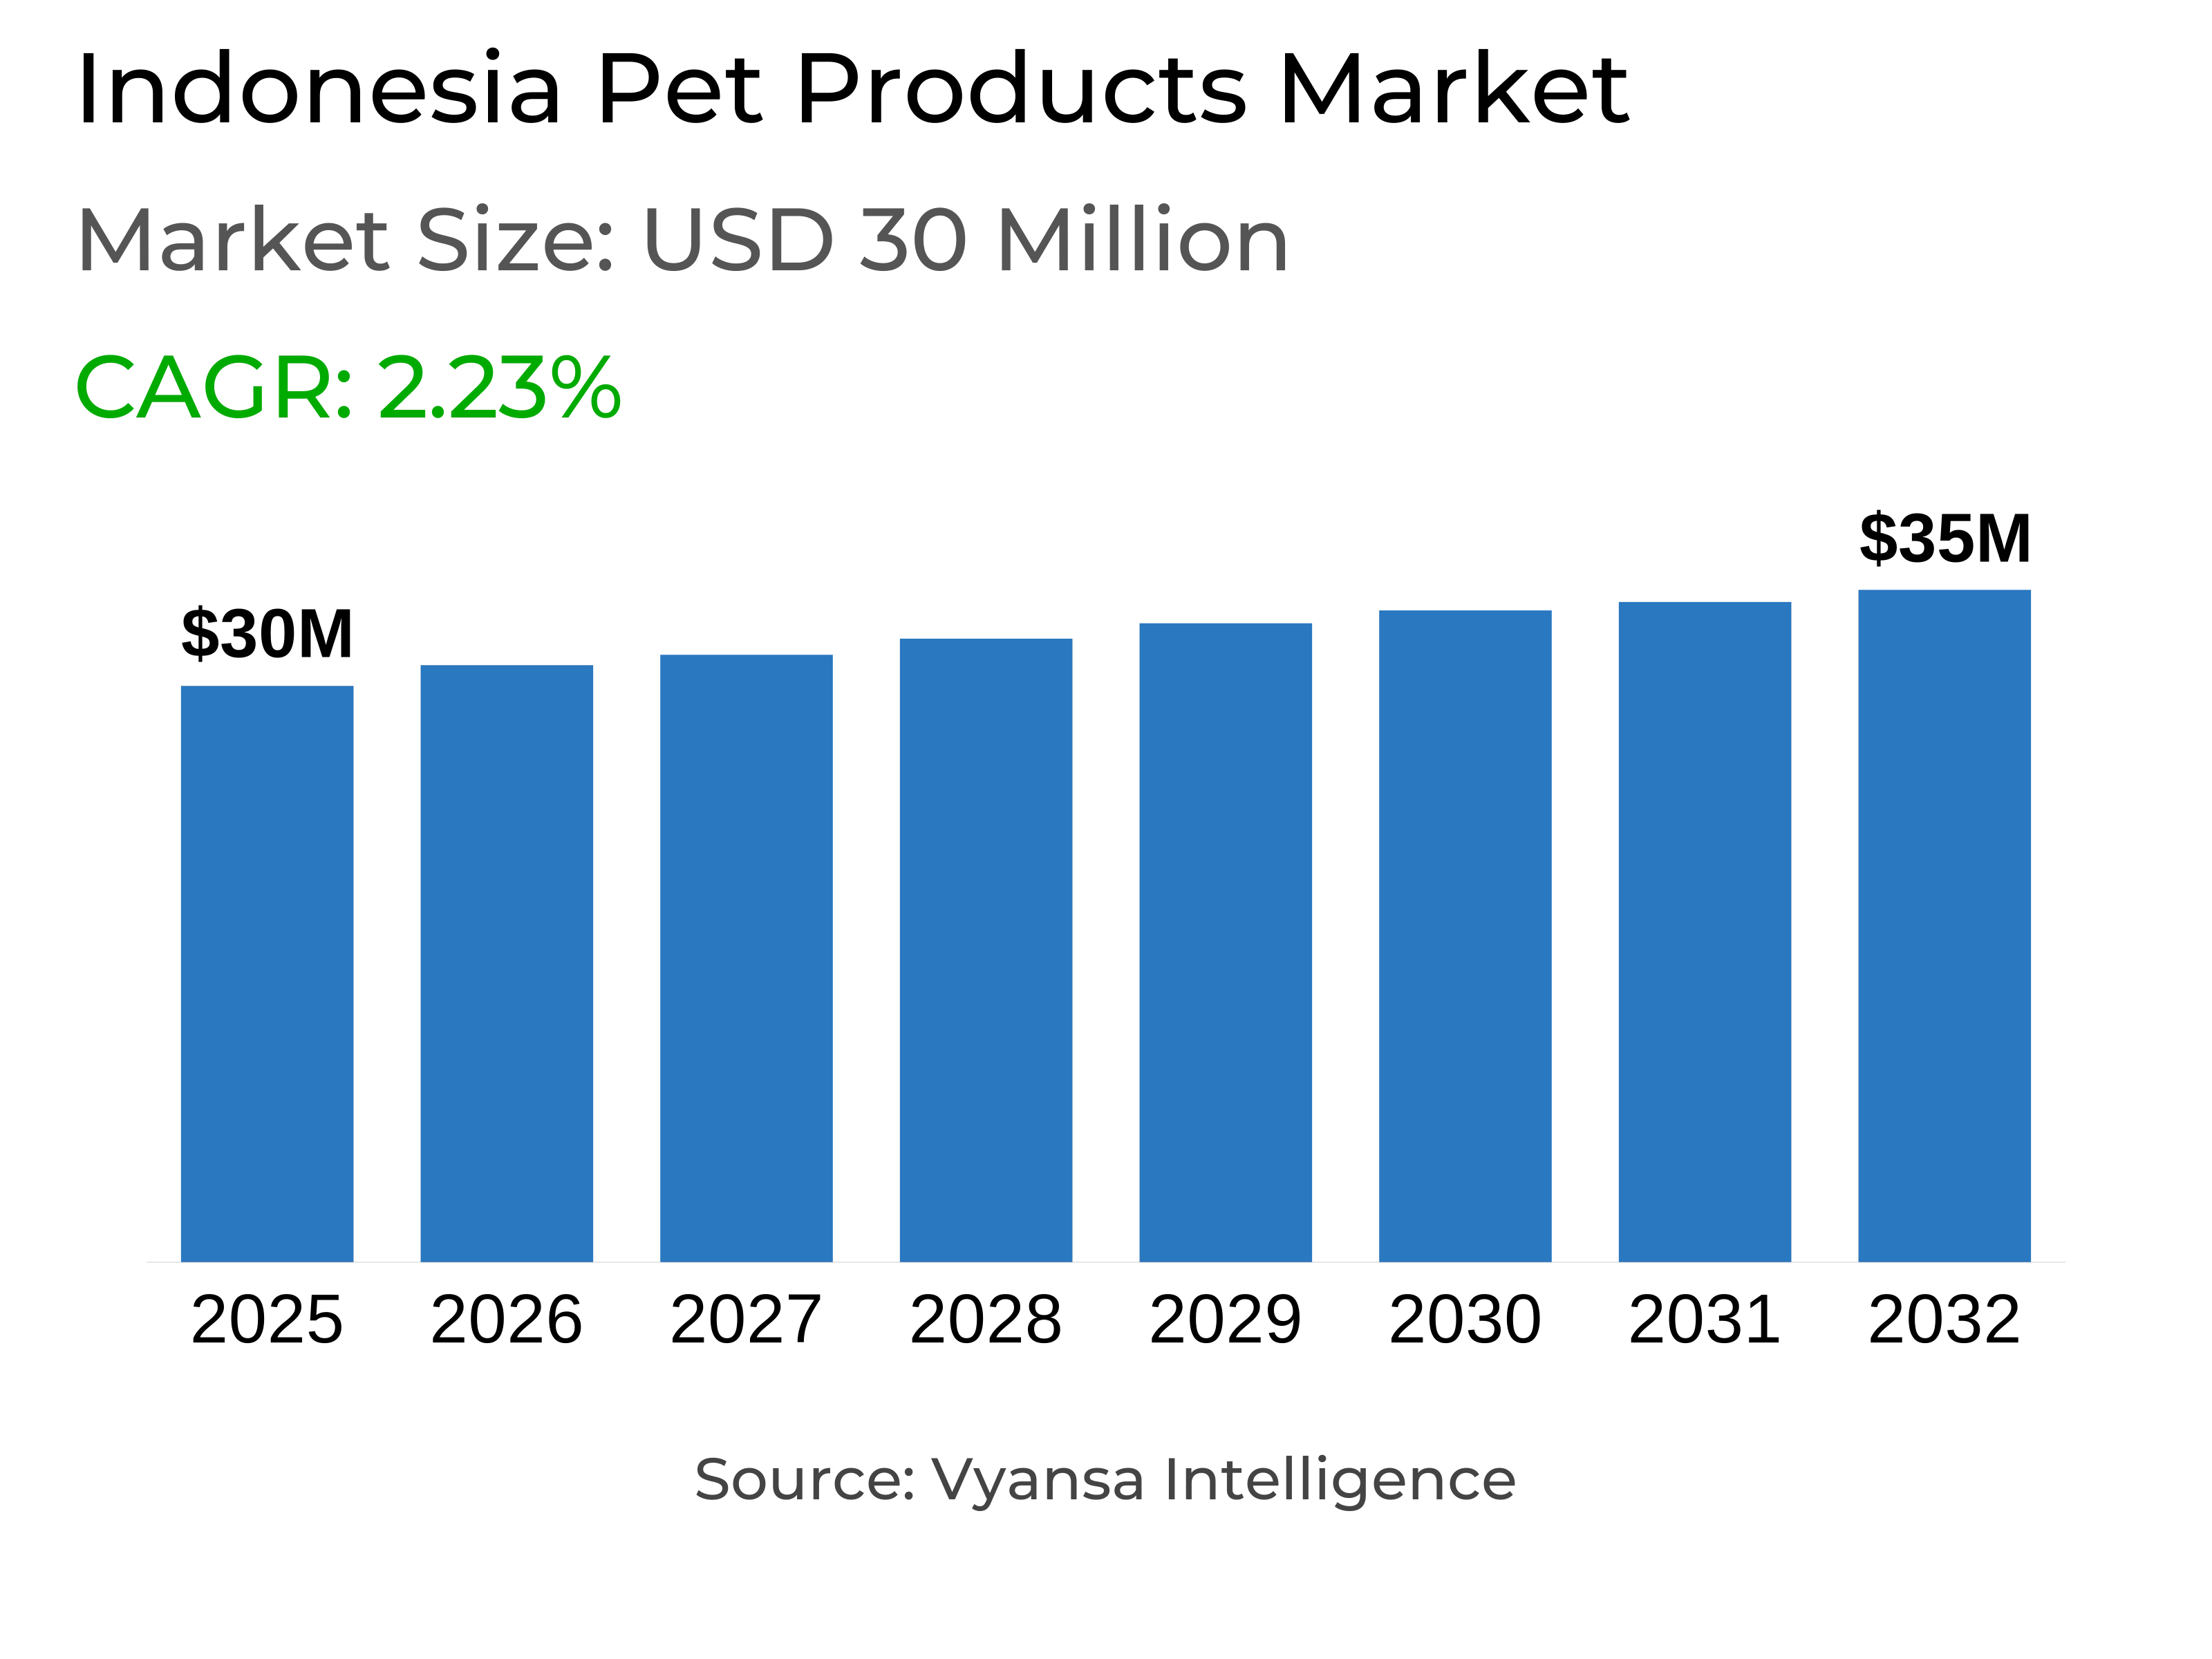
- Pet Products in Indonesia is estimated at $ 30 Million.
- The market size is expected to grow to $ 35 Million by 2032.
- Market to register a CAGR of around 2.23% during 2026-32.
- Product Shares
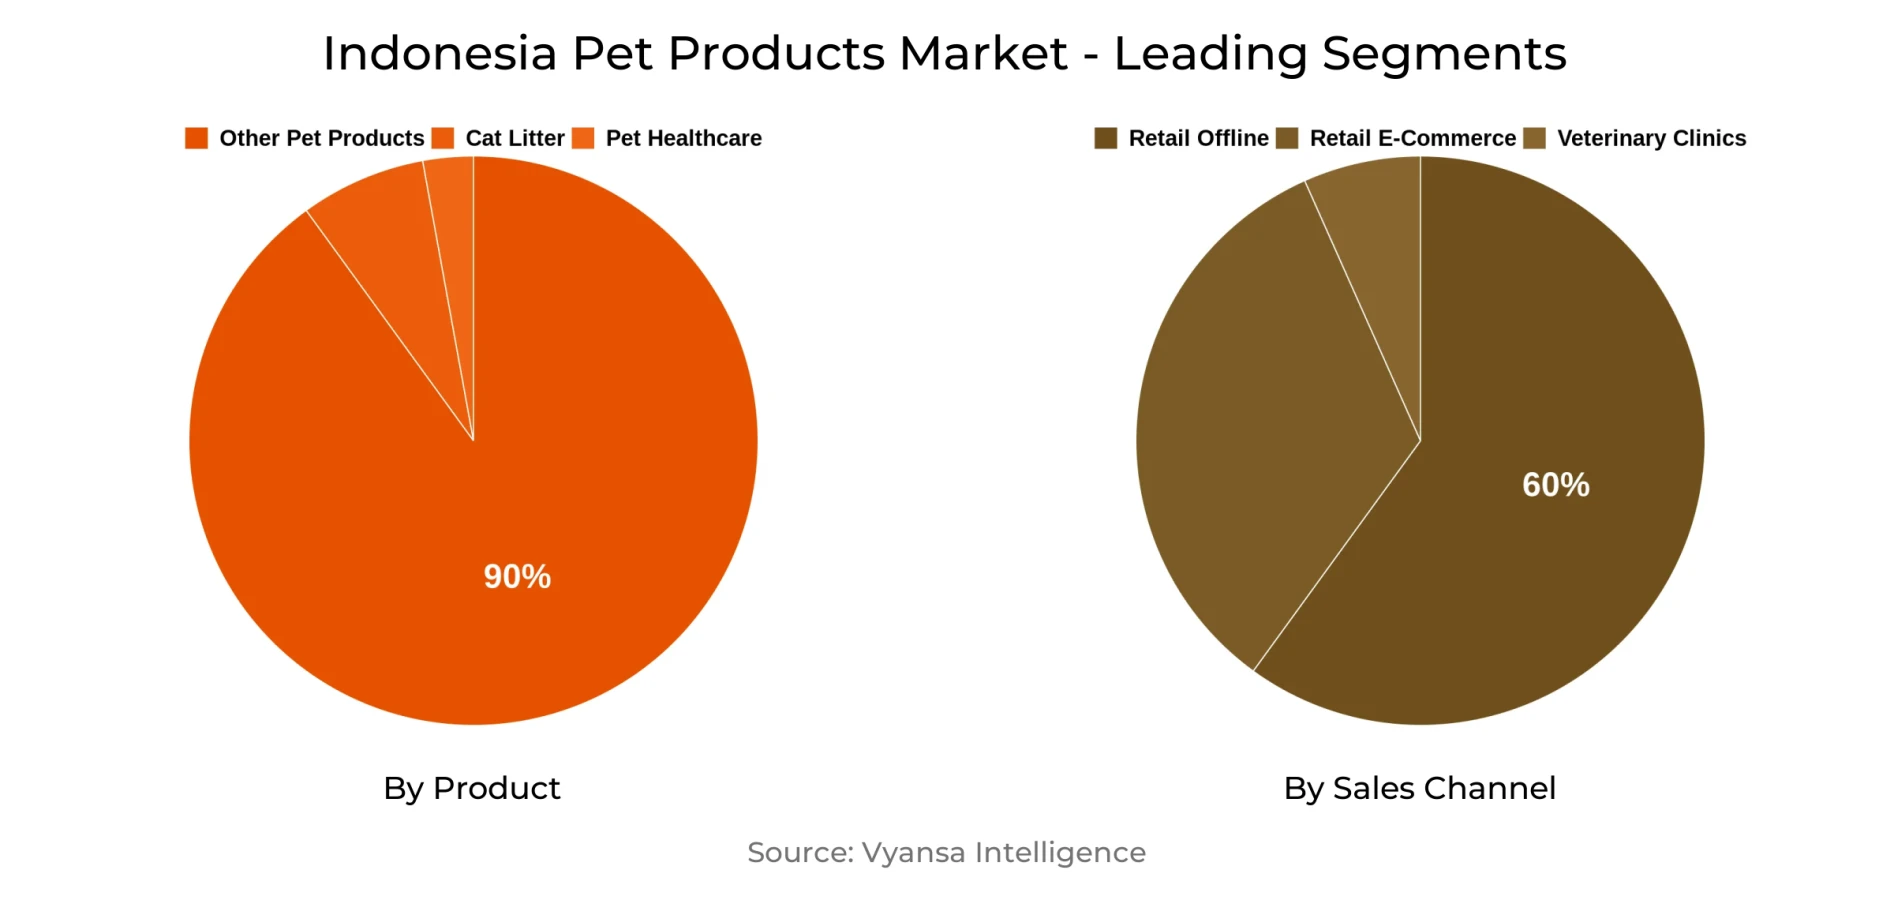
- Other Pet Products grabbed market share of 90%.
- Competition
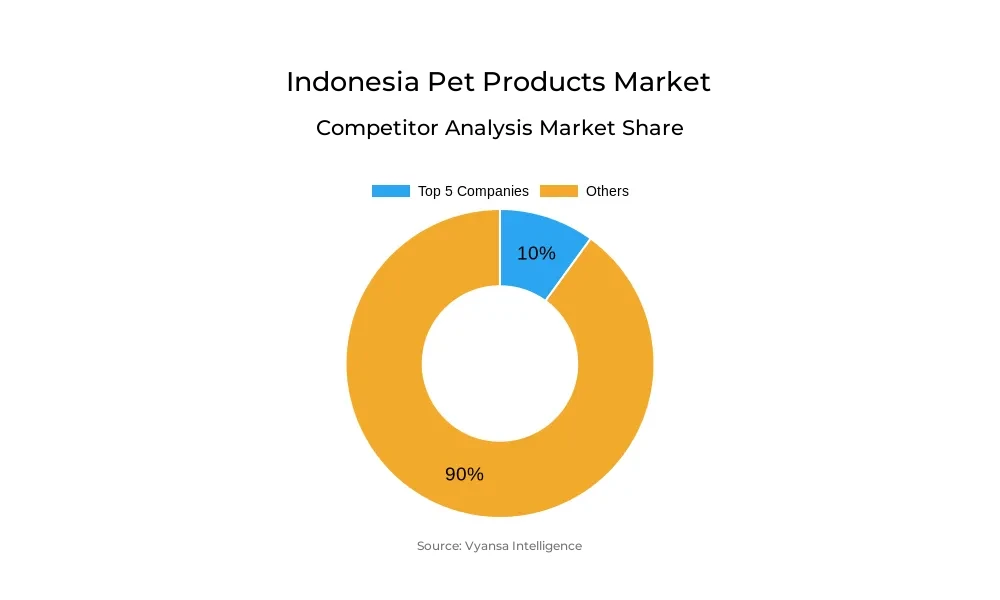
- More than 15 companies are actively engaged in producing Pet Products in Indonesia.
- Top 5 companies acquired 10% of the market share.
- Dr Josh Laboratories JM & K Pty Ltd, Mars Foods Indonesia PT, Lira Pratama CV, Espree Animal Products Inc, Hartz Mountain Corp etc., are few of the top companies.
- Sales Channel
- Retail Offline grabbed 60% of the market.
Indonesia Pet Products Market Outlook
Indonesia pet products market will sustain its steady growth between 2026 and 2032, with the size of the market rising from USD 30 million to USD 35 million. Growth is fueled by increased pet ownership, most notably cats, and ongoing pet humanisation. Cat litter continues to be the fastest-growing product because of urbanisation and a move away from backyard solutions towards commercial ones, even in the countryside. People are also more concerned with pet health and cleanliness, driving demand for health and grooming products.
Affordability will be a primary driver of purchasing decisions for consumers, particularly under uncertain economic times. Most pet owners will opt for value- and price-effective products like at-home grooming aids and utilitarian nutrition solutions that serve as healthcare too. Concurrently, pampering and premium products will still be in demand across some categories, creating a mix of value and indulgence.
The market is still very fragmented, with over five companies actively manufacturing pet products within the country. The number one company has the largest share, and the remaining part of the market is divided among different players. Affordability and convenience are driving innovation through such increases in imports and domestically manufactured economy products, especially cat litter and pet food.
Offline channels of retail lead distribution with 60% market share. Though e-commerce is on the rise, pet shops and superstores lead because of their convenience and extensive product offerings. Increasing pet-friendly areas, such as malls and parks, are also fueling higher interest in beauty and grooming products for animals.
Indonesia Pet Products Market Growth Driver
Rising health and well-being awareness among local pet owners markedly propels the pet healthcare industry. With rising knowledge among owners about their pets, there is growing popularity for low-cost anti-flea products for cats and dogs as low-cost substitutes to professional veterinary clinic services. The trend of humanisation of pet ownership fuels more frequent check-ups and vaccinations, raising consumption levels of pet healthcare offerings.
Moreover, easy access to online consultations by veterinarians via websites originally intended for human use aids pet owners in consulting experts more conveniently. This ease facilitates access to veterinary services and stokes demand for health products, driving the pet products market's consistent growth.
Indonesia Pet Products Market Trend
Innovation is transforming the market by increasing the affordability, access, and variety of goods. A good example is cat litter, where innovative, cheap imports from China and domestic production are broadening opportunities for pet owners. The innovation enables consumers across various income groups, particularly lower-middle-income households, to access products that meet their budget without compromising on quality.
Meanwhile, innovation fuels new habit adoption, such as litter tray use, underpinned by both high-end brands and lower-cost options. This increased awareness and demand for improved pet care products demonstrate how innovation is about more than just new products, but enhancing accessibility and consumer choice, making it a powerful and persistent market trend.
Unlock Market Intelligence
Explore the market potential with our data-driven report
Indonesia Pet Products Market Opportunity
In Indonesia, pet shops have started to provide grooming services through online platforms, opening up new opportunities for business expansion in the coming years. With more retail stores providing grooming without the sale of associated products, online channels can fill the gap and offer a one-stop, convenient solution to pet owners. This transition will underpin the secure place of retail e-commerce, ensuring it remains competitive within a market where customers increasingly seek simple, service-oriented transactions as opposed to product sales.
Increased pet-friendly public areas, such as malls and outdoor spaces in Jakarta and other major cities, will further spur this trend. Growing awareness among pet owners about the grooming of their pets will lead to increased demand for grooming services. Online availability of grooming services will provide extra convenience, eliminating the need to purchase grooming products independently while catering to the changing lifestyle needs of pet owners.
| Report Coverage | Details |
|---|---|
| Market Forecast | 2026-32 |
| USD Value 2025 | $ 30 Million |
| USD Value 2032 | $ 35 Million |
| CAGR 2026-2032 | 2.23% |
| Largest Category | Other Pet Products segment leads with 90% market share |
| Top Drivers | Increasing Awareness and Convenience Drive Demand for Pet Products |
| Top Trends | Innovation Drives Accessibility and Growth in the Market |
| Top Opportunities | Increasing Need for Online Grooming Services |
| Key Players | Dr Josh Laboratories JM & K Pty Ltd, Mars Foods Indonesia PT, Lira Pratama CV, Espree Animal Products Inc, Hartz Mountain Corp, Merial Ltd, Kalbe Farma Tbk PT, Espree Animal Products Inc, Hartz Mountain Corp and Others. |
Unlock Market Intelligence
Explore the market potential with our data-driven report
Indonesia Pet Products Market Segmentation Analysis
By Sales Channel
- Retail Offline
- Retail E-Commerce
- Veterinary Clinics
The Leading Segment within the sales channel is Retail Offline, holding an equal 60% market share in Indonesia Pet Products Market. Retail Offline remains dominated by the pet shop and superstore models, and these channels remain the mainstay for many vendors in the market. They now allow consumers to easily access the complete range of pet foods and accessories in decent suburban centers. The physical presence and product range in such stores provide steady customer traffic, particularly since they offer instant availability and convenience.
In the meantime, while retail e-commerce grows—largely fueled by imported goods such as cat litter and pet vitamins—offline retail still prevails. Supermarkets and hypermarkets are experiencing a reduction in pet product lines, as food retailers shift their attention to high-turnover necessities. This further reinforces the grip of pet-specialty stores in the offline channel, cementing them as the leading player in the pet products sales channel.
Top Companies in Indonesia Pet Products Market
The top companies operating in the market include Dr Josh Laboratories JM & K Pty Ltd, Mars Foods Indonesia PT, Lira Pratama CV, Espree Animal Products Inc, Hartz Mountain Corp, Merial Ltd, Kalbe Farma Tbk PT, Espree Animal Products Inc, Hartz Mountain Corp, etc., are the top players operating in the Indonesia Pet Products Market.
Frequently Asked Questions
Related Report
1. Market Segmentation
1.1. Research Scope
1.2. Research Methodology
1.3. Definitions and Assumptions
2. Executive Summary
3. Indonesia Pet Products Market Policies, Regulations, and Standards
4. Indonesia Pet Products Market Dynamics
4.1. Growth Factors
4.2. Challenges
4.3. Trends
4.4. Opportunities
5. Indonesia Pet Products Market Statistics, 2022-2032F
5.1. Market Size & Growth Outlook
5.1.1.By Revenues in US$ Million
5.2. Market Segmentation & Growth Outlook
5.2.1.By Product
5.2.1.1. Cat Litter- Market Insights and Forecast 2022-2032, USD Million
5.2.1.2. Pet Healthcare- Market Insights and Forecast 2022-2032, USD Million
5.2.1.2.1. Flea/Tick Treatments- Market Insights and Forecast 2022-2032, USD Million
5.2.1.2.2. Pet Dietary Supplements- Market Insights and Forecast 2022-2032, USD Million
5.2.1.2.3. Worming Treatments- Market Insights and Forecast 2022-2032, USD Million
5.2.1.2.4. Others- Market Insights and Forecast 2022-2032, USD Million
5.2.1.3. Other Pet Products- Market Insights and Forecast 2022-2032, USD Million
5.2.1.3.1. Beauty Products- Market Insights and Forecast 2022-2032, USD Million
5.2.1.3.2. Accessories- Market Insights and Forecast 2022-2032, USD Million
5.2.1.3.3. Others- Market Insights and Forecast 2022-2032, USD Million
5.2.2.By Sales Channel
5.2.2.1. Retail Offline- Market Insights and Forecast 2022-2032, USD Million
5.2.2.2. Retail E-Commerce- Market Insights and Forecast 2022-2032, USD Million
5.2.2.3. Veterinary Clinics- Market Insights and Forecast 2022-2032, USD Million
5.2.3.By Competitors
5.2.3.1. Competition Characteristics
5.2.3.2. Market Share & Analysis
6. Indonesia Cat Litter Products Market Statistics, 2022-2032F
6.1. Market Size & Growth Outlook
6.1.1.By Revenues in US$ Million
6.2. Market Segmentation & Growth Outlook
6.2.1.By Sales Channel- Market Insights and Forecast 2022-2032, USD Million
7. Indonesia Pet Healthcare Market Statistics, 2022-2032F
7.1. Market Size & Growth Outlook
7.1.1.By Revenues in US$ Million
7.2. Market Segmentation & Growth Outlook
7.2.1.By Product- Market Insights and Forecast 2022-2032, USD Million
7.2.2.By Sales Channel- Market Insights and Forecast 2022-2032, USD Million
8. Indonesia Other Pet Products Market Statistics, 2022-2032F
8.1. Market Size & Growth Outlook
8.1.1.By Revenues in US$ Million
8.2. Market Segmentation & Growth Outlook
8.2.1.By Product- Market Insights and Forecast 2022-2032, USD Million
8.2.2.By Sales Channel- Market Insights and Forecast 2022-2032, USD Million
9. Competitive Outlook
9.1. Company Profiles
9.1.1.Espree Animal Products Inc
9.1.1.1. Business Description
9.1.1.2. Product Portfolio
9.1.1.3. Collaborations & Alliances
9.1.1.4. Recent Developments
9.1.1.5. Financial Details
9.1.1.6. Others
9.1.2.Hartz Mountain Corp
9.1.2.1. Business Description
9.1.2.2. Product Portfolio
9.1.2.3. Collaborations & Alliances
9.1.2.4. Recent Developments
9.1.2.5. Financial Details
9.1.2.6. Others
9.1.3.Lira Pratama CV
9.1.3.1. Business Description
9.1.3.2. Product Portfolio
9.1.3.3. Collaborations & Alliances
9.1.3.4. Recent Developments
9.1.3.5. Financial Details
9.1.3.6. Others
9.1.4.Merial Ltd
9.1.4.1. Business Description
9.1.4.2. Product Portfolio
9.1.4.3. Collaborations & Alliances
9.1.4.4. Recent Developments
9.1.4.5. Financial Details
9.1.4.6. Others
9.1.5.Kalbe Farma Tbk PT
9.1.5.1. Business Description
9.1.5.2. Product Portfolio
9.1.5.3. Collaborations & Alliances
9.1.5.4. Recent Developments
9.1.5.5. Financial Details
9.1.5.6. Others
9.1.6.Dr Josh Laboratories JM & K Pty Ltd
9.1.6.1. Business Description
9.1.6.2. Product Portfolio
9.1.6.3. Collaborations & Alliances
9.1.6.4. Recent Developments
9.1.6.5. Financial Details
9.1.6.6. Others
9.1.7.Mars Foods Indonesia PT
9.1.7.1. Business Description
9.1.7.2. Product Portfolio
9.1.7.3. Collaborations & Alliances
9.1.7.4. Recent Developments
9.1.7.5. Financial Details
9.1.7.6. Others
9.1.8.Pet & Bio Co
9.1.8.1. Business Description
9.1.8.2. Product Portfolio
9.1.8.3. Collaborations & Alliances
9.1.8.4. Recent Developments
9.1.8.5. Financial Details
9.1.8.6. Others
10. Disclaimer
| Segment | Sub-Segment |
|---|---|
| By Product |
|
| By Sales Channel |
|
Research Methodology
This study followed a structured approach comprising four key phases to assess the size and scope of the electro-oxidation market. The process began with thorough secondary research to collect data on the target market, related markets, and broader industry context. These findings, along with preliminary assumptions and estimates, were then validated through extensive primary research involving industry experts from across the value chain. To calculate the overall market size, both top-down and bottom-up methodologies were employed. Finally, market segmentation and data triangulation techniques were applied to refine and validate segment-level estimations.
Secondary Research
The secondary research phase involved gathering data from a wide range of credible and published sources. This step helped in identifying industry trends, defining market segmentation, and understanding the market landscape and value chain.
Sources consulted during this phase included:
- Company annual reports, investor presentations, and press releases
- Industry white papers and certified publications
- Trade directories and market-recognized databases
- Articles from authoritative authors and reputable journals
- Gold and silver standard websites
Secondary research was critical in mapping out the industry's value chain and monetary flow, identifying key market segments, understanding regional variations, and tracking significant industry developments.
Other key sources:
- Financial disclosures
- Industry associations and trade bodies
- News outlets and business magazines
- Academic journals and research studies
- Paid industry databases
Primary Research
To validate secondary data and gain deeper market insights, primary research was conducted with key stakeholders across both the supply and demand sides of the market.
On the demand side, participants included decision-makers and influencers from end-user industries—such as CIOs, CTOs, and CSOs—who provided first-hand perspectives on market needs, product usage, and future expectations.
On the supply side, interviews were conducted with manufacturers, industry associations, and institutional participants to gather insights into current offerings, product pipelines, and market challenges.
Primary interviews provided critical inputs such as:
- Market size and revenue data
- Product and service breakdowns
- Market forecasts
- Regional and application-specific trends
Stakeholders consulted included:
- Leading OEM and solution providers
- Channel and distribution partners
- End users across various applications
- Independent consultants and industry specialists
Market Size Estimation and Data Triangulation
- Identifying Key Market Participants (Secondary Research)
- Goal: To identify the major players or companies in the target market. This typically involves using publicly available data sources such as industry reports, market research publications, and financial statements of companies.
- Tools: Reports from firms like Gartner, Forrester, Euromonitor, Statista, IBISWorld, and others. Public financial statements, news articles, and press releases from top market players.
- Extracting Earnings of Key Market Participants
- Goal: To estimate the earnings generated from the product or service being analyzed. This step helps in understanding the revenue potential of each market player in a specific geography.
- Methods: Earnings data can be gathered from:
- Publicly available financial reports (for listed companies).
- Interviews and primary data sources from professionals, such as Directors, VPs, SVPs, etc. This is especially useful for understanding more nuanced, internal data that isn't publicly disclosed.
- Annual reports and investor presentations of key players.
- Data Collation and Development of a Relevant Data Model
- Goal: To collate inputs from both primary and secondary sources into a structured, data-driven model for market estimation. This model will incorporate key market KPIs and any independent variables relevant to the market.
- Key KPIs: These could include:
- Market size, growth rate, and demand drivers.
- Industry-specific metrics like market share, average revenue per customer (ARPC), or average deal size.
- External variables, such as economic growth rates, inflation rates, or commodity prices, that could affect the market.
- Data Modeling: Based on this data, the market forecasts are developed for the next 5 years. A combination of trend analysis, scenario modeling, and statistical regression might be used to generate projections.
- Scenario Analysis
- Goal: To test different assumptions and validate how sensitive the market is to changes in key variables (e.g., market demand, regulatory changes, technological disruptions).
- Types of Scenarios:
- Base Case: Based on current assumptions and historical data.
- Best-Case Scenario: Assuming favorable market conditions, regulatory environments, and technological advancements.
- Worst-Case Scenario: Accounting for adverse factors, such as economic downturns, stricter regulations, or unexpected disruptions.


