Indonesia Energy Drink Market Report: Trends, Growth and Forecast (2025-2030)
By Product Type (Alcoholic, Non-Alcoholic), By Consumption (Drinks, Shots, Mixers), By Nature (Conventional, Natural/Organic), By Flavour (Flavoured, Unflavoured), By Packaging (Bottles, Metal Cans, Pouches, Others), By Packaging Size (Small, Medium, Large), By End Users (Teenagers, Adults, Geriatric), By Sales Channel (On-Trade, Off-Trade) ... Read more
|
Major Players
|
Indonesia Energy Drink Market Statistics, 2025
- Market Size Statistics
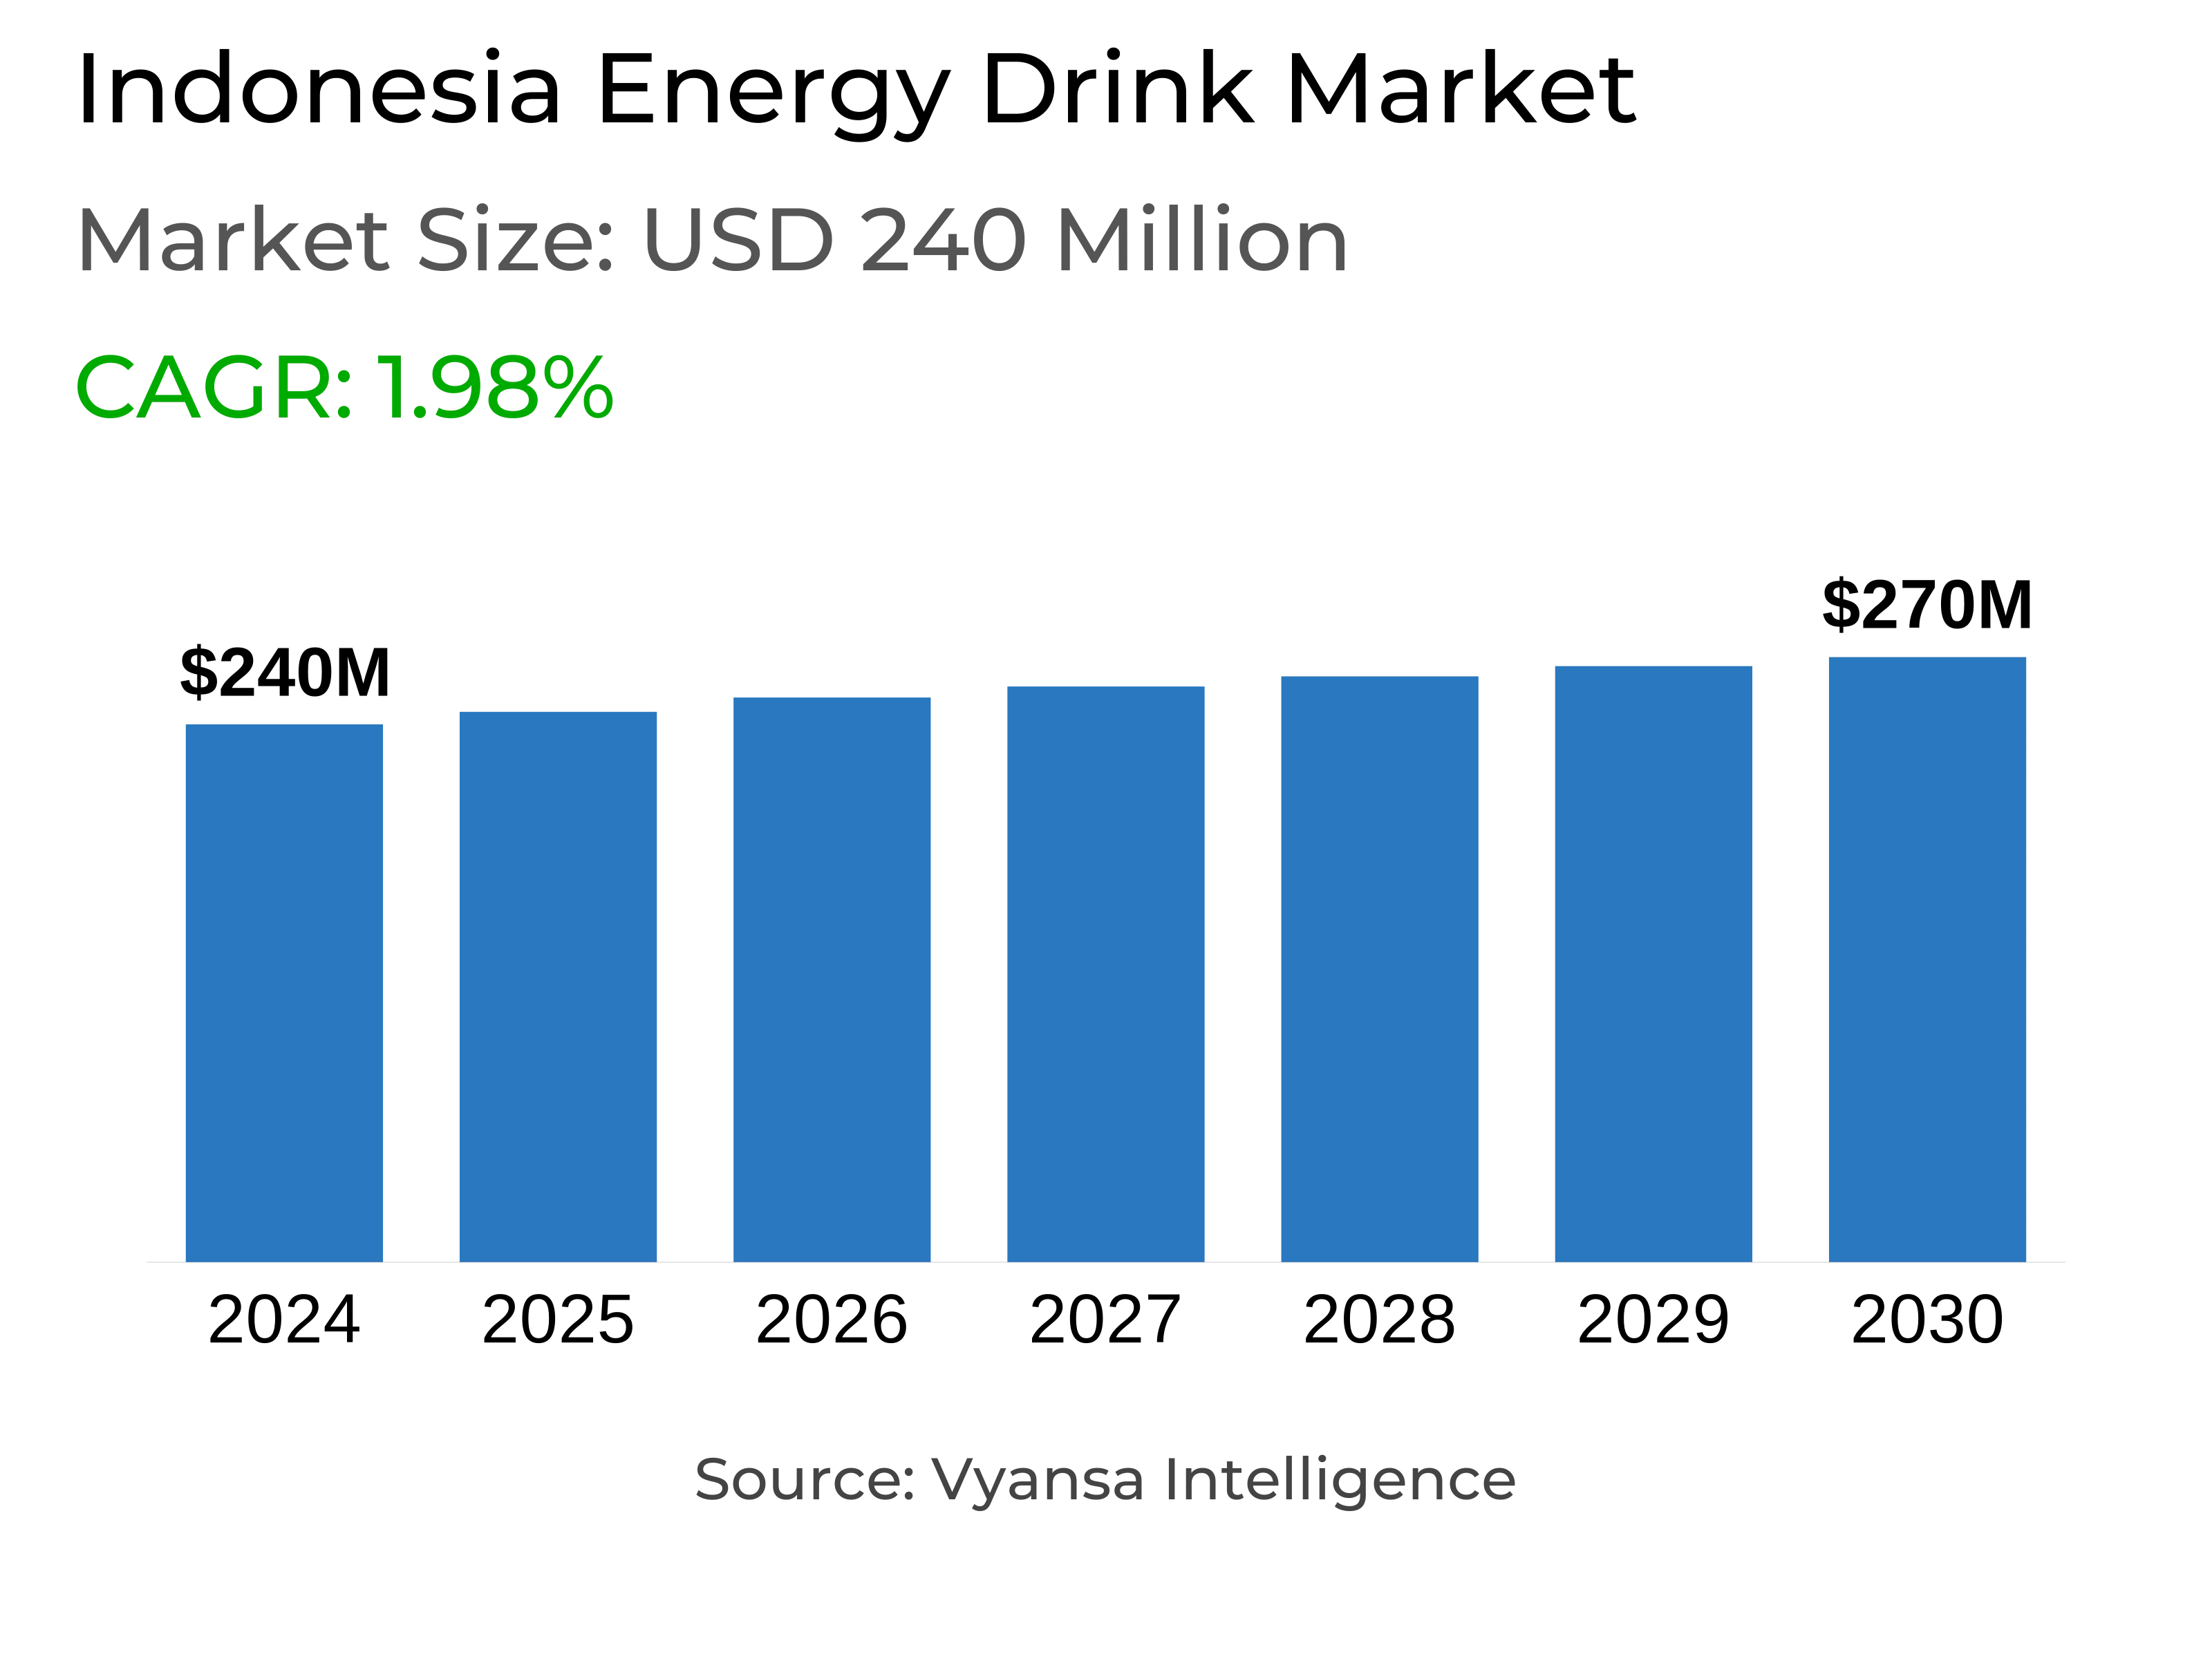
- Energy Drink in Indonesia is estimated at $ 240 Million.
- The market size is expected to grow to $ 270 Million by 2030.
- Market to register a CAGR of around 1.98% during 2025-30.
- Product Shares
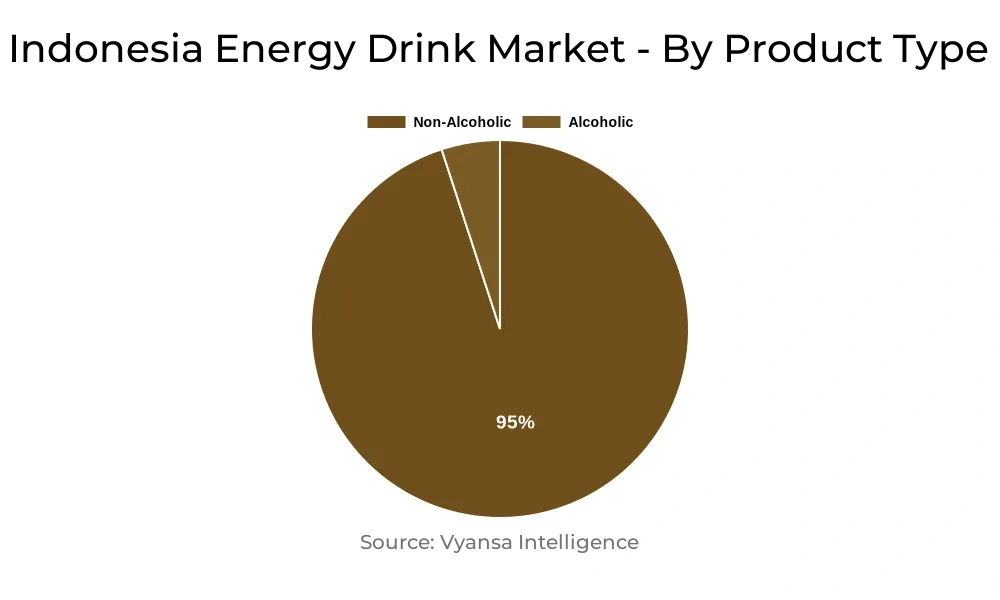
- Non Alcoholic Energy Drinks grabbed market share of 95%.
- Non Alcoholic Energy Drinks to witness a volume CAGR of around 1.12%.
- Competition
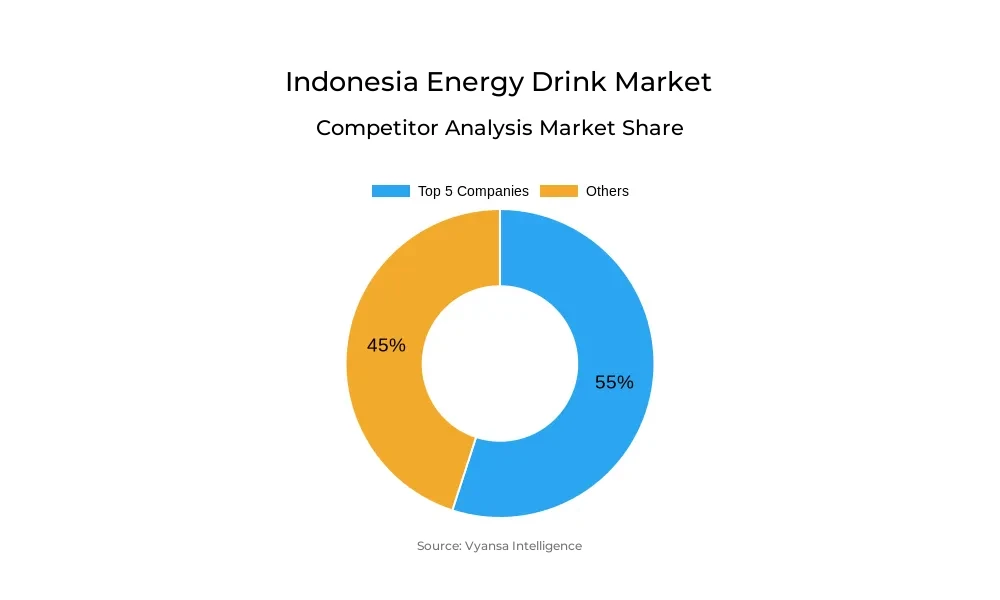
- More than 10 companies are actively engaged in producing Energy Drink in Indonesia.
- Top 5 companies acquired 55% of the market share.
- Tirta Alam Segar PT, PT. Kino Indonesia Tbk, PT Tempo Scan Pacific Tbk, Asia Health Energi Beverages PT, Osotspa Co Ltd etc., are few of the top companies.
- Sales Channel
- Off-Trade grabbed 65% of the market.
Indonesia Energy Drink Market Outlook
Indonesia energy drinks market is poised to register steady growth in 2025–30, with increasing availability of value-for-money formats and a committed consumer base. Off-trade volume sales will remain predominant, with the fame of cup packaging at IDR1,000 influencing consumption among price-sensitive buyers such as teenagers and blue-collar workers. Such brands as Panther and Power F should continue to pick up momentum, putting themselves not just as energy pickups but also as cheap thirst quenchers. This makes them compete with RTD tea and juice beverages, particularly when stock shortages of competing categories occur.
In spite of competition from other RTD drinks like coffee and on-trade alternatives, brands will continue to pump more promotional activity. Convenience store cut-price promotions and excitement through event sponsorship and participative online campaigns will be the main tactics to keep consumers excited. Glass bottle and can formats will remain in vogue in contemporary retail, backed by bundled promotion, while cup packaging will drive sales in traditional retail because it is so cheap.
Health awareness could become a challenge as consumers become increasingly cautious of high sugar and caffeine levels. To address this, manufacturers are likely to use more health-oriented communications and appeal to larger audiences via social media. Although the original consumer base—laboring males—will remain driving demand, companies will also have to reach out to youth and urban segments through customized advertising.
E-commerce, while still a niche play, will expand via bulk purchases and special promotions on sites such as Shopee and Tokopedia. Nevertheless, physical retailing will continue to dominate because purchasing energy drinks is impulse-driven. In total, cup packaging will be the key growth driver, aided by its price sensibility and mass-appeal.
Indonesia Energy Drink Market Growth Driver
The energy drinks industry is set to see moderate growth in 2025-30 with positive volume sales in both on-trade and off-trade. The category remains sustained by physically active adult males in occupations such as agriculture, construction, and long-distance driving that use energy drinks for their energizing impact. But growth is likely to decelerate compared to the last five years because of consumers' rising health concerns.
In an attempt to overcome this, producers are targeting improvements in product image through propagating health-driven messages and leveraging digital means, particularly social media. Major players are also concentrating on broadening their scope to reach beyond the conventional consumer groups. For example, Kino Indonesia has reached out to college students and new graduates through its Panther brand, while Oronamin C targets Millennials, office workers, and homemakers. Albeit, however, the core demand will most probably still be from lower-income adult males.
Indonesia Energy Drink Market Trend
Brands like Panther and Power F have become strongly established, primarily because they have been repositioned as general thirst quenchers, and not drinks for energy restoration per se. This realignment has altered consumer perception, particularly among young adults, who drink these beverages increasingly for their sweetness and price point and less for functional reasons. As such, energy drinks are integrating into daily lives and not being confined to periods of physical activity or exhaustion.
This trend has consolidated the position of energy drinks packaged in cups in the market. The products now compete head-on with ready-to-drink (RTD) tea products like Teh Gelas and Teh Rio, and juice drinks like Ale-Ale. When the RTD tea brands are running short of stocks or have distribution problems, energy drinks packaged in cups are usually selected as convenient alternatives, increasing their presence in the market further.
Unlock Market Intelligence
Explore the market potential with our data-driven report
| Report Coverage | Details |
|---|---|
| Market Forecast | 2025-30 |
| USD Value 2024 | $ 240 Million |
| USD Value 2030 | $ 270 Million |
| CAGR 2025-2030 | 1.98% |
| Largest Category | Non Alcoholic Energy Drinks segment leads with 95% market share |
| Top Drivers | Expanding Consumer Base Amid Changing Preferences |
| Top Trends | Repositioning Energy Drinks as Everyday Refreshers |
| Key Players | Tirta Alam Segar PT, PT. Kino Indonesia Tbk, PT Tempo Scan Pacific Tbk, Asia Health Energi Beverages PT, Osotspa Co Ltd, Sido Muncul PT, Sinde Budi Sentosa PT, T.C. Pharmaceutical Industries Co. Ltd, PT Wings Surya, PT Bintang Toedjoe and Others. |
Unlock Market Intelligence
Explore the market potential with our data-driven report
Indonesia Energy Drink Market Segmentation Analysis
The largest market share is under the sales channel in the segment Off-Trade, encompassing modern retail outlets and online shopping. Among these, retail offline—particularly convenience stores—is leading, with the help of value-cut promotions for the benefit of lower-middle-income consumers. Energy drinks packaged in glass and metal cans are most typically promoted using price discounts to appeal to consumers who have ready access to options such as fresh drinks from foodservice establishments. These promotions play a vital role in ensuring consumer loyalty in the intensely competitive market.
Within the larger off-trade category, e-commerce websites such as Shopee and Tokopedia are increasingly popular, but especially so through events like buy-one-get-one-free offers. Nonetheless, e-commerce still ranks lower than bricks-and-mortar because energy drinks tend to be spontaneous purchases. Conversely, the On-Trade channel is underdeveloped, with low-cost powder concentrate products such as Extra Joss and Kuku Bima being prevalent because they have long been popular among street vendors and street stalls.
Top Companies in Indonesia Energy Drink Market
The top companies operating in the market include Tirta Alam Segar PT, PT. Kino Indonesia Tbk, PT Tempo Scan Pacific Tbk, Asia Health Energi Beverages PT, Osotspa Co Ltd, Sido Muncul PT, Sinde Budi Sentosa PT, T.C. Pharmaceutical Industries Co. Ltd, PT Wings Surya, PT Bintang Toedjoe, etc., are the top players operating in the Indonesia Energy Drink Market.
Frequently Asked Questions
Related Report
1. Market Segmentation
1.1. Research Scope
1.2. Research Methodology
1.3. Definitions and Assumptions
2. Executive Summary
3. Indonesia Energy Drinks Market Policies, Regulations, and Standards
4. Indonesia Energy Drinks Market Dynamics
4.1. Growth Factors
4.2. Challenges
4.3. Trends
4.4. Opportunities
5. Indonesia Energy Drinks Market Statistics, 2020-2030F
5.1. Market Size & Growth Outlook
5.1.1.By Revenues in US$ Million
5.1.2.By Quantity Sold (Million Liters)
5.2. Market Segmentation & Growth Outlook
5.2.1.By Product Type
5.2.1.1. Alcoholic- Market Insights and Forecast 2020-2030, USD Million
5.2.1.2. Non-Alcoholic- Market Insights and Forecast 2020-2030, USD Million
5.2.2.By Consumption
5.2.2.1. Drinks- Market Insights and Forecast 2020-2030, USD Million
5.2.2.2. Shots- Market Insights and Forecast 2020-2030, USD Million
5.2.2.3. Mixers- Market Insights and Forecast 2020-2030, USD Million
5.2.3.By Nature
5.2.3.1. Conventional- Market Insights and Forecast 2020-2030, USD Million
5.2.3.2. Natural/Organic- Market Insights and Forecast 2020-2030, USD Million
5.2.4.By Flavour
5.2.4.1. Flavoured- Market Insights and Forecast 2020-2030, USD Million
5.2.4.2. Unflavoured- Market Insights and Forecast 2020-2030, USD Million
5.2.5.By Packaging
5.2.5.1. Bottles- Market Insights and Forecast 2020-2030, USD Million
5.2.5.1.1. PET Bottles- Market Insights and Forecast 2020-2030, USD Million
5.2.5.1.2. Glass Bottles- Market Insights and Forecast 2020-2030, USD Million
5.2.5.2. Metal Cans- Market Insights and Forecast 2020-2030, USD Million
5.2.5.3. Pouches- Market Insights and Forecast 2020-2030, USD Million
5.2.5.4. Others- Market Insights and Forecast 2020-2030, USD Million
5.2.6.By Packaging Size
5.2.6.1. Small- Market Insights and Forecast 2020-2030, USD Million
5.2.6.2. Medium- Market Insights and Forecast 2020-2030, USD Million
5.2.6.3. Large- Market Insights and Forecast 2020-2030, USD Million
5.2.7.By End Users
5.2.7.1. Teenagers- Market Insights and Forecast 2020-2030, USD Million
5.2.7.2. Adults- Market Insights and Forecast 2020-2030, USD Million
5.2.7.3. Geriatric- Market Insights and Forecast 2020-2030, USD Million
5.2.8.By Sales Channel
5.2.8.1. On-Trade- Market Insights and Forecast 2020-2030, USD Million
5.2.8.2. Off-Trade- Market Insights and Forecast 2020-2030, USD Million
5.2.9.By Competitors
5.2.9.1. Competition Characteristics
5.2.9.2. Market Share & Analysis
6. Indonesia Alcoholic Energy Drinks Market Outlook, 2020-2030F
6.1. Market Size & Growth Outlook
6.1.1.By Revenues in US$ Million
6.1.2.By Quantity Sold (Million Liters)
6.2. Market Segmentation & Growth Outlook
6.2.1.By Consumption- Market Insights and Forecast 2020-2030, USD Million
6.2.2.By Nature- Market Insights and Forecast 2020-2030, USD Million
6.2.3.By Flavour- Market Insights and Forecast 2020-2030, USD Million
6.2.4.By Packaging- Market Insights and Forecast 2020-2030, USD Million
6.2.5.By Packaging Size- Market Insights and Forecast 2020-2030, USD Million
6.2.6.By End Users- Market Insights and Forecast 2020-2030, USD Million
6.2.7.By Sales Channel- Market Insights and Forecast 2020-2030, USD Million
7. Indonesia Non-Alcoholic Energy Drinks Market Outlook, 2020-2030F
7.1. Market Size & Growth Outlook
7.1.1.By Revenues in US$ Million
7.1.2.By Quantity Sold (Million Liters)
7.2. Market Segmentation & Growth Outlook
7.2.1.By Consumption- Market Insights and Forecast 2020-2030, USD Million
7.2.2.By Nature- Market Insights and Forecast 2020-2030, USD Million
7.2.3.By Flavour- Market Insights and Forecast 2020-2030, USD Million
7.2.4.By Packaging- Market Insights and Forecast 2020-2030, USD Million
7.2.5.By Packaging Size- Market Insights and Forecast 2020-2030, USD Million
7.2.6.By End Users- Market Insights and Forecast 2020-2030, USD Million
7.2.7.By Sales Channel- Market Insights and Forecast 2020-2030, USD Million
8. Competitive Outlook
8.1. Company Profiles
8.1.1.Asia Health Energi Beverages PT
8.1.1.1. Business Description
8.1.1.2. Product Portfolio
8.1.1.3. Collaborations & Alliances
8.1.1.4. Recent Developments
8.1.1.5. Financial Details
8.1.1.6. Others
8.1.2.Osotspa Co Ltd
8.1.2.1. Business Description
8.1.2.2. Product Portfolio
8.1.2.3. Collaborations & Alliances
8.1.2.4. Recent Developments
8.1.2.5. Financial Details
8.1.2.6. Others
8.1.3.Tirta Alam Segar PT
8.1.3.1. Business Description
8.1.3.2. Product Portfolio
8.1.3.3. Collaborations & Alliances
8.1.3.4. Recent Developments
8.1.3.5. Financial Details
8.1.3.6. Others
8.1.4.PT. Kino Indonesia Tbk
8.1.4.1. Business Description
8.1.4.2. Product Portfolio
8.1.4.3. Collaborations & Alliances
8.1.4.4. Recent Developments
8.1.4.5. Financial Details
8.1.4.6. Others
8.1.5.PT Tempo Scan Pacific Tbk
8.1.5.1. Business Description
8.1.5.2. Product Portfolio
8.1.5.3. Collaborations & Alliances
8.1.5.4. Recent Developments
8.1.5.5. Financial Details
8.1.5.6. Others
8.1.6.Sinde Budi Sentosa PT
8.1.6.1. Business Description
8.1.6.2. Product Portfolio
8.1.6.3. Collaborations & Alliances
8.1.6.4. Recent Developments
8.1.6.5. Financial Details
8.1.6.6. Others
8.1.7.Sido Muncul PT
8.1.7.1. Business Description
8.1.7.2. Product Portfolio
8.1.7.3. Collaborations & Alliances
8.1.7.4. Recent Developments
8.1.7.5. Financial Details
8.1.7.6. Others
8.1.8.T.C. Pharmaceutical Industries Co. Ltd
8.1.8.1. Business Description
8.1.8.2. Product Portfolio
8.1.8.3. Collaborations & Alliances
8.1.8.4. Recent Developments
8.1.8.5. Financial Details
8.1.8.6. Others
8.1.9.PT Wings Surya
8.1.9.1. Business Description
8.1.9.2. Product Portfolio
8.1.9.3. Collaborations & Alliances
8.1.9.4. Recent Developments
8.1.9.5. Financial Details
8.1.9.6. Others
8.1.10. PT Bintang Toedjoe
8.1.10.1. Business Description
8.1.10.2. Product Portfolio
8.1.10.3. Collaborations & Alliances
8.1.10.4. Recent Developments
8.1.10.5. Financial Details
8.1.10.6. Others
9. Disclaimer
| Segment | Sub-Segment |
|---|---|
| By Product Type |
|
| By Consumption |
|
| By Nature |
|
| By Flavour |
|
| By Packaging |
|
| By Packaging Size |
|
| By End Users |
|
| By Sales Channel |
|
Research Methodology
This study followed a structured approach comprising four key phases to assess the size and scope of the electro-oxidation market. The process began with thorough secondary research to collect data on the target market, related markets, and broader industry context. These findings, along with preliminary assumptions and estimates, were then validated through extensive primary research involving industry experts from across the value chain. To calculate the overall market size, both top-down and bottom-up methodologies were employed. Finally, market segmentation and data triangulation techniques were applied to refine and validate segment-level estimations.
Secondary Research
The secondary research phase involved gathering data from a wide range of credible and published sources. This step helped in identifying industry trends, defining market segmentation, and understanding the market landscape and value chain.
Sources consulted during this phase included:
- Company annual reports, investor presentations, and press releases
- Industry white papers and certified publications
- Trade directories and market-recognized databases
- Articles from authoritative authors and reputable journals
- Gold and silver standard websites
Secondary research was critical in mapping out the industry's value chain and monetary flow, identifying key market segments, understanding regional variations, and tracking significant industry developments.
Other key sources:
- Financial disclosures
- Industry associations and trade bodies
- News outlets and business magazines
- Academic journals and research studies
- Paid industry databases
Primary Research
To validate secondary data and gain deeper market insights, primary research was conducted with key stakeholders across both the supply and demand sides of the market.
On the demand side, participants included decision-makers and influencers from end-user industries—such as CIOs, CTOs, and CSOs—who provided first-hand perspectives on market needs, product usage, and future expectations.
On the supply side, interviews were conducted with manufacturers, industry associations, and institutional participants to gather insights into current offerings, product pipelines, and market challenges.
Primary interviews provided critical inputs such as:
- Market size and revenue data
- Product and service breakdowns
- Market forecasts
- Regional and application-specific trends
Stakeholders consulted included:
- Leading OEM and solution providers
- Channel and distribution partners
- End users across various applications
- Independent consultants and industry specialists
Market Size Estimation and Data Triangulation
- Identifying Key Market Participants (Secondary Research)
- Goal: To identify the major players or companies in the target market. This typically involves using publicly available data sources such as industry reports, market research publications, and financial statements of companies.
- Tools: Reports from firms like Gartner, Forrester, Euromonitor, Statista, IBISWorld, and others. Public financial statements, news articles, and press releases from top market players.
- Extracting Earnings of Key Market Participants
- Goal: To estimate the earnings generated from the product or service being analyzed. This step helps in understanding the revenue potential of each market player in a specific geography.
- Methods: Earnings data can be gathered from:
- Publicly available financial reports (for listed companies).
- Interviews and primary data sources from professionals, such as Directors, VPs, SVPs, etc. This is especially useful for understanding more nuanced, internal data that isn't publicly disclosed.
- Annual reports and investor presentations of key players.
- Data Collation and Development of a Relevant Data Model
- Goal: To collate inputs from both primary and secondary sources into a structured, data-driven model for market estimation. This model will incorporate key market KPIs and any independent variables relevant to the market.
- Key KPIs: These could include:
- Market size, growth rate, and demand drivers.
- Industry-specific metrics like market share, average revenue per customer (ARPC), or average deal size.
- External variables, such as economic growth rates, inflation rates, or commodity prices, that could affect the market.
- Data Modeling: Based on this data, the market forecasts are developed for the next 5 years. A combination of trend analysis, scenario modeling, and statistical regression might be used to generate projections.
- Scenario Analysis
- Goal: To test different assumptions and validate how sensitive the market is to changes in key variables (e.g., market demand, regulatory changes, technological disruptions).
- Types of Scenarios:
- Base Case: Based on current assumptions and historical data.
- Best-Case Scenario: Assuming favorable market conditions, regulatory environments, and technological advancements.
- Worst-Case Scenario: Accounting for adverse factors, such as economic downturns, stricter regulations, or unexpected disruptions.


