Indonesia Cards and Payments Market Report: Trends, Growth and Forecast (2026-2032)
By Instrument Type (Cards (Debit Card, Charge Card, ATM Card, Pre-Paid Card, Credit Card, Store Card), Mobile Wallets, Cheques, Others), By Card Type (Contact Smart Card, Contactless Smart Card, Non-Smart Card), By Type of Payments (B2B, B2C, C2C, C2B (E-commerce Shopping, Payment at POS Terminals)), By Transaction Type (Domestic, Foreign), By Application (Food & Groceries, Health & Pharmacies, Travel & Tourism, Hospitality, Others (Media & Entertainment)) ... Read more

|
Major Players
|
Indonesia Cards and Payments Market Statistics and Insights, 2026
- Market Size Statistics
- Cards and Payments in Indonesia is estimated at $ 441.24 Billion.
- The market size is expected to grow to $ 483.7 Billion by 2032.
- Market to register a CAGR of around 1.32% during 2026-32.
- Instrument Type Shares
- Cards grabbed market share of 80%.
- Cards to witness a volume CAGR of around 1.93%.
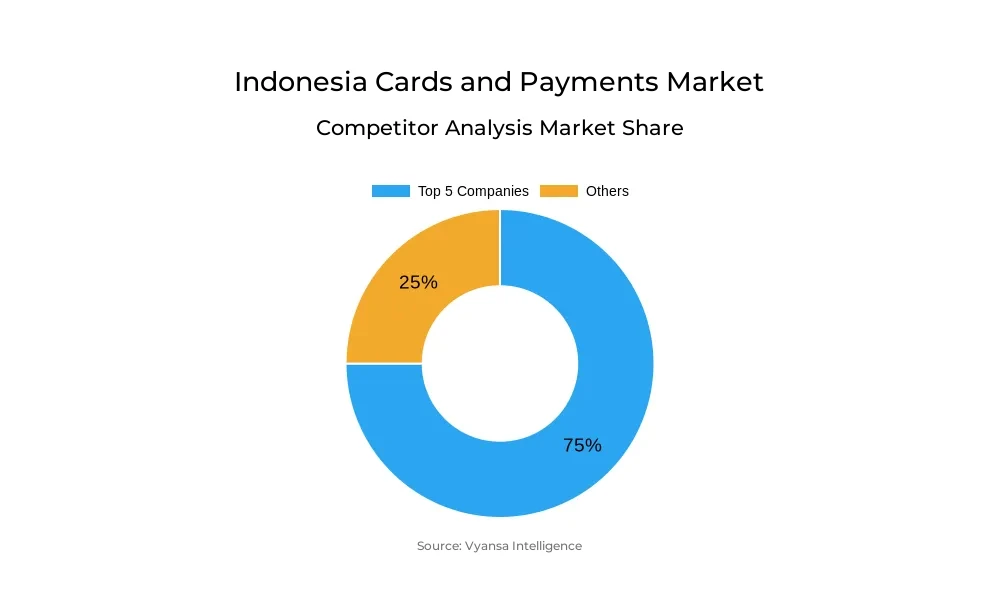
- Competition
- More than 10 companies are actively engaged in producing Cards and Payments in Indonesia.
- Top 5 companies acquired 75% of the market share.
- Bank Danamon Indonesia Tbk PT, Bank Mega Tbk PT, Bank UOB Indonesia PT, Bank Central Asia Tbk PT, Bank Mandiri (Persero) Tbk PT etc., are few of the top companies.
- Card Type
- Contact Smart Card grabbed 52% of the market.
Indonesia Cards and Payments Market Outlook
The Indonesia payments and cards market, worth USD 441.24 billion, is projected to expand to USD 483.7 billion in 2032, while ATM cards post a volume CAGR of approximately 1.93%. Expansion will persist but at a diminishing rate, as end users move away from traditional card products to digital wallets, QRIS-based transactions, and mobile-first products. Contact smart cards, which dominated the market with a share of 52%, are still prevalent in use but will increasingly be incorporated into digital ecosystems.
One of the strongest catalysts for change is smartphone usage pervasiveness and Indonesians' high comfort level in making online and offline transactions through apps. Online marketplaces such as Shopee, Tokopedia, and Grab, as well as QRIS payments in conventional markets, will continue to drive electronic payments. Alongside this, the use of debit cards is also likely to fall since digital wallets, with the flexibility and convenience of features like pay-later and direct linking of bank accounts, provide greater ease.
Banks are heavily investing in digital transformation to stay at par with fintech competition. New products like digital credit cards, contactless debit cards, and superapps like Livin' by Mandiri and Wondr by BNI are transforming end user behavior. Loyalty programs, cashback promotions, and instalment plans are still valuable customer retention tools. For business users, offerings like Qlola by BRI are widening digital banking offerings.
In the future, physical cards will not vanish but will have a lesser place in comparison with mobile-based payments. The emphasis will be on virtual cards, app payments, and embedded financial systems. These technologies along with evolving end user behavior will make steady market growth possible while positioning Indonesia solidly towards a digital-first payments landscape by 2032.
Indonesia Cards and Payments Market Growth Driver
High Smartphone Penetration and Mobile Banking Adoption
High smartphone penetration and high mobile banking adoption are the main growth drivers for Indonesia cards and payments market. End users increasingly rely on digital wallets, mobile banking apps, and QRIS payments for day-to-day transactions, which has accelerated the move toward electronic payments. The technologies enable payments to be faster, more convenient, and available in both urban and rural regions, facilitating greater financial inclusion.
The growth of mobile-first payment solutions is also affecting the payments ecosystem overall. As debit card usage increases at a slower pace, the convenience of reloading digital wallets, making QRIS transactions, and maintaining accounts using smartphones drives end users to embrace cashless options. This reflects the role of technology uptake and mobile penetration in the transformation of Indonesian payments, as both end user behavior and market growth are projected to be shaped by these factors in the next few years.
Indonesia Cards and Payments Market Trend
Expansion of QRIS Payments into Traditional Retail
In Indonesia, QRIS payments are being more widely used in both modern retail and traditional segments, such as street stalls and kiosks. End users are favoring this payment method due to its convenience, which is boosting the growth of QRIS transactions against last year. Widespread smartphone usage means that users can reload their digital wallets using mobile banking apps or directly link them to savings accounts, accelerating payment and streamlining it.
Aside from daily transactions, QRIS is also taking up e-commerce payments via pay-later facilities, demonstrating a change in end user behavior towards digital-first payment products. Traditional bank transfer continues to be popular, but the ease, velocity, and convenience of QRIS are prompting Indonesians to shift from cash to electronic payments, pointing to a remarkable change in how end users deal and carry out transactions in retail settings.
Unlock Market Intelligence
Explore the market potential with our data-driven report
Indonesia Cards and Payments Market Opportunity
Transition away from Physical Cards to Digital-First and Virtual Products
Indonesia is witnessing an unmistakable shift from physical cards to more electronic transactions. Debit card use will taper off, with end users turning more towards mobile phones and virtual payment methods for routine transactions. Banks are embracing digital-first approaches, with rewards of the form of discount, instalment plans, and cashbacks to push popularity and enhance customer retention.
This shift creates room for virtual cards and mobile-driven payment features to become widespread across deposits, withdrawals, purchases, and even loans. As end users become increasingly accustomed to digital solutions, dependency on traditional physical cards will further decline. This shift to virtual solutions presents a key opportunity for providers to innovate new features, simplify user experiences, and make digital-first offerings the go-to choice for Indonesia's changing financial landscape.
Unlock Market Intelligence
Explore the market potential with our data-driven report
Indonesia Cards and Payments Market Segmentation Analysis

By Instrument Type
- Cards
- Mobile Wallets
- Cheques
- Others
The segment with the ighest market share under the Instrument Type is Cards, and it commands almost 80% of Indonesia cards and payments market. Their leadership is a testament to the historical adoption of debit-linked cards as a dominant payment and cash withdrawal instrument, particularly by the banked. The extensive coverage of ATMs nationwide and connection with mobile banking applications also helps sustain this position. Although mobile wallets and QRIS transactions are growing fast, cards still remain at the core of end user payment behavior.
In the future, Cards are expected to post a volume CAGR of approximately 1.93%, growing consistently but at a slower rate than digital substitutes. With banks making investments in digitalization, such as contactless debit and virtual card functionality, ATM cards will continue to have utility but will increasingly incorporate additional digital capabilities to match changing end user demands.
By Card Type
- Contact Smart Card
- Contactless Smart Card
- Non-Smart Card
The segment with the ighest market share under the Card Type is Contact Smart Cards, which commanded about 52% of the market. Their dominance is fueled by the increasing use of contactless-capable debit and credit cards launched by prominent Indonesian banks, offering safety and convenience in everyday transactions. Increased growth in public transport ticketing upgrades and QRIS integration within retail has also promoted broader use of contact smart cards.
Throughout the forecast period, contact smart cards will be the most prevalent card type, enjoying end users familiarity with tap-to-pay functionality and robust merchant acceptance. Mobile wallets and virtual payment solutions are growing rapidly, but physical smart cards are still important, particularly for in-store transactions. Ongoing innovations, including connecting contactless cards to mobile superapps such as Livin by Mandiri and Wondr by BNI, will continue to bolster their market share.
Top Companies in Indonesia Cards and Payments Market
The top companies operating in the market include Bank Danamon Indonesia Tbk PT, Bank Mega Tbk PT, Bank UOB Indonesia PT, Bank Central Asia Tbk PT, Bank Mandiri (Persero) Tbk PT, Bank Rakyat Indonesia (Persero) Tbk PT, Bank Negara Indonesia (Persero) Tbk PT, Bank CIMB Niaga Tbk PT, HSBC Holdings Plc, Maybank Indonesia Tbk PT, etc., are the top players operating in the Indonesia Cards and Payments Market.
Frequently Asked Questions
Related Report
1. Market Segmentation
1.1. Research Scope
1.2. Research Methodology
1.3. Definitions and Assumptions
2. Executive Summary
3. Indonesia Cards and Payments Market Policies, Regulations, and Standards
4. Indonesia Cards and Payments Market Dynamics
4.1. Growth Factors
4.2. Challenges
4.3. Trends
4.4. Opportunities
5. Indonesia Cards and Payments Market Statistics, 2022-2032F
5.1. Market Size & Growth Outlook
5.1.1. By Revenues in US$ Million
5.2. Market Segmentation & Growth Outlook
5.2.1. By Instrument Type
5.2.1.1. Cards- Market Insights and Forecast 2022-2032, USD Million
5.2.1.1.1. Debit Card- Market Insights and Forecast 2022-2032, USD Million
5.2.1.1.2. Charge Card- Market Insights and Forecast 2022-2032, USD Million
5.2.1.1.3. ATM Card- Market Insights and Forecast 2022-2032, USD Million
5.2.1.1.4. Pre-Paid Card- Market Insights and Forecast 2022-2032, USD Million
5.2.1.1.5. Credit Card- Market Insights and Forecast 2022-2032, USD Million
5.2.1.1.6. Store Card- Market Insights and Forecast 2022-2032, USD Million
5.2.1.2. Mobile Wallets- Market Insights and Forecast 2022-2032, USD Million
5.2.1.3. Cheques- Market Insights and Forecast 2022-2032, USD Million
5.2.1.4. Others- Market Insights and Forecast 2022-2032, USD Million
5.2.2. By Card Type
5.2.2.1. Contact Smart Card- Market Insights and Forecast 2022-2032, USD Million
5.2.2.2. Contactless Smart Card- Market Insights and Forecast 2022-2032, USD Million
5.2.2.3. Non-Smart Card- Market Insights and Forecast 2022-2032, USD Million
5.2.3. By Type of Payments
5.2.3.1. B2B- Market Insights and Forecast 2022-2032, USD Million
5.2.3.2. B2C- Market Insights and Forecast 2022-2032, USD Million
5.2.3.3. C2C- Market Insights and Forecast 2022-2032, USD Million
5.2.3.4. C2B- Market Insights and Forecast 2022-2032, USD Million
5.2.3.4.1. E-commerce Shopping- Market Insights and Forecast 2022-2032, USD Million
5.2.3.4.2. Payment at POS Terminals- Market Insights and Forecast 2022-2032, USD Million
5.2.4. By Transaction Type
5.2.4.1. Domestic- Market Insights and Forecast 2022-2032, USD Million
5.2.4.2. Foreign- Market Insights and Forecast 2022-2032, USD Million
5.2.5. By Application
5.2.5.1. Food & Groceries- Market Insights and Forecast 2022-2032, USD Million
5.2.5.2. Health & Pharmacies- Market Insights and Forecast 2022-2032, USD Million
5.2.5.3. Travel & Tourism- Market Insights and Forecast 2022-2032, USD Million
5.2.5.4. Hospitality- Market Insights and Forecast 2022-2032, USD Million
5.2.5.5. Others (Media & Entertainment)- Market Insights and Forecast 2022-2032, USD Million
5.2.6. By Competitors
5.2.6.1. Competition Characteristics
5.2.6.2. Market Share & Analysis
6. Indonesia Cards Market Statistics, 2022-2032F
6.1. Market Size & Growth Outlook
6.1.1. By Revenues in US$ Million
6.2. Market Segmentation & Growth Outlook
6.2.1. By Card Type- Market Insights and Forecast 2022-2032, USD Million
6.2.2. By Type of Payments- Market Insights and Forecast 2022-2032, USD Million
6.2.3. By Transaction Type- Market Insights and Forecast 2022-2032, USD Million
6.2.4. By Application- Market Insights and Forecast 2022-2032, USD Million
7. Indonesia Mobile Wallets Market Statistics, 2022-2032F
7.1. Market Size & Growth Outlook
7.1.1. By Revenues in US$ Million
7.2. Market Segmentation & Growth Outlook
7.2.1. By Type of Payments- Market Insights and Forecast 2022-2032, USD Million
7.2.2. By Transaction Type- Market Insights and Forecast 2022-2032, USD Million
7.2.3. By Application- Market Insights and Forecast 2022-2032, USD Million
8. Indonesia Cheques Market Statistics, 2022-2032F
8.1. Market Size & Growth Outlook
8.1.1. By Revenues in US$ Million
8.2. Market Segmentation & Growth Outlook
8.2.1. By Type of Payments- Market Insights and Forecast 2022-2032, USD Million
8.2.2. By Transaction Type- Market Insights and Forecast 2022-2032, USD Million
8.2.3. By Application- Market Insights and Forecast 2022-2032, USD Million
9. Competitive Outlook
9.1. Company Profiles
9.1.1. Bank Central Asia Tbk PT
9.1.1.1. Business Description
9.1.1.2. Product Portfolio
9.1.1.3. Collaborations & Alliances
9.1.1.4. Recent Developments
9.1.1.5. Financial Details
9.1.1.6. Others
9.1.2. Bank Mandiri (Persero) Tbk PT
9.1.2.1. Business Description
9.1.2.2. Product Portfolio
9.1.2.3. Collaborations & Alliances
9.1.2.4. Recent Developments
9.1.2.5. Financial Details
9.1.2.6. Others
9.1.3. Bank Rakyat Indonesia (Persero) Tbk PT
9.1.3.1. Business Description
9.1.3.2. Product Portfolio
9.1.3.3. Collaborations & Alliances
9.1.3.4. Recent Developments
9.1.3.5. Financial Details
9.1.3.6. Others
9.1.4. Bank Negara Indonesia (Persero) Tbk PT
9.1.4.1. Business Description
9.1.4.2. Product Portfolio
9.1.4.3. Collaborations & Alliances
9.1.4.4. Recent Developments
9.1.4.5. Financial Details
9.1.4.6. Others
9.1.5. Bank CIMB Niaga Tbk PT
9.1.5.1. Business Description
9.1.5.2. Product Portfolio
9.1.5.3. Collaborations & Alliances
9.1.5.4. Recent Developments
9.1.5.5. Financial Details
9.1.5.6. Others
9.1.6. Bank Mega Tbk PT
9.1.6.1. Business Description
9.1.6.2. Product Portfolio
9.1.6.3. Collaborations & Alliances
9.1.6.4. Recent Developments
9.1.6.5. Financial Details
9.1.6.6. Others
9.1.7. Bank Danamon Indonesia Tbk PT
9.1.7.1. Business Description
9.1.7.2. Product Portfolio
9.1.7.3. Collaborations & Alliances
9.1.7.4. Recent Developments
9.1.7.5. Financial Details
9.1.7.6. Others
9.1.8. Citibank Indonesia PT
9.1.8.1. Business Description
9.1.8.2. Product Portfolio
9.1.8.3. Collaborations & Alliances
9.1.8.4. Recent Developments
9.1.8.5. Financial Details
9.1.8.6. Others
9.1.9. HSBC Holdings Plc
9.1.9.1. Business Description
9.1.9.2. Product Portfolio
9.1.9.3. Collaborations & Alliances
9.1.9.4. Recent Developments
9.1.9.5. Financial Details
9.1.9.6. Others
9.1.10. Bank UOB Indonesia PT
9.1.10.1. Business Description
9.1.10.2. Product Portfolio
9.1.10.3. Collaborations & Alliances
9.1.10.4. Recent Developments
9.1.10.5. Financial Details
9.1.10.6. Others
10. Disclaimer
| Segment | Sub-Segment |
|---|---|
| By Instrument Type |
|
| By Card Type |
|
| By Type of Payments |
|
| By Transaction Type |
|
| By Application |
|
Research Methodology
This study followed a structured approach comprising four key phases to assess the size and scope of the electro-oxidation market. The process began with thorough secondary research to collect data on the target market, related markets, and broader industry context. These findings, along with preliminary assumptions and estimates, were then validated through extensive primary research involving industry experts from across the value chain. To calculate the overall market size, both top-down and bottom-up methodologies were employed. Finally, market segmentation and data triangulation techniques were applied to refine and validate segment-level estimations.
Secondary Research
The secondary research phase involved gathering data from a wide range of credible and published sources. This step helped in identifying industry trends, defining market segmentation, and understanding the market landscape and value chain.
Sources consulted during this phase included:
- Company annual reports, investor presentations, and press releases
- Industry white papers and certified publications
- Trade directories and market-recognized databases
- Articles from authoritative authors and reputable journals
- Gold and silver standard websites
Secondary research was critical in mapping out the industry's value chain and monetary flow, identifying key market segments, understanding regional variations, and tracking significant industry developments.
Other key sources:
- Financial disclosures
- Industry associations and trade bodies
- News outlets and business magazines
- Academic journals and research studies
- Paid industry databases
Primary Research
To validate secondary data and gain deeper market insights, primary research was conducted with key stakeholders across both the supply and demand sides of the market.
On the demand side, participants included decision-makers and influencers from end-user industries—such as CIOs, CTOs, and CSOs—who provided first-hand perspectives on market needs, product usage, and future expectations.
On the supply side, interviews were conducted with manufacturers, industry associations, and institutional participants to gather insights into current offerings, product pipelines, and market challenges.
Primary interviews provided critical inputs such as:
- Market size and revenue data
- Product and service breakdowns
- Market forecasts
- Regional and application-specific trends
Stakeholders consulted included:
- Leading OEM and solution providers
- Channel and distribution partners
- End users across various applications
- Independent consultants and industry specialists
Market Size Estimation and Data Triangulation
- Identifying Key Market Participants (Secondary Research)
- Goal: To identify the major players or companies in the target market. This typically involves using publicly available data sources such as industry reports, market research publications, and financial statements of companies.
- Tools: Reports from firms like Gartner, Forrester, Euromonitor, Statista, IBISWorld, and others. Public financial statements, news articles, and press releases from top market players.
- Extracting Earnings of Key Market Participants
- Goal: To estimate the earnings generated from the product or service being analyzed. This step helps in understanding the revenue potential of each market player in a specific geography.
- Methods: Earnings data can be gathered from:
- Publicly available financial reports (for listed companies).
- Interviews and primary data sources from professionals, such as Directors, VPs, SVPs, etc. This is especially useful for understanding more nuanced, internal data that isn't publicly disclosed.
- Annual reports and investor presentations of key players.
- Data Collation and Development of a Relevant Data Model
- Goal: To collate inputs from both primary and secondary sources into a structured, data-driven model for market estimation. This model will incorporate key market KPIs and any independent variables relevant to the market.
- Key KPIs: These could include:
- Market size, growth rate, and demand drivers.
- Industry-specific metrics like market share, average revenue per customer (ARPC), or average deal size.
- External variables, such as economic growth rates, inflation rates, or commodity prices, that could affect the market.
- Data Modeling: Based on this data, the market forecasts are developed for the next 5 years. A combination of trend analysis, scenario modeling, and statistical regression might be used to generate projections.
- Scenario Analysis
- Goal: To test different assumptions and validate how sensitive the market is to changes in key variables (e.g., market demand, regulatory changes, technological disruptions).
- Types of Scenarios:
- Base Case: Based on current assumptions and historical data.
- Best-Case Scenario: Assuming favorable market conditions, regulatory environments, and technological advancements.
- Worst-Case Scenario: Accounting for adverse factors, such as economic downturns, stricter regulations, or unexpected disruptions.


