India Footwear Market Report: Trends, Growth and Forecast (2026-2032)
By Category (Children's Footwear (Infants (0-9 Months) Foot Length (CM) (8.3-8.9, 9.2-9.5, 10.1-10.5), Toddlers (9 Months - 4 Years) Foot Length (CM) (10.8, 11.4-11.7, 12.1-12.7, 13.0-13.3, 14.0-14.3, 14.6-15.2, 15.6-15.9, 16.5), Little Kids (4-7 Years) Foot Length (CM) (16.8, 17.1-17.8, 18.1-18.4, 19.1-19.4, 19.7-20.6, 21.0-21.6), Big Kids (7-12 Years) Foot Length (CM) (21.9, 22.2-23.5, 24.1-24.8)), Women's Footwear (Foot Length (CM) (20.8, 21.3-21.6, 22.2-22.5, 23.0-23.8, 24.1-24.6, 25.1-25.9, 26.2-26.7, 27.6)), Men's Footwear (Foot Length (CM) (23.5, 24.1-24.8, 25.4-25.7, 26.0-26.7, 27.0-27.9, 28.3-28.6, 29.4, 30.2, 31.0-31.8))), By Product Type (Casual, Athletic/Sports, Formal, Others), By Sales Channel (Retail Online, Retail Offline), By Material (Leather, Textile, Rubber, Synthetic, Canvas), By Price (Mass, Premium), By Footwear Type (Shoes (Sneakers, Boots), Sandals & Slippers (Flip-Flops)), By Application (Conventional Footwear (Daily Wear, Work/Office Wear, Outdoor & Adventure, Sports & Fitness, Party/Occasion Wear), Functional/Therapeutic Footwear (Therapeutic/Orthopedic, Medicated Slippers, Acupressure Slippers)), By Region (North, East, West, South) ... Read more
|
Major Players
|
India Footwear Market Statistics and Insights, 2026
- Market Size Statistics
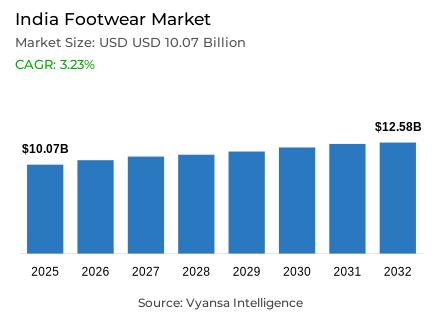
- Footwear in India is estimated at USD 10.07 billion in 2025.
- The market size is expected to grow to USD 12.58 billion by 2032.
- Market to register a cagr of around 3.23% during 2026-32.
- Category Shares
- Men's footwear grabbed market share of 52%.
- Competition
- More than 20 companies are actively engaged in producing footwear in India.
- Top 5 companies acquired around 15% of the market share.
- adidas India; Veekesy Rubber; Metro Shoes; Bata India Ltd; Relaxo Footwears Ltd etc., are few of the top companies.
- Sales Channel
- Retail offline grabbed 85% of the market.
India Footwear Market Outlook
The India footwear market is expected to record a consistent growth in the period of 2026–2032 despite the inflationary forces and increased price sensitivity in the recent years. The market is estimated to be USD 10.07 billion in 2025 and is estimated to grow to USD 12.58 billion in 2032 with a compound annual growth rate of about 3.23%. The increasing demand in both the premium and mass-market segments, which is backed by the growing end user base and changing fashion patterns, drives growth. Despite the moderate growth in volume in some of the categories, the casual and comfort-based footwear has been gaining momentum with more end users opting to buy versatile and affordable products.
The largest segment is men footwear with approximately 52% of the total market value. The retailers are retaliating with more focused marketing efforts especially in the urban centres where fashionable but comfortable footwear is on the increase. The footwear of women, although with a smaller share, is projected to increase at a higher rate due to the fashion trends, interest in customisation, and the need to have higher quality designs.
Moreover, the emergence of fast-commerce platforms is creating new growth opportunities due to the ability to deliver products faster and access footwear styles immediately in large urban areas.
In spite of these developments, retail offline remains the leader, with approximately 85% of all sales, as end users still prefer in-store shopping where they can evaluate fit, comfort, and quality firsthand. retail online is growing at a fast pace and provides a chance to access younger, more digitally active end users, yet physical retail is the foundation of the footwear distribution.

India Footwear Market Growth Driver
Expanding Middle-Class Population and Rising Disposable Income
The growing middle-income and increasing disposable income is one of the key forces behind the Indian footwear market. According to World Bank estimates that India will experience a GDP growth of approximately 6.5% in 2024, which will help in income growth and end user expenditure among income groups. With the growth of the middle class, the purchasing power is growing and more end users can afford both the premium and the value-for-money footwear.
The demand of younger urban end users, especially, is the affordable but fashionable footwear that is comfortable and stylish at the same time. The increasing number of working population and the growing interest in fitness and sports also contribute to the demand of casual and athletic footwear. Together with the growing urbanisation, these aspects make the footwear market more inclusive and ensure high long-term growth.
India Footwear Market Challenge
Inflationary Pressures and Price Sensitivity
The India footwear market is constrained by persistent inflation, which has increased the cost of raw materials and finished products. According to Reserve Bank of India reported that inflation was about 5.9% per year in 2024, which decreased the purchasing power of end users. This has led to a more cautious discretionary spending among buyers, which has impacted footwear purchases, particularly in the mass-market segments.
Brands are in a challenging position of either increasing prices and losing price-sensitive end users, or absorbing expenses and undermining margins. This is especially true of smaller players, whose profitability is being squeezed by increasing input costs. Promotions are becoming more and more important to retailers, yet the growth in volume is slow because of the continued price sensitivity.
Unlock Market Intelligence
Explore the market potential with our data-driven report
India Footwear Market Trend
Customisation and Personalisation of Footwear
Growing preference for customization and personalization is influencing the footwear market in India, especially across major cities. End users are demanding shoes that represent personal style. Nike and adidas are global brands that have also added customisation features via apps and online platforms, enabling end users to customise sneakers and other footwear.
This is not only happening in the high-end brands but also in the mass segments as 3D printing and modular design allow custom options to be more affordable. Personalised shoes enhance comfort, fit, and fashion. The personalised products will continue to increase in demand as end users show readiness to spend more on unique, functional, and expressive designs.
India Footwear Market Opportunity
Quick Commerce and E-Commerce Growth
The emergence of fast-commerce and the ongoing growth of retail online are good prospects of the footwear market in India. Zepto, Blinkit, and Swiggy Instamart are platforms that are entering the urban retail life and deliver within minutes. This opens up the possibility of reaching last-minute shoppers and convenience shoppers.
Bata and other brands have already ventured into quick commerce by collaborating with Zepto, which enhances accessibility in major cities. This is a channel that is especially pertinent to younger, tech-savvy end users who appreciate speed and convenience. Integrating rapid commerce with the conventional retail online enables brands to access a larger audience and increase footwear sales outside of the traditional retailing format.
Unlock Market Intelligence
Explore the market potential with our data-driven report
India Footwear Market Segmentation Analysis
By Category
- Children's Footwear
- Infants (0-9 Months) Foot Length (CM)
- 8.3-8.9
- 9.2-9.5
- 10.1-10.5
- Toddlers (9 Months - 4 Years) Foot Length (CM)
- 10.8
- 11.4-11.7
- 12.1-12.7
- 13.0-13.3
- 14.0-14.3
- 14.6-15.2
- 15.6-15.9
- 16.5
- Little Kids (4-7 Years) Foot Length (CM)
- 16.8
- 17.1-17.8
- 18.1-18.4
- 19.1-19.4
- 19.7-20.6
- 21.0-21.6
- Big Kids (7-12 Years) Foot Length (CM)
- 21.9
- 22.2-23.5
- 24.1-24.8
- Infants (0-9 Months) Foot Length (CM)
- Women's Footwear
- Foot Length (CM)
- 20.8
- 21.3-21.6
- 22.2-22.5
- 23.0-23.8
- 24.1-24.6
- 25.1-25.9
- 26.2-26.7
- 27.6
- Foot Length (CM)
- Men's Footwear
- Foot Length (CM)
- 23.5
- 24.1-24.8
- 25.4-25.7
- 26.0-26.7
- 27.0-27.9
- 28.3-28.6
- 29.4
- 30.2
- 31.0-31.8
- Foot Length (CM)
The product with the greatest market share under category is men's footwear, which accounts for approximately 52% of the market. The key reason behind this is primarily because men purchase footwear more regularly than women, whether it is to be used in office, casual outings, or other occasions such as weddings, birthday parties, or other major celebrations in society. Men's footwear caters to all demands therefore, it is considered to be the product with the most regular demands in society.
Men's footwear will continue to remain at a leading position in value sales, although other categories may also register growth over the projected period of 2026-32. The category has been boosted by increasing fashion consciousness amongst men and greater expenditure incurred during festivity and wedding seasons. Organised retail penetration of smaller cities would ensure that men's footwear remain at the forefront of total footwear sales in India.

By Sales Channel
- Retail Online
- Retail Offline
The segment with highest market share under sales channel segmentation is retail offline, which includes close to 85% of share. The major reason why physical retail stores are preferred is that one can try on footwear before actually buying a pair. Footwear stores are primarily responsible for this sector.
The retail offline channel will continue to lead in terms of market share in the period 2026-32, as brands continue expanding their retail stores in tier-2 and tier-3 cities. Brands will increase their number of retail stores and franchises as they also tend to tap new end user. Even though online sales will increase in the period, end user will continue trusting offline retail stores while purchasing footwear.
List of Companies Covered in India Footwear Market
The companies listed below are highly influential in the India footwear market, with a significant market share and a strong impact on industry developments.
- adidas India
- Veekesy Rubber
- Metro Shoes
- Bata India Ltd
- Relaxo Footwears Ltd
- Skechers South Asia
- Puma Sports India
- Paragon Group
- Various Franchisees
- Mirza International
Competitive Landscape
India footwear market in 2024 is led by Bata, which maintains leadership through its extensive retail network of over 1,900 stores and a strong portfolio of in-house brands such as Bata, Power, Hush Puppies, and Floatz. Its omnichannel strategy and expansion into tier-2 and tier-3 cities have reinforced its dominance in casual and everyday footwear. Organised players have strengthened their position following the implementation of mandatory BIS certification, as they adapted faster than smaller, import-dependent brands. Global brands like Nike and adidas are shaping the premium and sneaker segments through customisation, limited editions, and digital partnerships. The entry of Foot Locker, in partnership with Metro Brands and Nykaa Fashion, is expected to intensify competition in premium athletic footwear and sneaker culture.
Frequently Asked Questions
Related Report
1. Market Segmentation
1.1. Research Scope
1.2. Research Methodology
1.3. Definitions and Assumptions
2. Executive Summary
3. India Footwear Market Policies, Regulations, and Standards
4. India Footwear Market Dynamics
4.1. Growth Factors
4.2. Challenges
4.3. Trends
4.4. Opportunities
5. India Footwear Market Statistics, 2022-2032F
5.1. Market Size & Growth Outlook
5.1.1.By Revenues in USD Million
5.1.2.By Units Sold in Thousand Units
5.2. Market Segmentation & Growth Outlook
5.2.1.By Category
5.2.1.1. Children's Footwear- Market Insights and Forecast 2022-2032, USD Million
5.2.1.1.1. Infants (0-9 Months) Foot Length (CM)- Market Insights and Forecast 2022-2032, USD Million
5.2.1.1.1.1. 8.3-8.9- Market Insights and Forecast 2022-2032, USD Million
5.2.1.1.1.2. 9.2-9.5- Market Insights and Forecast 2022-2032, USD Million
5.2.1.1.1.3. 10.1-10.5- Market Insights and Forecast 2022-2032, USD Million
5.2.1.1.2. Toddlers (9 Months - 4 Years) Foot Length (CM)- Market Insights and Forecast 2022-2032, USD Million
5.2.1.1.2.1. 10.8- Market Insights and Forecast 2022-2032, USD Million
5.2.1.1.2.2. 11.4-11.7- Market Insights and Forecast 2022-2032, USD Million
5.2.1.1.2.3. 12.1-12.7- Market Insights and Forecast 2022-2032, USD Million
5.2.1.1.2.4. 13.0-13.3- Market Insights and Forecast 2022-2032, USD Million
5.2.1.1.2.5. 14.0-14.3- Market Insights and Forecast 2022-2032, USD Million
5.2.1.1.2.6. 14.6-15.2- Market Insights and Forecast 2022-2032, USD Million
5.2.1.1.2.7. 15.6-15.9- Market Insights and Forecast 2022-2032, USD Million
5.2.1.1.2.8. 16.5- Market Insights and Forecast 2022-2032, USD Million
5.2.1.1.3. Little Kids (4-7 Years) Foot Length (CM)- Market Insights and Forecast 2022-2032, USD Million
5.2.1.1.3.1. 16.8- Market Insights and Forecast 2022-2032, USD Million
5.2.1.1.3.2. 17.1-17.8- Market Insights and Forecast 2022-2032, USD Million
5.2.1.1.3.3. 18.1-18.4- Market Insights and Forecast 2022-2032, USD Million
5.2.1.1.3.4. 19.1-19.4- Market Insights and Forecast 2022-2032, USD Million
5.2.1.1.3.5. 19.7-20.6- Market Insights and Forecast 2022-2032, USD Million
5.2.1.1.3.6. 21.0-21.6- Market Insights and Forecast 2022-2032, USD Million
5.2.1.1.4. Big Kids (7-12 Years) Foot Length (CM)- Market Insights and Forecast 2022-2032, USD Million
5.2.1.1.4.1. 21.9- Market Insights and Forecast 2022-2032, USD Million
5.2.1.1.4.2. 22.2-23.5- Market Insights and Forecast 2022-2032, USD Million
5.2.1.1.4.3. 24.1-24.8- Market Insights and Forecast 2022-2032, USD Million
5.2.1.2. Women's Footwear- Market Insights and Forecast 2022-2032, USD Million
5.2.1.2.1. Foot Length (CM)- Market Insights and Forecast 2022-2032, USD Million
5.2.1.2.1.1. 20.8- Market Insights and Forecast 2022-2032, USD Million
5.2.1.2.1.2. 21.3-21.6- Market Insights and Forecast 2022-2032, USD Million
5.2.1.2.1.3. 22.2-22.5- Market Insights and Forecast 2022-2032, USD Million
5.2.1.2.1.4. 23.0-23.8- Market Insights and Forecast 2022-2032, USD Million
5.2.1.2.1.5. 24.1-24.6- Market Insights and Forecast 2022-2032, USD Million
5.2.1.2.1.6. 25.1-25.9- Market Insights and Forecast 2022-2032, USD Million
5.2.1.2.1.7. 26.2-26.7- Market Insights and Forecast 2022-2032, USD Million
5.2.1.2.1.8. 27.6- Market Insights and Forecast 2022-2032, USD Million
5.2.1.3. Men's Footwear- Market Insights and Forecast 2022-2032, USD Million
5.2.1.3.1. Foot Length (CM)- Market Insights and Forecast 2022-2032, USD Million
5.2.1.3.1.1. 23.5- Market Insights and Forecast 2022-2032, USD Million
5.2.1.3.1.2. 24.1-24.8- Market Insights and Forecast 2022-2032, USD Million
5.2.1.3.1.3. 25.4-25.7- Market Insights and Forecast 2022-2032, USD Million
5.2.1.3.1.4. 26.0-26.7- Market Insights and Forecast 2022-2032, USD Million
5.2.1.3.1.5. 27.0-27.9- Market Insights and Forecast 2022-2032, USD Million
5.2.1.3.1.6. 28.3-28.6- Market Insights and Forecast 2022-2032, USD Million
5.2.1.3.1.7. 29.4- Market Insights and Forecast 2022-2032, USD Million
5.2.1.3.1.8. 30.2- Market Insights and Forecast 2022-2032, USD Million
5.2.1.3.1.9. 31.0-31.8- Market Insights and Forecast 2022-2032, USD Million
5.2.2.By Product Type
5.2.2.1. Casual- Market Insights and Forecast 2022-2032, USD Million
5.2.2.2. Athletic/Sports- Market Insights and Forecast 2022-2032, USD Million
5.2.2.3. Formal- Market Insights and Forecast 2022-2032, USD Million
5.2.2.4. Others- Market Insights and Forecast 2022-2032, USD Million
5.2.3.By Sales Channel
5.2.3.1. Retail Online- Market Insights and Forecast 2022-2032, USD Million
5.2.3.2. Retail Offline- Market Insights and Forecast 2022-2032, USD Million
5.2.4.By Material
5.2.4.1. Leather- Market Insights and Forecast 2022-2032, USD Million
5.2.4.2. Textile- Market Insights and Forecast 2022-2032, USD Million
5.2.4.3. Rubber- Market Insights and Forecast 2022-2032, USD Million
5.2.4.4. Synthetic- Market Insights and Forecast 2022-2032, USD Million
5.2.4.5. Canvas- Market Insights and Forecast 2022-2032, USD Million
5.2.5.By Price
5.2.5.1. Mass- Market Insights and Forecast 2022-2032, USD Million
5.2.5.2. Premium- Market Insights and Forecast 2022-2032, USD Million
5.2.6.By Footwear Type
5.2.6.1. Shoes- Market Insights and Forecast 2022-2032, USD Million
5.2.6.1.1. Sneakers- Market Insights and Forecast 2022-2032, USD Million
5.2.6.1.2. Boots- Market Insights and Forecast 2022-2032, USD Million
5.2.6.2. Sandals & Slippers- Market Insights and Forecast 2022-2032, USD Million
5.2.6.2.1. Flip-Flops- Market Insights and Forecast 2022-2032, USD Million
5.2.7.By Application
5.2.7.1. Conventional Footwear- Market Insights and Forecast 2022-2032, USD Million
5.2.7.1.1. Daily Wear- Market Insights and Forecast 2022-2032, USD Million
5.2.7.1.2. Work/Office Wear- Market Insights and Forecast 2022-2032, USD Million
5.2.7.1.3. Outdoor & Adventure- Market Insights and Forecast 2022-2032, USD Million
5.2.7.1.4. Sports & Fitness- Market Insights and Forecast 2022-2032, USD Million
5.2.7.1.5. Party/Occasion Wear- Market Insights and Forecast 2022-2032, USD Million
5.2.7.2. Functional/Therapeutic Footwear- Market Insights and Forecast 2022-2032, USD Million
5.2.7.2.1. Therapeutic/Orthopedic- Market Insights and Forecast 2022-2032, USD Million
5.2.7.2.2. Medicated Slippers- Market Insights and Forecast 2022-2032, USD Million
5.2.7.2.3. Acupressure Slippers- Market Insights and Forecast 2022-2032, USD Million
5.2.8.By Region
5.2.8.1. North
5.2.8.2. East
5.2.8.3. West
5.2.8.4. South
5.2.9.By Competitors
5.2.9.1. Competition Characteristics
5.2.9.2. Market Share & Analysis
6. India Children's Footwear Market Statistics, 2022-2032
6.1. Market Size & Growth Outlook
6.1.1.By Revenues in USD Million
6.1.2.By Units Sold in Thousand Units
6.2. Market Segmentation & Growth Outlook
6.2.1.By Category- Market Insights and Forecast 2022-2032, USD Million
6.2.2.By Product Type- Market Insights and Forecast 2022-2032, USD Million
6.2.3.By Sales Channel- Market Insights and Forecast 2022-2032, USD Million
6.2.4.By Material- Market Insights and Forecast 2022-2032, USD Million
6.2.5.By Price- Market Insights and Forecast 2022-2032, USD Million
6.2.6.By Footwear Type- Market Insights and Forecast 2022-2032, USD Million
6.2.7.By Application- Market Insights and Forecast 2022-2032, USD Million
6.2.8.By Region- Market Insights and Forecast 2022-2032, USD Million
7. India Women's Footwear Market Statistics, 2022-2032
7.1. Market Size & Growth Outlook
7.1.1.By Revenues in USD Million
7.1.2.By Units Sold in Thousand Units
7.2. Market Segmentation & Growth Outlook
7.2.1.By Category- Market Insights and Forecast 2022-2032, USD Million
7.2.2.By Product Type- Market Insights and Forecast 2022-2032, USD Million
7.2.3.By Sales Channel- Market Insights and Forecast 2022-2032, USD Million
7.2.4.By Material- Market Insights and Forecast 2022-2032, USD Million
7.2.5.By Price- Market Insights and Forecast 2022-2032, USD Million
7.2.6.By Footwear Type- Market Insights and Forecast 2022-2032, USD Million
7.2.7.By Application- Market Insights and Forecast 2022-2032, USD Million
7.2.8.By Region- Market Insights and Forecast 2022-2032, USD Million
8. India Men's Footwear Market Statistics, 2022-2032
8.1. Market Size & Growth Outlook
8.1.1.By Revenues in USD Million
8.1.2.By Units Sold in Thousand Units
8.2. Market Segmentation & Growth Outlook
8.2.1.By Category- Market Insights and Forecast 2022-2032, USD Million
8.2.2.By Product Type- Market Insights and Forecast 2022-2032, USD Million
8.2.3.By Sales Channel- Market Insights and Forecast 2022-2032, USD Million
8.2.4.By Material- Market Insights and Forecast 2022-2032, USD Million
8.2.5.By Price- Market Insights and Forecast 2022-2032, USD Million
8.2.6.By Footwear Type- Market Insights and Forecast 2022-2032, USD Million
8.2.7.By Application- Market Insights and Forecast 2022-2032, USD Million
8.2.8.By Region- Market Insights and Forecast 2022-2032, USD Million
9. Competitive Outlook
9.1. Company Profiles
9.1.1.Bata India Ltd
9.1.1.1. Business Description
9.1.1.2. Product Portfolio
9.1.1.3. Collaborations & Alliances
9.1.1.4. Recent Developments
9.1.1.5. Financial Details
9.1.1.6. Others
9.1.2.Relaxo Footwears Ltd
9.1.2.1. Business Description
9.1.2.2. Product Portfolio
9.1.2.3. Collaborations & Alliances
9.1.2.4. Recent Developments
9.1.2.5. Financial Details
9.1.2.6. Others
9.1.3.Skechers South Asia Pvt Ltd
9.1.3.1. Business Description
9.1.3.2. Product Portfolio
9.1.3.3. Collaborations & Alliances
9.1.3.4. Recent Developments
9.1.3.5. Financial Details
9.1.3.6. Others
9.1.4.Puma Sports India Pvt Ltd
9.1.4.1. Business Description
9.1.4.2. Product Portfolio
9.1.4.3. Collaborations & Alliances
9.1.4.4. Recent Developments
9.1.4.5. Financial Details
9.1.4.6. Others
9.1.5.Paragon Group Ltd
9.1.5.1. Business Description
9.1.5.2. Product Portfolio
9.1.5.3. Collaborations & Alliances
9.1.5.4. Recent Developments
9.1.5.5. Financial Details
9.1.5.6. Others
9.1.6.adidas India Marketing Pvt Ltd
9.1.6.1. Business Description
9.1.6.2. Product Portfolio
9.1.6.3. Collaborations & Alliances
9.1.6.4. Recent Developments
9.1.6.5. Financial Details
9.1.6.6. Others
9.1.7.Veekesy Rubber Industries Pvt Ltd
9.1.7.1. Business Description
9.1.7.2. Product Portfolio
9.1.7.3. Collaborations & Alliances
9.1.7.4. Recent Developments
9.1.7.5. Financial Details
9.1.7.6. Others
9.1.8.Metro Shoes Pvt Ltd
9.1.8.1. Business Description
9.1.8.2. Product Portfolio
9.1.8.3. Collaborations & Alliances
9.1.8.4. Recent Developments
9.1.8.5. Financial Details
9.1.8.6. Others
9.1.9.Various franchisees
9.1.9.1. Business Description
9.1.9.2. Product Portfolio
9.1.9.3. Collaborations & Alliances
9.1.9.4. Recent Developments
9.1.9.5. Financial Details
9.1.9.6. Others
9.1.10. Mirza International Ltd
9.1.10.1. Business Description
9.1.10.2. Product Portfolio
9.1.10.3. Collaborations & Alliances
9.1.10.4. Recent Developments
9.1.10.5. Financial Details
9.1.10.6. Others
10. Disclaimer
| Segment | Sub-Segment |
|---|---|
| By Category |
|
| By Product Type |
|
| By Sales Channel |
|
| By Material |
|
| By Price |
|
| By Footwear Type |
|
| By Application |
|
| By Region |
|
Research Methodology
This study followed a structured approach comprising four key phases to assess the size and scope of the electro-oxidation market. The process began with thorough secondary research to collect data on the target market, related markets, and broader industry context. These findings, along with preliminary assumptions and estimates, were then validated through extensive primary research involving industry experts from across the value chain. To calculate the overall market size, both top-down and bottom-up methodologies were employed. Finally, market segmentation and data triangulation techniques were applied to refine and validate segment-level estimations.
Secondary Research
The secondary research phase involved gathering data from a wide range of credible and published sources. This step helped in identifying industry trends, defining market segmentation, and understanding the market landscape and value chain.
Sources consulted during this phase included:
- Company annual reports, investor presentations, and press releases
- Industry white papers and certified publications
- Trade directories and market-recognized databases
- Articles from authoritative authors and reputable journals
- Gold and silver standard websites
Secondary research was critical in mapping out the industry's value chain and monetary flow, identifying key market segments, understanding regional variations, and tracking significant industry developments.
Other key sources:
- Financial disclosures
- Industry associations and trade bodies
- News outlets and business magazines
- Academic journals and research studies
- Paid industry databases
Primary Research
To validate secondary data and gain deeper market insights, primary research was conducted with key stakeholders across both the supply and demand sides of the market.
On the demand side, participants included decision-makers and influencers from end-user industries—such as CIOs, CTOs, and CSOs—who provided first-hand perspectives on market needs, product usage, and future expectations.
On the supply side, interviews were conducted with manufacturers, industry associations, and institutional participants to gather insights into current offerings, product pipelines, and market challenges.
Primary interviews provided critical inputs such as:
- Market size and revenue data
- Product and service breakdowns
- Market forecasts
- Regional and application-specific trends
Stakeholders consulted included:
- Leading OEM and solution providers
- Channel and distribution partners
- End users across various applications
- Independent consultants and industry specialists
Market Size Estimation and Data Triangulation
- Identifying Key Market Participants (Secondary Research)
- Goal: To identify the major players or companies in the target market. This typically involves using publicly available data sources such as industry reports, market research publications, and financial statements of companies.
- Tools: Reports from firms like Gartner, Forrester, Euromonitor, Statista, IBISWorld, and others. Public financial statements, news articles, and press releases from top market players.
- Extracting Earnings of Key Market Participants
- Goal: To estimate the earnings generated from the product or service being analyzed. This step helps in understanding the revenue potential of each market player in a specific geography.
- Methods: Earnings data can be gathered from:
- Publicly available financial reports (for listed companies).
- Interviews and primary data sources from professionals, such as Directors, VPs, SVPs, etc. This is especially useful for understanding more nuanced, internal data that isn't publicly disclosed.
- Annual reports and investor presentations of key players.
- Data Collation and Development of a Relevant Data Model
- Goal: To collate inputs from both primary and secondary sources into a structured, data-driven model for market estimation. This model will incorporate key market KPIs and any independent variables relevant to the market.
- Key KPIs: These could include:
- Market size, growth rate, and demand drivers.
- Industry-specific metrics like market share, average revenue per customer (ARPC), or average deal size.
- External variables, such as economic growth rates, inflation rates, or commodity prices, that could affect the market.
- Data Modeling: Based on this data, the market forecasts are developed for the next 5 years. A combination of trend analysis, scenario modeling, and statistical regression might be used to generate projections.
- Scenario Analysis
- Goal: To test different assumptions and validate how sensitive the market is to changes in key variables (e.g., market demand, regulatory changes, technological disruptions).
- Types of Scenarios:
- Base Case: Based on current assumptions and historical data.
- Best-Case Scenario: Assuming favorable market conditions, regulatory environments, and technological advancements.
- Worst-Case Scenario: Accounting for adverse factors, such as economic downturns, stricter regulations, or unexpected disruptions.


