India Edible Oil Market Report: Trends, Growth and Forecast (2025-2030)
By Type (Industrial Oil, Vegetable Oils, Animal-Derived Oils, Palm Oils), By Application (Food, Non-Food Application), By Extraction Type (Mechanical Extraction, Solvent Extraction, Hydrogenation, Sparging), By Packaging Type (Pouches, Jars, Cans, Bottles), By End Use (Household, Food Service, Industrial), By Sales Channel (Retails Offline, Retail Online) ... Read more

|
Major Players
|
India Edible Oil Market Statistics, 2025
- Market Size Statistics
- Edible Oil in India is estimated at $ 24.8 Billion.
- The market size is expected to grow to $ 29.09 Billion by 2030.
- Market to register a CAGR of around 2.69% during 2025-30.
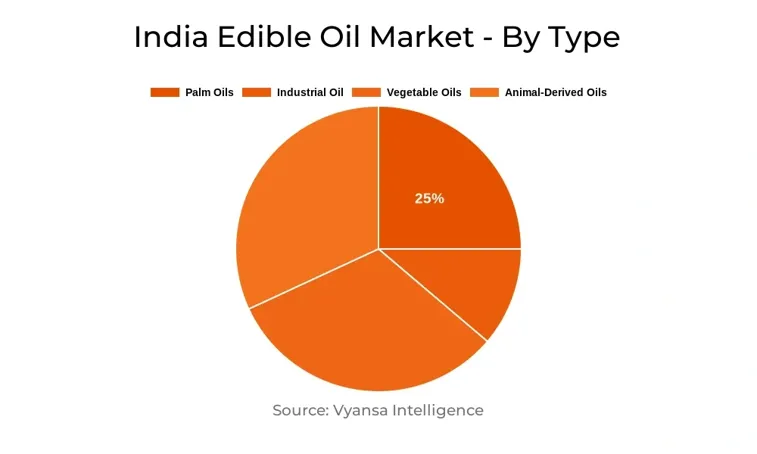
- Product Shares
- Palm Oil grabbed market share of 25%.
- Palm Oil to witness a volume CAGR of around 3.48%.
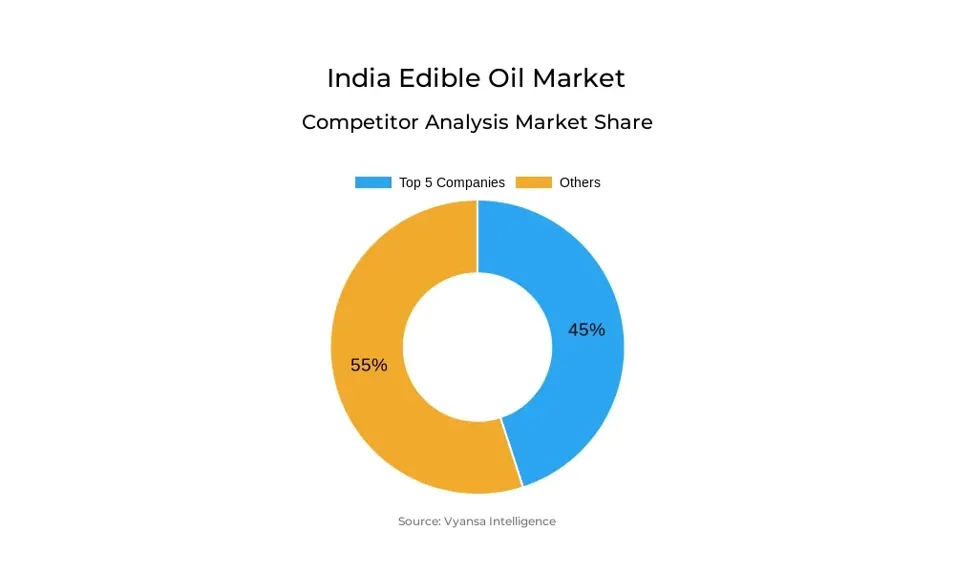
- Competition
- More than 10 companies are actively engaged in producing Edible Oil in India.
- Top 5 companies acquired 45% of the market share.
- Mother Dairy Fruit & Vegetable Pvt Ltd, VVV & Sons, Marico Ltd, Adani Group, Ruchi Soya Industries Ltd etc., are few of the top companies.
- Sales Channel
- Retail Offline grabbed 95% of the market.
India Edible Oil Market Outlook
The India Edible Oils Market is expected to register steady growth in 2025-30, aided by stable demand both from the household and foodservice markets. As a result of the increase in basic customs duty on crude and refined edible oils in 2024, domestic prices experienced a rise. While this may suppress consumption volumes in this price-sensitive market in the short term, the measure is intended to encourage local production and cut dependence on imports, which account for more than half of India's edible oil consumption.
Retail volume and value sales are anticipated to continue strong in the forecast period, with palm oil still leading the charge due to its price affordability. A slow transition of consumers towards healthier alternatives like sunflower, rapeseed, and groundnut oils is also anticipated, especially as health consciousness and rates of lifestyle-related diseases increase. Blended and functional oils like those presented by Adani Group are also likely to be in greater demand, particularly from health-aware consumers.
Distribution dynamics too are changing, with new-generation grocery retailers and online channels consistently taking market share away from conventional small grocers. Brands are increasing their presence on these platforms, aided by increasing internet penetration and speed commerce players.
Foodservice volume expansion is also expected to surpass retail, driven by growing urbanization, expanding tourism, and rising demand for fried food in limited-service restaurants and street stalls. At the same time, government programs under the National Mission on Edible Oils also intend to increase domestic production, which could stabilize prices and lead to a wider shift towards superior-quality and cold-pressed oils, particularly among higher-income households.
India Edible Oil Market Growth Driver
India's high dependence on edible oil imports—more than 50% of domestic consumption—exposes the nation to the vagaries of the international supply chain and prices. The Indian government has, therefore, chosen to promote domestic production by setting up the National Mission on Edible Oils in 2024 with a budget of more than INR100,000 million. Running for six years from 2024-2025 to 2030-2031, the plan aims to increase the production of the major oilseed crops like rapeseed, mustard, groundnut, and soybean.
The initiative has a target of production growth from 39 million tonnes in 2022-2023 to 69.7 million tonnes in 2030-2031. The strategic action is aimed at boosting self-sufficiency and steadying edible oil prices in the domestic market in the forecast period, thus contributing to long-term growth in the market.
India Edible Oil Market Trend
Palm oil will continue to be the highest consumed edible oil in India because of its affordability and will continue to lead in retail volume and value sales even in 2024. But increasing health awareness is gradually changing the trend towards healthier options such as sunflower and rapeseed oils. Even with this trend, consistent price increases are checking wider adoption. This has prompted brands to emphasize functional oils to suit changing consumer sentiments.
For example, Adani Group has Fortune Total Balance Oil, a mixture of three oils along with SAFA, MUFA, PUFA, and balanced omegas 3 and 6 ratio, to appeal to consumers sensitive about cholesterol levels. Also, its Fortune Xpert Pro Immunity has 100 antioxidants and the crucial vitamins A, D, and E, plus omega 6, to promote all-around health.
Unlock Market Intelligence
Explore the market potential with our data-driven report
India Edible Oil Market Opportunity
The rise in heart problems, especially in young Indians, because of sedentary lives and high cholesterol levels, is causing consumers to turn to more healthy edible oils like groundnut and sunflower oil. Since local production stabilizes prices, the demand shift away from palm oil is likely to become sharper over 2025–30. In addition, the increase in demand for cold-pressed oils—appreciated due to their purity and retention of nutrients—is proving to be a significant trend.
These oils, which are cold-pressed at room temperature without the use of any chemicals, are finding favour with customers through retail outlets for on-site extraction throughout India. Whereas cold-pressed oils continue to be a high-value product, costing three to four times those conventional products, increased incomes and better living standards are poised to increase their use, particularly for certain recipes. As a result, the market for good-quality and health-conscious edible oils is also expected to grow strongly in future years.
| Report Coverage | Details |
|---|---|
| Market Forecast | 2025-30 |
| USD Value 2024 | $ 24.8 Billion |
| USD Value 2030 | $ 29.09 Billion |
| CAGR 2025-2030 | 2.69% |
| Largest Category | Palm Oil segment leads with 25% market share |
| Top Drivers | Government Push for Domestic Production to Reduce Import Dependency |
| Top Trends | Rising Health Awareness Prompting Shift Towards Functional and Healthier Oil Alternatives |
| Top Opportunities | Rising Health Awareness Driving Demand for Premium & Cold-Pressed Oils |
| Key Players | Mother Dairy Fruit & Vegetable Pvt Ltd, VVV & Sons, Marico Ltd, Adani Group, Ruchi Soya Industries Ltd, Emami Ltd, Cargill India Pvt Ltd, Kaleesuwari Refinery Pvt Ltd, M K Agrotech Pvt Ltd, Patanjali Ayurved Ltd and Others. |
Unlock Market Intelligence
Explore the market potential with our data-driven report
India Edible Oil Market Segmentation Analysis
The largest market share segment in the India Edible Oils Market through 2025–30 is Retail Offline, driven mainly by small local grocery stores. These stores are likely to continue leading in terms of retail value in 2024 as a result of their extensive penetration and high consumer dependence. Yet, modern grocery retailers, such as supermarkets and hypermarkets, are increasingly pushing outside tier-1 cities and are expected to keep advancing in share.
Competitors in the edible oils industry are increasingly looking at securing shelf space within these new formats and solidifying their supply chains for regular stock levels. In the meantime, while retail e-commerce has a lower base, it is gradually gaining momentum, particularly among the convenience- and discount-oriented urban consumers. Digital sales are also backed by rapid commerce platforms like Swiggy Instamart, Zepto, and BB Express, which lead brands to broaden their online presence along with offline channels.
Top Companies in India Edible Oil Market
The top companies operating in the market include Mother Dairy Fruit & Vegetable Pvt Ltd, VVV & Sons, Marico Ltd, Adani Group, Ruchi Soya Industries Ltd, Emami Ltd, Cargill India Pvt Ltd, Kaleesuwari Refinery Pvt Ltd, M K Agrotech Pvt Ltd, Patanjali Ayurved Ltd, etc., are the top players operating in the India Edible Oil Market.
Frequently Asked Questions
Related Report
1. Market Segmentation
1.1. Research Scope
1.2. Research Methodology
1.3. Definitions and Assumptions
2. Executive Summary
3. India Edible Oil Market Policies, Regulations, and Standards
4. India Edible Oil Market Dynamics
4.1. Growth Factors
4.2. Challenges
4.3. Trends
4.4. Opportunities
5. India Edible Oil Market Statistics, 2020-2030F
5.1. Market Size & Growth Outlook
5.1.1.By Revenues in US$ Million
5.1.2.By Quantity Sold in Million Litres
5.2. Market Segmentation & Growth Outlook
5.2.1.By Type
5.2.1.1. Industrial Oil- Market Insights and Forecast 2020-2030, USD Million
5.2.1.1.1. Linseed Oil- Market Insights and Forecast 2020-2030, USD Million
5.2.1.1.2. Castor Oil- Market Insights and Forecast 2020-2030, USD Million
5.2.1.2. Vegetable Oils- Market Insights and Forecast 2020-2030, USD Million
5.2.1.2.1. Canola Oil- Market Insights and Forecast 2020-2030, USD Million
5.2.1.2.2. Soybean Oil- Market Insights and Forecast 2020-2030, USD Million
5.2.1.2.3. Olive Oil- Market Insights and Forecast 2020-2030, USD Million
5.2.1.2.4. Sunflower Oil- Market Insights and Forecast 2020-2030, USD Million
5.2.1.2.5. Peanut Oil- Market Insights and Forecast 2020-2030, USD Million
5.2.1.2.6. Corn Oil- Market Insights and Forecast 2020-2030, USD Million
5.2.1.2.7. Rapeseed Oil- Market Insights and Forecast 2020-2030, USD Million
5.2.1.2.8. Soy Oil- Market Insights and Forecast 2020-2030, USD Million
5.2.1.3. Animal-Derived Oils- Market Insights and Forecast 2020-2030, USD Million
5.2.1.3.1. Fish Oil- Market Insights and Forecast 2020-2030, USD Million
5.2.1.4. Palm Oils- Market Insights and Forecast 2020-2030, USD Million
5.2.1.4.1. Palm Oil- Market Insights and Forecast 2020-2030, USD Million
5.2.1.4.2. Coconut Oil- Market Insights and Forecast 2020-2030, USD Million
5.2.1.4.3. Palm Kernel Oil- Market Insights and Forecast 2020-2030, USD Million
5.2.2.By Application
5.2.2.1. Food- Market Insights and Forecast 2020-2030, USD Million
5.2.2.2. Non-Food Application- Market Insights and Forecast 2020-2030, USD Million
5.2.3.By Extraction Type
5.2.3.1. Mechanical Extraction- Market Insights and Forecast 2020-2030, USD Million
5.2.3.2. Solvent Extraction- Market Insights and Forecast 2020-2030, USD Million
5.2.3.3. Hydrogenation- Market Insights and Forecast 2020-2030, USD Million
5.2.3.4. Sparging- Market Insights and Forecast 2020-2030, USD Million
5.2.4.By Packaging Type
5.2.4.1. Pouches- Market Insights and Forecast 2020-2030, USD Million
5.2.4.2. Jars- Market Insights and Forecast 2020-2030, USD Million
5.2.4.3. Cans- Market Insights and Forecast 2020-2030, USD Million
5.2.4.4. Bottles- Market Insights and Forecast 2020-2030, USD Million
5.2.5.By End Use
5.2.5.1. Household- Market Insights and Forecast 2020-2030, USD Million
5.2.5.2. Food Service- Market Insights and Forecast 2020-2030, USD Million
5.2.5.3. Industrial- Market Insights and Forecast 2020-2030, USD Million
5.2.6.By Sales Channel
5.2.6.1. Retails Offline- Market Insights and Forecast 2020-2030, USD Million
5.2.6.1.1. Grocery Retailers- Market Insights and Forecast 2020-2030, USD Million
5.2.6.1.1.1. Convenience Retailers- Market Insights and Forecast 2020-2030, USD Million
5.2.6.1.1.2. Supermarkets- Market Insights and Forecast 2020-2030, USD Million
5.2.6.1.1.3. Hypermarkets- Market Insights and Forecast 2020-2030, USD Million
5.2.6.1.1.4. Food & Drink Specialists- Market Insights and Forecast 2020-2030, USD Million
5.2.6.1.1.5. Small Local Grocers- Market Insights and Forecast 2020-2030, USD Million
5.2.6.2. Retail Online- Market Insights and Forecast 2020-2030, USD Million
5.2.7.By Competitors
5.2.7.1. Competition Characteristics
5.2.7.2. Market Share & Analysis
6. India Industrial Oils Market Outlook, 2020-2030F
6.1. Market Size & Growth Outlook
6.1.1.By Revenues in US$ Million
6.1.2.By Quantity Sold in Million Litres
6.2. Market Segmentation & Growth Outlook
6.2.1.By Type- Market Insights and Forecast 2020-2030, USD Million
6.2.2.By Application- Market Insights and Forecast 2020-2030, USD Million
6.2.3.By Extraction Type- Market Insights and Forecast 2020-2030, USD Million
6.2.4.By Packaging Type- Market Insights and Forecast 2020-2030, USD Million
6.2.5.By End Use- Market Insights and Forecast 2020-2030, USD Million
6.2.6.By Sales Channel- Market Insights and Forecast 2020-2030, USD Million
7. India Vegetable Oils Market Outlook, 2020-2030F
7.1. Market Size & Growth Outlook
7.1.1.By Revenues in US$ Million
7.1.2.By Quantity Sold in Million Litres
7.2. Market Segmentation & Growth Outlook
7.2.1.By Type- Market Insights and Forecast 2020-2030, USD Million
7.2.2.By Application- Market Insights and Forecast 2020-2030, USD Million
7.2.3.By Extraction Type- Market Insights and Forecast 2020-2030, USD Million
7.2.4.By Packaging Type- Market Insights and Forecast 2020-2030, USD Million
7.2.5.By End Use- Market Insights and Forecast 2020-2030, USD Million
7.2.6.By Sales Channel- Market Insights and Forecast 2020-2030, USD Million
8. India Animal-Derived Oils Market Outlook, 2020-2030F
8.1. Market Size & Growth Outlook
8.1.1.By Revenues in US$ Million
8.1.2.By Quantity Sold in Million Litres
8.2. Market Segmentation & Growth Outlook
8.2.1.By Type- Market Insights and Forecast 2020-2030, USD Million
8.2.2.By Application- Market Insights and Forecast 2020-2030, USD Million
8.2.3.By Extraction Type- Market Insights and Forecast 2020-2030, USD Million
8.2.4.By Packaging Type- Market Insights and Forecast 2020-2030, USD Million
8.2.5.By End Use- Market Insights and Forecast 2020-2030, USD Million
8.2.6.By Sales Channel- Market Insights and Forecast 2020-2030, USD Million
9. India Palm Oils Market Outlook, 2020-2030F
9.1. Market Size & Growth Outlook
9.1.1.By Revenues in US$ Million
9.1.2.By Quantity Sold in Million Litres
9.2. Market Segmentation & Growth Outlook
9.2.1.By Type- Market Insights and Forecast 2020-2030, USD Million
9.2.2.By Application- Market Insights and Forecast 2020-2030, USD Million
9.2.3.By Extraction Type- Market Insights and Forecast 2020-2030, USD Million
9.2.4.By Packaging Type- Market Insights and Forecast 2020-2030, USD Million
9.2.5.By End Use- Market Insights and Forecast 2020-2030, USD Million
9.2.6.By Sales Channel- Market Insights and Forecast 2020-2030, USD Million
10. Competitive Outlook
10.1. Company Profiles
10.1.1. Adani Group
10.1.1.1. Business Description
10.1.1.2. Product Portfolio
10.1.1.3. Collaborations & Alliances
10.1.1.4. Recent Developments
10.1.1.5. Financial Details
10.1.1.6. Others
10.1.2. Ruchi Soya Industries Ltd
10.1.2.1. Business Description
10.1.2.2. Product Portfolio
10.1.2.3. Collaborations & Alliances
10.1.2.4. Recent Developments
10.1.2.5. Financial Details
10.1.2.6. Others
10.1.3. Emami Ltd
10.1.3.1. Business Description
10.1.3.2. Product Portfolio
10.1.3.3. Collaborations & Alliances
10.1.3.4. Recent Developments
10.1.3.5. Financial Details
10.1.3.6. Others
10.1.4. Cargill India Pvt Ltd
10.1.4.1. Business Description
10.1.4.2. Product Portfolio
10.1.4.3. Collaborations & Alliances
10.1.4.4. Recent Developments
10.1.4.5. Financial Details
10.1.4.6. Others
10.1.5. Kaleesuwari Refinery Pvt Ltd
10.1.5.1. Business Description
10.1.5.2. Product Portfolio
10.1.5.3. Collaborations & Alliances
10.1.5.4. Recent Developments
10.1.5.5. Financial Details
10.1.5.6. Others
10.1.6. Mother Dairy Fruit & Vegetable Pvt Ltd
10.1.6.1. Business Description
10.1.6.2. Product Portfolio
10.1.6.3. Collaborations & Alliances
10.1.6.4. Recent Developments
10.1.6.5. Financial Details
10.1.6.6. Others
10.1.7. VVV & Sons Marico Ltd
10.1.7.1. Business Description
10.1.7.2. Product Portfolio
10.1.7.3. Collaborations & Alliances
10.1.7.4. Recent Developments
10.1.7.5. Financial Details
10.1.7.6. Others
10.1.8. M K Agrotech Pvt Ltd
10.1.8.1. Business Description
10.1.8.2. Product Portfolio
10.1.8.3. Collaborations & Alliances
10.1.8.4. Recent Developments
10.1.8.5. Financial Details
10.1.8.6. Others
10.1.9. Patanjali Ayurved Ltd
10.1.9.1. Business Description
10.1.9.2. Product Portfolio
10.1.9.3. Collaborations & Alliances
10.1.9.4. Recent Developments
10.1.9.5. Financial Details
10.1.9.6. Others
10.1.10. Agro Tech Foods Ltd
10.1.10.1.Business Description
10.1.10.2.Product Portfolio
10.1.10.3.Collaborations & Alliances
10.1.10.4.Recent Developments
10.1.10.5.Financial Details
10.1.10.6.Others
11. Disclaimer
| Segment | Sub-Segment |
|---|---|
| By Type |
|
| By Application |
|
| By Extraction Type |
|
| By Packaging Type |
|
| By End Use |
|
| By Sales Channel |
|
Research Methodology
This study followed a structured approach comprising four key phases to assess the size and scope of the electro-oxidation market. The process began with thorough secondary research to collect data on the target market, related markets, and broader industry context. These findings, along with preliminary assumptions and estimates, were then validated through extensive primary research involving industry experts from across the value chain. To calculate the overall market size, both top-down and bottom-up methodologies were employed. Finally, market segmentation and data triangulation techniques were applied to refine and validate segment-level estimations.
Secondary Research
The secondary research phase involved gathering data from a wide range of credible and published sources. This step helped in identifying industry trends, defining market segmentation, and understanding the market landscape and value chain.
Sources consulted during this phase included:
- Company annual reports, investor presentations, and press releases
- Industry white papers and certified publications
- Trade directories and market-recognized databases
- Articles from authoritative authors and reputable journals
- Gold and silver standard websites
Secondary research was critical in mapping out the industry's value chain and monetary flow, identifying key market segments, understanding regional variations, and tracking significant industry developments.
Other key sources:
- Financial disclosures
- Industry associations and trade bodies
- News outlets and business magazines
- Academic journals and research studies
- Paid industry databases
Primary Research
To validate secondary data and gain deeper market insights, primary research was conducted with key stakeholders across both the supply and demand sides of the market.
On the demand side, participants included decision-makers and influencers from end-user industries—such as CIOs, CTOs, and CSOs—who provided first-hand perspectives on market needs, product usage, and future expectations.
On the supply side, interviews were conducted with manufacturers, industry associations, and institutional participants to gather insights into current offerings, product pipelines, and market challenges.
Primary interviews provided critical inputs such as:
- Market size and revenue data
- Product and service breakdowns
- Market forecasts
- Regional and application-specific trends
Stakeholders consulted included:
- Leading OEM and solution providers
- Channel and distribution partners
- End users across various applications
- Independent consultants and industry specialists
Market Size Estimation and Data Triangulation
- Identifying Key Market Participants (Secondary Research)
- Goal: To identify the major players or companies in the target market. This typically involves using publicly available data sources such as industry reports, market research publications, and financial statements of companies.
- Tools: Reports from firms like Gartner, Forrester, Euromonitor, Statista, IBISWorld, and others. Public financial statements, news articles, and press releases from top market players.
- Extracting Earnings of Key Market Participants
- Goal: To estimate the earnings generated from the product or service being analyzed. This step helps in understanding the revenue potential of each market player in a specific geography.
- Methods: Earnings data can be gathered from:
- Publicly available financial reports (for listed companies).
- Interviews and primary data sources from professionals, such as Directors, VPs, SVPs, etc. This is especially useful for understanding more nuanced, internal data that isn't publicly disclosed.
- Annual reports and investor presentations of key players.
- Data Collation and Development of a Relevant Data Model
- Goal: To collate inputs from both primary and secondary sources into a structured, data-driven model for market estimation. This model will incorporate key market KPIs and any independent variables relevant to the market.
- Key KPIs: These could include:
- Market size, growth rate, and demand drivers.
- Industry-specific metrics like market share, average revenue per customer (ARPC), or average deal size.
- External variables, such as economic growth rates, inflation rates, or commodity prices, that could affect the market.
- Data Modeling: Based on this data, the market forecasts are developed for the next 5 years. A combination of trend analysis, scenario modeling, and statistical regression might be used to generate projections.
- Scenario Analysis
- Goal: To test different assumptions and validate how sensitive the market is to changes in key variables (e.g., market demand, regulatory changes, technological disruptions).
- Types of Scenarios:
- Base Case: Based on current assumptions and historical data.
- Best-Case Scenario: Assuming favorable market conditions, regulatory environments, and technological advancements.
- Worst-Case Scenario: Accounting for adverse factors, such as economic downturns, stricter regulations, or unexpected disruptions.


