Global High-Definition Mapping for Autonomous Vehicles Market Report: Trends, Growth and Forecast (2026-2032)
By Vehicle Type (Passenger Vehicle, Commercial Vehicle), By Deployment Architecture (Cloud-Based, Embedded), By Level of Automation (Semi-Autonomous (SAE Level 2-3), Fully Autonomous (SAE Level 4-5)), By Service Type (Mapping, Localization, Updates & Maintenance, Others), By Region (North America, South America, Europe, Middle East and Africa, Asia Pacific) ... Read more
|
Major Players
|
Global High-Definition Mapping for Autonomous Vehicles Market Statistics and Insights, 2026
- Market Size Statistics
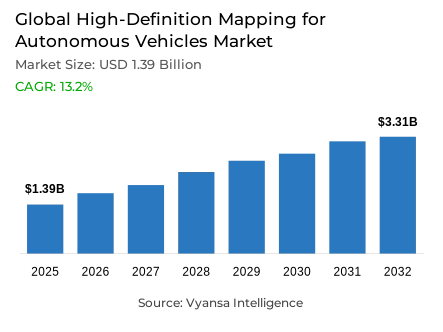
- High-Definition Mapping for Autonomous Vehicles market size was valued at USD 1.39 billion in 2025 and is estimated at USD 1.44 billion in 2026.
- The market size is expected to grow to USD 3.31 billion by 2032.
- Market to register a CAGR of around 13.2% during 2026-32.
- Vehicle Type Shares
- Passenger vehicle grabbed market share of 70%.
- Competition
- Global high-definition mapping for autonomous vehicles market is currently being catered to by more than 10 companies.
- Top 5 companies acquired around 10% of the market share in 2026.
- AutoNavi Software Co. Ltd., NVIDIA Corporation, Waymo LLC, HERE Global B.V., TomTom N.V. etc., are few of the top companies.
- Deployment Architecture
- Cloud-based grabbed 65% of the market.
- Region
- North America leads with a 45% share of the global market.
Global High-Definition Mapping for Autonomous Vehicles Market Outlook
The HD mapping for autonomous vehicles market covers lane-level digital road models, localization layers, road attributes, traffic signs, curvature, speed rules, and update services used by OEMs, robotaxi operators, Tier-1 suppliers, and autonomous software platforms. Valued at USD 1.39 billion in 2025, USD 1.44 billion in 2026, and USD 3.31 billion by 2032, the industry is scaling at a CAGR of 13.2% during 2026-2032 across commercial programs.
Automated driving programs are raising demand for centimeter-level localization, sensor fusion support, and real-time map updates as vehicles move from assisted highway functions toward defined-domain autonomy. The HD mapping for autonomous vehicles market benefits when safety agencies, city pilots, and commercial robotaxi deployments require validated road context beyond onboard perception, especially in dense urban corridors, multilane highway environments, construction zones, and geofenced operating domains where map freshness directly supports safety-case documentation.
Economic impact is concentrated around software-defined vehicle platforms, fleet utilization, map licensing, cloud processing, and continuous maintenance. For automotive OEMs and mobility operators, the industry improves procurement visibility because map layers support path planning, prediction, and operational redundancy while reducing dependence on repeated survey drives across fast-changing road networks. This creates recurring demand for validation services, data governance, and integration partnerships across autonomous mobility supply chains.
Adoption momentum in 2026 is shaped by OEM software-stack integration, AI-powered mapmaking, and expanding autonomous ride-hailing footprints. The HD mapping for autonomous vehicles market is also becoming more competitive as HERE, TomTom, Mobileye, Baidu Apollo, Waymo, NVIDIA, NavInfo, and regional mapping specialists position lane-level map data, cloud-based HD maps, and autonomous vehicle HD maps as core infrastructure for scalable automation, compliance readiness, and cross-market deployment. Procurement priorities favor scalable coverage, automated validation, and interoperable location data.

Global High-Definition Mapping for Autonomous Vehicles Market Growth Driver
Precision Driving Demand Accelerates Adoption
Robotaxi commercialization and higher-automation ADAS are increasing demand for validated lane-level maps because automated vehicles need predictive road context before sensors confirm the scene. The HD mapping for autonomous vehicles market gains adoption as operators expand service areas, add routes, and require dependable localization maps that support route planning, fail-safe navigation, remote fleet supervision, and high-frequency road-change detection across complex urban operating domains. These requirements lift demand for localization services, map update services, and embedded autonomy support.
Waymo reported more than 14 million fully autonomous trips in 2025 and said it began serving more than 1 million fully autonomous rides per month, creating a larger operating base for continuous map validation. This scale strengthens the global high-definition (HD) mapping for autonomous vehicles industry by converting real-world driving operations into recurring demand for updates, localization, maintenance, and route-level quality assurance across commercial fleets. Suppliers with live-data access gain stronger renewal potential.
Global High-Definition Mapping for Autonomous Vehicles Market Challenge
Map Freshness and Coverage Complexity Restrict Scale
Large-area map creation remains constrained by cost, update latency, and validation complexity because HD map layers must reflect construction zones, lane changes, speed-rule revisions, and temporary road restrictions. The HD mapping for autonomous vehicles market faces procurement friction when suppliers must guarantee freshness across multiple countries while meeting safety, privacy, and geospatial compliance requirements, especially where autonomous fleets operate across mixed urban and highway corridors. Fragmented road rules raise quality assurance workloads for cross-border deployments.
Mobileye notes that conventional HD mapping often relies on dedicated mapping fleets with costly sensors, manual or semi-automatic processes, and infrequent updates, while its REM approach uses crowdsourced data packets and near-real-time change detection. This pressure affects the global high-definition (HD) mapping for autonomous vehicles industry by favoring scalable update architectures over survey-heavy operating models, creating higher barriers for providers without vehicle-data partnerships or automated validation pipelines. This limits pricing flexibility and slows smaller-provider participation.
Unlock Market Intelligence
Explore the market potential with our data-driven report
Global High-Definition Mapping for Autonomous Vehicles Market Trend
AI-Native Lane Geometry Redraws Competitive Positioning
AI-enabled map generation is shifting competition from static survey databases toward continuously refreshed, multi-source mapping platforms. The HD mapping for autonomous vehicles market is moving toward lane-level road data, semantic maps, and behavioral speed intelligence that can be embedded into automated driving stacks to support smoother decisions at intersections, merges, roundabouts, adverse-visibility locations, and road layouts where onboard perception alone has limited foresight. Suppliers are therefore prioritizing automated extraction, vectorization, and quality checks.
TomTom stated in January 2025 that Orbis Maps added immersive 3D lane geometry for all road types, using AI-enabled updates, production-vehicle observations, dashcam inputs, aerial imagery, satellite imagery, and LiDAR survey data. This development strengthens the global high-definition (HD) mapping for autonomous vehicles industry by improving coverage economics and lowering barriers to autonomous navigation services, OEM integration, and real-time road network updates at scale. OEM buyers gain broader coverage with faster refresh cycles and lower integration risk.
Global High-Definition Mapping for Autonomous Vehicles Market Opportunity
Driverless Commercial Fleets Open New Monetization Pathways
Autonomous ride-hailing expansion creates an opportunity for map suppliers to move beyond one-time data licensing into fleet-linked update, localization, and maintenance contracts. The HD mapping for autonomous vehicles market can capture higher recurring value where operators need city-specific semantic layers, road-change detection, high-precision localization, cloud-based quality assurance, and operational support for commercial driverless services in regulated smart mobility zones. This creates defensible service revenue beyond baseline map compilation and navigation internationally.
Baidu Apollo Go and AutoGo launched fully autonomous commercial ride-hailing on Yas Island in January 2026 after securing a fully driverless commercial permit, with phased expansion planned across Abu Dhabi islands and a target to scale hundreds of vehicles by 2026. This supports the global high-definition (HD) mapping for autonomous vehicles industry by expanding demand in regulated smart-mobility corridors, where localization accuracy and map maintenance are procurement-critical. Suppliers can localize products around permitting, route expansion, and fleet uptime requirements.
Global High-Definition Mapping for Autonomous Vehicles Market Regional Analysis

By Region
- North America
- South America
- Europe
- Middle East and Africa
- Asia Pacific
North America holds 45% share, supported by U.S. robotaxi deployment density, regulatory monitoring, AV testing ecosystems, and supplier concentration across mapping, AI compute, and mobility platforms. The HD mapping for autonomous vehicles market benefits from commercial ride-hailing routes, public-road testing, autonomous fleet manufacturing capacity, and city-level operating data that collectively improve road-data availability and operational learning. Stronger municipal engagement and state-level testing visibility improve commercialization pathways for mapping providers across multiple metropolitan operating areas.
Waymo’s official blog reported in 2026 that its 24/7 autonomous ride-hailing service would cover more than 1,400 square miles across 11 cities after expansions in Miami, Austin, Atlanta, Houston, and the San Francisco Bay Area. This strengthens the global high-definition (HD) mapping for autonomous vehicles industry by anchoring high-frequency map maintenance in major U.S. markets, supporting regional supplier positioning and commercial deployment confidence. The region also concentrates early OEM partnerships, AI infrastructure, and regulatory feedback loops.
Unlock Market Intelligence
Explore the market potential with our data-driven report
Global High-Definition Mapping for Autonomous Vehicles Market Segmentation Analysis
By Vehicle Type
- Passenger Vehicle
- Commercial Vehicle
Passenger Vehicle holds 70% share because robotaxis, premium ADAS programs, and personal mobility platforms generate the most immediate demand for lane-level positioning and autonomous navigation. The HD mapping for autonomous vehicles market is concentrated around passenger fleets because these vehicles require dense urban map coverage, frequent OTA map updates, high-precision localization, and validated semantic layers for safe rider-only operations. Passenger services also provide repeatable route density, improving validation efficiency for suppliers over time.
Waymo said its Mesa integration plant will build thousands of Jaguar I-PACEs fitted with fully autonomous technology, while its fleet already included more than 1,500 vehicles across San Francisco, Los Angeles, Phoenix, and Austin. This passenger-vehicle capacity supports the global high-definition (HD) mapping for autonomous vehicles industry by strengthening map-update volume, supplier planning, sensor-map calibration demand, and fleet deployment readiness across passenger mobility services. The segment therefore guides near-term feature prioritization, coverage investment, and partner selection decisions.

By Deployment Architecture
- Cloud-Based
- Embedded
Cloud-Based holds 65% share because continuous road-change detection, scalable storage, and over-the-air map distribution are central to commercial automated driving. The HD mapping for autonomous vehicles market depends on cloud architecture to synchronize crowdsourced vehicle observations, validation pipelines, semantic map layers, and software-defined vehicle platforms without forcing every vehicle to carry complete onboard map inventories or regional datasets. This architecture also improves auditability, version control, and compliance traceability across vehicle programs during certification, audits, and recalls.
TomTom’s automated-driving product page describes Orbis Maps as a fresh, scalable, customizable solution with accurate road geometry, high-precision localization, and real-time road network updates for all automation levels. This reinforces the global high-definition (HD) mapping for autonomous vehicles industry by making cloud-based HD maps a core procurement requirement for OEM software stacks, continuous maintenance programs, and connected vehicle map updates consistently. It also enables faster deployment across markets where local road rules change frequently.
Market Players in Global High-Definition Mapping for Autonomous Vehicles Market
These market players maintain a significant presence in the Global high-definition mapping for autonomous vehicles market and contribute to its ongoing evolution.
- AutoNavi Software Co. Ltd.
- NVIDIA Corporation
- Waymo LLC
- HERE Global B.V.
- TomTom N.V.
- Baidu Apollo
- NavInfo Co. Ltd.
- Dynamic Map Platform Co. Ltd.
- Mobileye Vision Technologies Ltd.
- ZENRIN CO. LTD.
- Woven by Toyota
- CE Info Systems Limited (MapmyIndia)
Market News & Updates
- Dynamic Map Platform Co. Ltd., 2026:
Advanced EyeSight Driver Assist Technology on the 2026 Subaru Outback. The system adds HD map support for Highway Hands-Free Assist, Emergency Stop Assist with Safe Lane Selection, Highway Active Lane Change Assist, Pre-Curve Speed Control, and Automatic Resume Assist. The update supports lane-level map use in higher-automation ADAS programs.
- HERE Global B.V., 2025:
HERE Global B.V. and AWS introduced SceneXtract in 2025 as a software tool for recreating real-world environments for ADAS and automated-driving simulation. The tool integrates HERE HD Live Map with AWS services, supports natural-language scene search, and exports simulation-ready scenes in OpenDRIVE format. The release supports map-based validation workflows for autonomous driving software development.
Frequently Asked Questions
Related Report
- Market Segmentation
- Research Scope
- Research Methodology
- Definitions and Assumptions
- Executive Summary
- Global High-Definition (HD) Mapping for Autonomous Vehicles Market Policies, Regulations, and Standards
- Global High-Definition (HD) Mapping for Autonomous Vehicles Market Dynamics
- Growth Factors
- Challenges
- Trends
- Opportunities
- Global High-Definition (HD) Mapping for Autonomous Vehicles Market Statistics, 2022-2032F
- Market Size & Growth Outlook
- By Revenues in USD Million
- Market Segmentation & Growth Outlook
- By Vehicle Type
- Passenger Vehicle- Market Insights and Forecast 2022-2032, USD Million
- Commercial Vehicle- Market Insights and Forecast 2022-2032, USD Million
- By Deployment Architecture
- Cloud-Based- Market Insights and Forecast 2022-2032, USD Million
- Embedded- Market Insights and Forecast 2022-2032, USD Million
- By Level of Automation
- Semi-Autonomous (SAE Level 2-3)- Market Insights and Forecast 2022-2032, USD Million
- Fully Autonomous (SAE Level 4-5)- Market Insights and Forecast 2022-2032, USD Million
- By Service Type
- Mapping
- Localization- Market Insights and Forecast 2022-2032, USD Million
- Updates & Maintenance- Market Insights and Forecast 2022-2032, USD Million
- Others- Market Insights and Forecast 2022-2032, USD Million
- By Region
- North America
- South America
- Europe
- Middle East and Africa
- Asia Pacific
- By Competitors
- Competition Characteristics
- Market Share & Analysis
- By Vehicle Type
- Market Size & Growth Outlook
- North America High-Definition (HD) Mapping for Autonomous Vehicles Market Statistics, 2022-2032F
- Market Size & Growth Outlook
- By Revenues in USD Million
- Market Segmentation & Growth Outlook
- By Vehicle Type- Market Insights and Forecast 2022-2032, USD Million
- By Deployment Architecture- Market Insights and Forecast 2022-2032, USD Million
- By Level of Automation- Market Insights and Forecast 2022-2032, USD Million
- By Service Type- Market Insights and Forecast 2022-2032, USD Million
- By Country
- The US
- Canada
- Mexico
- The US High-Definition (HD) Mapping for Autonomous Vehicles Market Statistics, 2022-2032F
- Market Size & Growth Outlook
- By Revenues in USD Million
- Market Segmentation & Growth Outlook
- By Vehicle Type- Market Insights and Forecast 2022-2032, USD Million
- By Deployment Architecture- Market Insights and Forecast 2022-2032, USD Million
- By Level of Automation- Market Insights and Forecast 2022-2032, USD Million
- By Service Type- Market Insights and Forecast 2022-2032, USD Million
- Market Size & Growth Outlook
- Canada High-Definition (HD) Mapping for Autonomous Vehicles Market Statistics, 2022-2032F
- Market Size & Growth Outlook
- By Revenues in USD Million
- Market Segmentation & Growth Outlook
- By Vehicle Type- Market Insights and Forecast 2022-2032, USD Million
- By Deployment Architecture- Market Insights and Forecast 2022-2032, USD Million
- By Level of Automation- Market Insights and Forecast 2022-2032, USD Million
- By Service Type- Market Insights and Forecast 2022-2032, USD Million
- Market Size & Growth Outlook
- Mexico High-Definition (HD) Mapping for Autonomous Vehicles Market Statistics, 2022-2032F
- Market Size & Growth Outlook
- By Revenues in USD Million
- Market Segmentation & Growth Outlook
- By Vehicle Type- Market Insights and Forecast 2022-2032, USD Million
- By Deployment Architecture- Market Insights and Forecast 2022-2032, USD Million
- By Level of Automation- Market Insights and Forecast 2022-2032, USD Million
- By Service Type- Market Insights and Forecast 2022-2032, USD Million
- Market Size & Growth Outlook
- Market Size & Growth Outlook
- South America High-Definition (HD) Mapping for Autonomous Vehicles Market Statistics, 2022-2032F
- Market Size & Growth Outlook
- By Revenues in USD Million
- Market Segmentation & Growth Outlook
- By Vehicle Type- Market Insights and Forecast 2022-2032, USD Million
- By Deployment Architecture- Market Insights and Forecast 2022-2032, USD Million
- By Level of Automation- Market Insights and Forecast 2022-2032, USD Million
- By Service Type- Market Insights and Forecast 2022-2032, USD Million
- By Country
- Brazil
- Argentina
- Rest of South America
- Brazil High-Definition (HD) Mapping for Autonomous Vehicles Market Statistics, 2022-2032F
- Market Size & Growth Outlook
- By Revenues in USD Million
- Market Segmentation & Growth Outlook
- By Vehicle Type- Market Insights and Forecast 2022-2032, USD Million
- By Deployment Architecture- Market Insights and Forecast 2022-2032, USD Million
- By Level of Automation- Market Insights and Forecast 2022-2032, USD Million
- By Service Type- Market Insights and Forecast 2022-2032, USD Million
- Market Size & Growth Outlook
- Argentina High-Definition (HD) Mapping for Autonomous Vehicles Market Statistics, 2022-2032F
- Market Size & Growth Outlook
- By Revenues in USD Million
- Market Segmentation & Growth Outlook
- By Vehicle Type- Market Insights and Forecast 2022-2032, USD Million
- By Deployment Architecture- Market Insights and Forecast 2022-2032, USD Million
- By Level of Automation- Market Insights and Forecast 2022-2032, USD Million
- By Service Type- Market Insights and Forecast 2022-2032, USD Million
- Market Size & Growth Outlook
- Market Size & Growth Outlook
- Europe High-Definition (HD) Mapping for Autonomous Vehicles Market Statistics, 2022-2032F
- Market Size & Growth Outlook
- By Revenues in USD Million
- Market Segmentation & Growth Outlook
- By Vehicle Type- Market Insights and Forecast 2022-2032, USD Million
- By Deployment Architecture- Market Insights and Forecast 2022-2032, USD Million
- By Level of Automation- Market Insights and Forecast 2022-2032, USD Million
- By Service Type- Market Insights and Forecast 2022-2032, USD Million
- By Country
- Germany
- France
- The UK
- Italy
- Spain
- Rest of Europe
- Germany High-Definition (HD) Mapping for Autonomous Vehicles Market Statistics, 2022-2032F
- Market Size & Growth Outlook
- By Revenues in USD Million
- Market Segmentation & Growth Outlook
- By Vehicle Type- Market Insights and Forecast 2022-2032, USD Million
- By Deployment Architecture- Market Insights and Forecast 2022-2032, USD Million
- By Level of Automation- Market Insights and Forecast 2022-2032, USD Million
- By Service Type- Market Insights and Forecast 2022-2032, USD Million
- Market Size & Growth Outlook
- France High-Definition (HD) Mapping for Autonomous Vehicles Market Statistics, 2022-2032F
- Market Size & Growth Outlook
- By Revenues in USD Million
- Market Segmentation & Growth Outlook
- By Vehicle Type- Market Insights and Forecast 2022-2032, USD Million
- By Deployment Architecture- Market Insights and Forecast 2022-2032, USD Million
- By Level of Automation- Market Insights and Forecast 2022-2032, USD Million
- By Service Type- Market Insights and Forecast 2022-2032, USD Million
- Market Size & Growth Outlook
- The UK High-Definition (HD) Mapping for Autonomous Vehicles Market Statistics, 2022-2032F
- Market Size & Growth Outlook
- By Revenues in USD Million
- Market Segmentation & Growth Outlook
- By Vehicle Type- Market Insights and Forecast 2022-2032, USD Million
- By Deployment Architecture- Market Insights and Forecast 2022-2032, USD Million
- By Level of Automation- Market Insights and Forecast 2022-2032, USD Million
- By Service Type- Market Insights and Forecast 2022-2032, USD Million
- Market Size & Growth Outlook
- Italy High-Definition (HD) Mapping for Autonomous Vehicles Market Statistics, 2022-2032F
- Market Size & Growth Outlook
- By Revenues in USD Million
- Market Segmentation & Growth Outlook
- By Vehicle Type- Market Insights and Forecast 2022-2032, USD Million
- By Deployment Architecture- Market Insights and Forecast 2022-2032, USD Million
- By Level of Automation- Market Insights and Forecast 2022-2032, USD Million
- By Service Type- Market Insights and Forecast 2022-2032, USD Million
- Market Size & Growth Outlook
- Spain High-Definition (HD) Mapping for Autonomous Vehicles Market Statistics, 2022-2032F
- Market Size & Growth Outlook
- By Revenues in USD Million
- Market Segmentation & Growth Outlook
- By Vehicle Type- Market Insights and Forecast 2022-2032, USD Million
- By Deployment Architecture- Market Insights and Forecast 2022-2032, USD Million
- By Level of Automation- Market Insights and Forecast 2022-2032, USD Million
- By Service Type- Market Insights and Forecast 2022-2032, USD Million
- Market Size & Growth Outlook
- Market Size & Growth Outlook
- Middle East and Africa High-Definition (HD) Mapping for Autonomous Vehicles Market Statistics, 2022-2032F
- Market Size & Growth Outlook
- By Revenues in USD Million
- Market Segmentation & Growth Outlook
- By Vehicle Type- Market Insights and Forecast 2022-2032, USD Million
- By Deployment Architecture- Market Insights and Forecast 2022-2032, USD Million
- By Level of Automation- Market Insights and Forecast 2022-2032, USD Million
- By Service Type- Market Insights and Forecast 2022-2032, USD Million
- By Country
- Saudi Arabia
- The UAE
- South Africa
- Iran
- Rest of Middle East and Africa
- Saudi Arabia High-Definition (HD) Mapping for Autonomous Vehicles Market Statistics, 2022-2032F
- Market Size & Growth Outlook
- By Revenues in USD Million
- Market Segmentation & Growth Outlook
- By Vehicle Type- Market Insights and Forecast 2022-2032, USD Million
- By Deployment Architecture- Market Insights and Forecast 2022-2032, USD Million
- By Level of Automation- Market Insights and Forecast 2022-2032, USD Million
- By Service Type- Market Insights and Forecast 2022-2032, USD Million
- Market Size & Growth Outlook
- The UAE High-Definition (HD) Mapping for Autonomous Vehicles Market Statistics, 2022-2032F
- Market Size & Growth Outlook
- By Revenues in USD Million
- Market Segmentation & Growth Outlook
- By Vehicle Type- Market Insights and Forecast 2022-2032, USD Million
- By Deployment Architecture- Market Insights and Forecast 2022-2032, USD Million
- By Level of Automation- Market Insights and Forecast 2022-2032, USD Million
- By Service Type- Market Insights and Forecast 2022-2032, USD Million
- Market Size & Growth Outlook
- South Africa High-Definition (HD) Mapping for Autonomous Vehicles Market Statistics, 2022-2032F
- Market Size & Growth Outlook
- By Revenues in USD Million
- Market Segmentation & Growth Outlook
- By Vehicle Type- Market Insights and Forecast 2022-2032, USD Million
- By Deployment Architecture- Market Insights and Forecast 2022-2032, USD Million
- By Level of Automation- Market Insights and Forecast 2022-2032, USD Million
- By Service Type- Market Insights and Forecast 2022-2032, USD Million
- Market Size & Growth Outlook
- Iran High-Definition (HD) Mapping for Autonomous Vehicles Market Statistics, 2022-2032F
- Market Size & Growth Outlook
- By Revenues in USD Million
- Market Segmentation & Growth Outlook
- By Vehicle Type- Market Insights and Forecast 2022-2032, USD Million
- By Deployment Architecture- Market Insights and Forecast 2022-2032, USD Million
- By Level of Automation- Market Insights and Forecast 2022-2032, USD Million
- By Service Type- Market Insights and Forecast 2022-2032, USD Million
- Market Size & Growth Outlook
- Market Size & Growth Outlook
- Asia Pacific High-Definition (HD) Mapping for Autonomous Vehicles Market Statistics, 2022-2032F
- Market Size & Growth Outlook
- By Revenues in USD Million
- Market Segmentation & Growth Outlook
- By Vehicle Type- Market Insights and Forecast 2022-2032, USD Million
- By Deployment Architecture- Market Insights and Forecast 2022-2032, USD Million
- By Level of Automation- Market Insights and Forecast 2022-2032, USD Million
- By Service Type- Market Insights and Forecast 2022-2032, USD Million
- By Country
- China
- India
- Japan
- South Korea
- Thailand
- Rest of Asia Pacific
- China High-Definition (HD) Mapping for Autonomous Vehicles Market Statistics, 2022-2032F
- Market Size & Growth Outlook
- By Revenues in USD Million
- Market Segmentation & Growth Outlook
- By Vehicle Type- Market Insights and Forecast 2022-2032, USD Million
- By Deployment Architecture- Market Insights and Forecast 2022-2032, USD Million
- By Level of Automation- Market Insights and Forecast 2022-2032, USD Million
- By Service Type- Market Insights and Forecast 2022-2032, USD Million
- Market Size & Growth Outlook
- India High-Definition (HD) Mapping for Autonomous Vehicles Market Statistics, 2022-2032F
- Market Size & Growth Outlook
- By Revenues in USD Million
- Market Segmentation & Growth Outlook
- By Vehicle Type- Market Insights and Forecast 2022-2032, USD Million
- By Deployment Architecture- Market Insights and Forecast 2022-2032, USD Million
- By Level of Automation- Market Insights and Forecast 2022-2032, USD Million
- By Service Type- Market Insights and Forecast 2022-2032, USD Million
- Market Size & Growth Outlook
- Japan High-Definition (HD) Mapping for Autonomous Vehicles Market Statistics, 2022-2032F
- Market Size & Growth Outlook
- By Revenues in USD Million
- Market Segmentation & Growth Outlook
- By Vehicle Type- Market Insights and Forecast 2022-2032, USD Million
- By Deployment Architecture- Market Insights and Forecast 2022-2032, USD Million
- By Level of Automation- Market Insights and Forecast 2022-2032, USD Million
- By Service Type- Market Insights and Forecast 2022-2032, USD Million
- Market Size & Growth Outlook
- South Korea High-Definition (HD) Mapping for Autonomous Vehicles Market Statistics, 2022-2032F
- Market Size & Growth Outlook
- By Revenues in USD Million
- Market Segmentation & Growth Outlook
- By Vehicle Type- Market Insights and Forecast 2022-2032, USD Million
- By Deployment Architecture- Market Insights and Forecast 2022-2032, USD Million
- By Level of Automation- Market Insights and Forecast 2022-2032, USD Million
- By Service Type- Market Insights and Forecast 2022-2032, USD Million
- Market Size & Growth Outlook
- Thailand High-Definition (HD) Mapping for Autonomous Vehicles Market Statistics, 2022-2032F
- Market Size & Growth Outlook
- By Revenues in USD Million
- Market Segmentation & Growth Outlook
- By Vehicle Type- Market Insights and Forecast 2022-2032, USD Million
- By Deployment Architecture- Market Insights and Forecast 2022-2032, USD Million
- By Level of Automation- Market Insights and Forecast 2022-2032, USD Million
- By Service Type- Market Insights and Forecast 2022-2032, USD Million
- Market Size & Growth Outlook
- Market Size & Growth Outlook
- Competitive Outlook
- Company Profiles
- HERE Global B.V.
- Business Description
- Service Portfolio
- Collaborations & Alliances
- Recent Developments
- Financial Details
- Others
- TomTom N.V.
- Business Description
- Service Portfolio
- Collaborations & Alliances
- Recent Developments
- Financial Details
- Others
- Baidu Apollo
- Business Description
- Service Portfolio
- Collaborations & Alliances
- Recent Developments
- Financial Details
- Others
- NavInfo Co. Ltd.
- Business Description
- Service Portfolio
- Collaborations & Alliances
- Recent Developments
- Financial Details
- Others
- Dynamic Map Platform Co. Ltd.
- Business Description
- Service Portfolio
- Collaborations & Alliances
- Recent Developments
- Financial Details
- Others
- AutoNavi Software Co. Ltd.
- Business Description
- Service Portfolio
- Collaborations & Alliances
- Recent Developments
- Financial Details
- Others
- NVIDIA Corporation
- Business Description
- Service Portfolio
- Collaborations & Alliances
- Recent Developments
- Financial Details
- Others
- Waymo LLC
- Business Description
- Service Portfolio
- Collaborations & Alliances
- Recent Developments
- Financial Details
- Others
- Mobileye Vision Technologies Ltd.
- Business Description
- Service Portfolio
- Collaborations & Alliances
- Recent Developments
- Financial Details
- Others
- ZENRIN CO. LTD.
- Business Description
- Service Portfolio
- Collaborations & Alliances
- Recent Developments
- Financial Details
- Others
- Woven by Toyota Inc.
- Business Description
- Service Portfolio
- Collaborations & Alliances
- Recent Developments
- Financial Details
- Others
- CE Info Systems Limited (MapmyIndia)
- Business Description
- Service Portfolio
- Collaborations & Alliances
- Recent Developments
- Financial Details
- Others
- HERE Global B.V.
- Company Profiles
- Disclaimer
| Segment | Sub-Segment |
|---|---|
| By Vehicle Type |
|
| By Deployment Architecture |
|
| By Level of Automation |
|
| By Service Type |
|
| By Region |
|
Research Methodology
This study followed a structured approach comprising four key phases to assess the size and scope of the electro-oxidation market. The process began with thorough secondary research to collect data on the target market, related markets, and broader industry context. These findings, along with preliminary assumptions and estimates, were then validated through extensive primary research involving industry experts from across the value chain. To calculate the overall market size, both top-down and bottom-up methodologies were employed. Finally, market segmentation and data triangulation techniques were applied to refine and validate segment-level estimations.
Secondary Research
The secondary research phase involved gathering data from a wide range of credible and published sources. This step helped in identifying industry trends, defining market segmentation, and understanding the market landscape and value chain.
Sources consulted during this phase included:
- Company annual reports, investor presentations, and press releases
- Industry white papers and certified publications
- Trade directories and market-recognized databases
- Articles from authoritative authors and reputable journals
- Gold and silver standard websites
Secondary research was critical in mapping out the industry's value chain and monetary flow, identifying key market segments, understanding regional variations, and tracking significant industry developments.
Other key sources:
- Financial disclosures
- Industry associations and trade bodies
- News outlets and business magazines
- Academic journals and research studies
- Paid industry databases
Primary Research
To validate secondary data and gain deeper market insights, primary research was conducted with key stakeholders across both the supply and demand sides of the market.
On the demand side, participants included decision-makers and influencers from end-user industries—such as CIOs, CTOs, and CSOs—who provided first-hand perspectives on market needs, product usage, and future expectations.
On the supply side, interviews were conducted with manufacturers, industry associations, and institutional participants to gather insights into current offerings, product pipelines, and market challenges.
Primary interviews provided critical inputs such as:
- Market size and revenue data
- Product and service breakdowns
- Market forecasts
- Regional and application-specific trends
Stakeholders consulted included:
- Leading OEM and solution providers
- Channel and distribution partners
- End users across various applications
- Independent consultants and industry specialists
Market Size Estimation and Data Triangulation
- Identifying Key Market Participants (Secondary Research)
- Goal: To identify the major players or companies in the target market. This typically involves using publicly available data sources such as industry reports, market research publications, and financial statements of companies.
- Tools: Reports from firms like Gartner, Forrester, Euromonitor, Statista, IBISWorld, and others. Public financial statements, news articles, and press releases from top market players.
- Extracting Earnings of Key Market Participants
- Goal: To estimate the earnings generated from the product or service being analyzed. This step helps in understanding the revenue potential of each market player in a specific geography.
- Methods: Earnings data can be gathered from:
- Publicly available financial reports (for listed companies).
- Interviews and primary data sources from professionals, such as Directors, VPs, SVPs, etc. This is especially useful for understanding more nuanced, internal data that isn't publicly disclosed.
- Annual reports and investor presentations of key players.
- Data Collation and Development of a Relevant Data Model
- Goal: To collate inputs from both primary and secondary sources into a structured, data-driven model for market estimation. This model will incorporate key market KPIs and any independent variables relevant to the market.
- Key KPIs: These could include:
- Market size, growth rate, and demand drivers.
- Industry-specific metrics like market share, average revenue per customer (ARPC), or average deal size.
- External variables, such as economic growth rates, inflation rates, or commodity prices, that could affect the market.
- Data Modeling: Based on this data, the market forecasts are developed for the next 5 years. A combination of trend analysis, scenario modeling, and statistical regression might be used to generate projections.
- Scenario Analysis
- Goal: To test different assumptions and validate how sensitive the market is to changes in key variables (e.g., market demand, regulatory changes, technological disruptions).
- Types of Scenarios:
- Base Case: Based on current assumptions and historical data.
- Best-Case Scenario: Assuming favorable market conditions, regulatory environments, and technological advancements.
- Worst-Case Scenario: Accounting for adverse factors, such as economic downturns, stricter regulations, or unexpected disruptions.


