Global Green Cement Market Report: Trends, Growth and Forecast (2026-2032)
By Raw Material (Fly Ash, Slag, Recycled Aggregate, Silica Fumes, Others), By Product Type (Ekkomaxx Cement, Geopolymer Cement, Magnesium Oxychloride Cement, Calcium Sulfoaluminate Cement, Others), By Application (Residential, Commercial & Industrial, Infrastructure), By Region (North America, South America, Middle East & Africa, Europe, Asia Pacific) ... Read more
|
Major Players
|
Global Green Cement Market Statistics and Insights, 2026
- Market Size Statistics
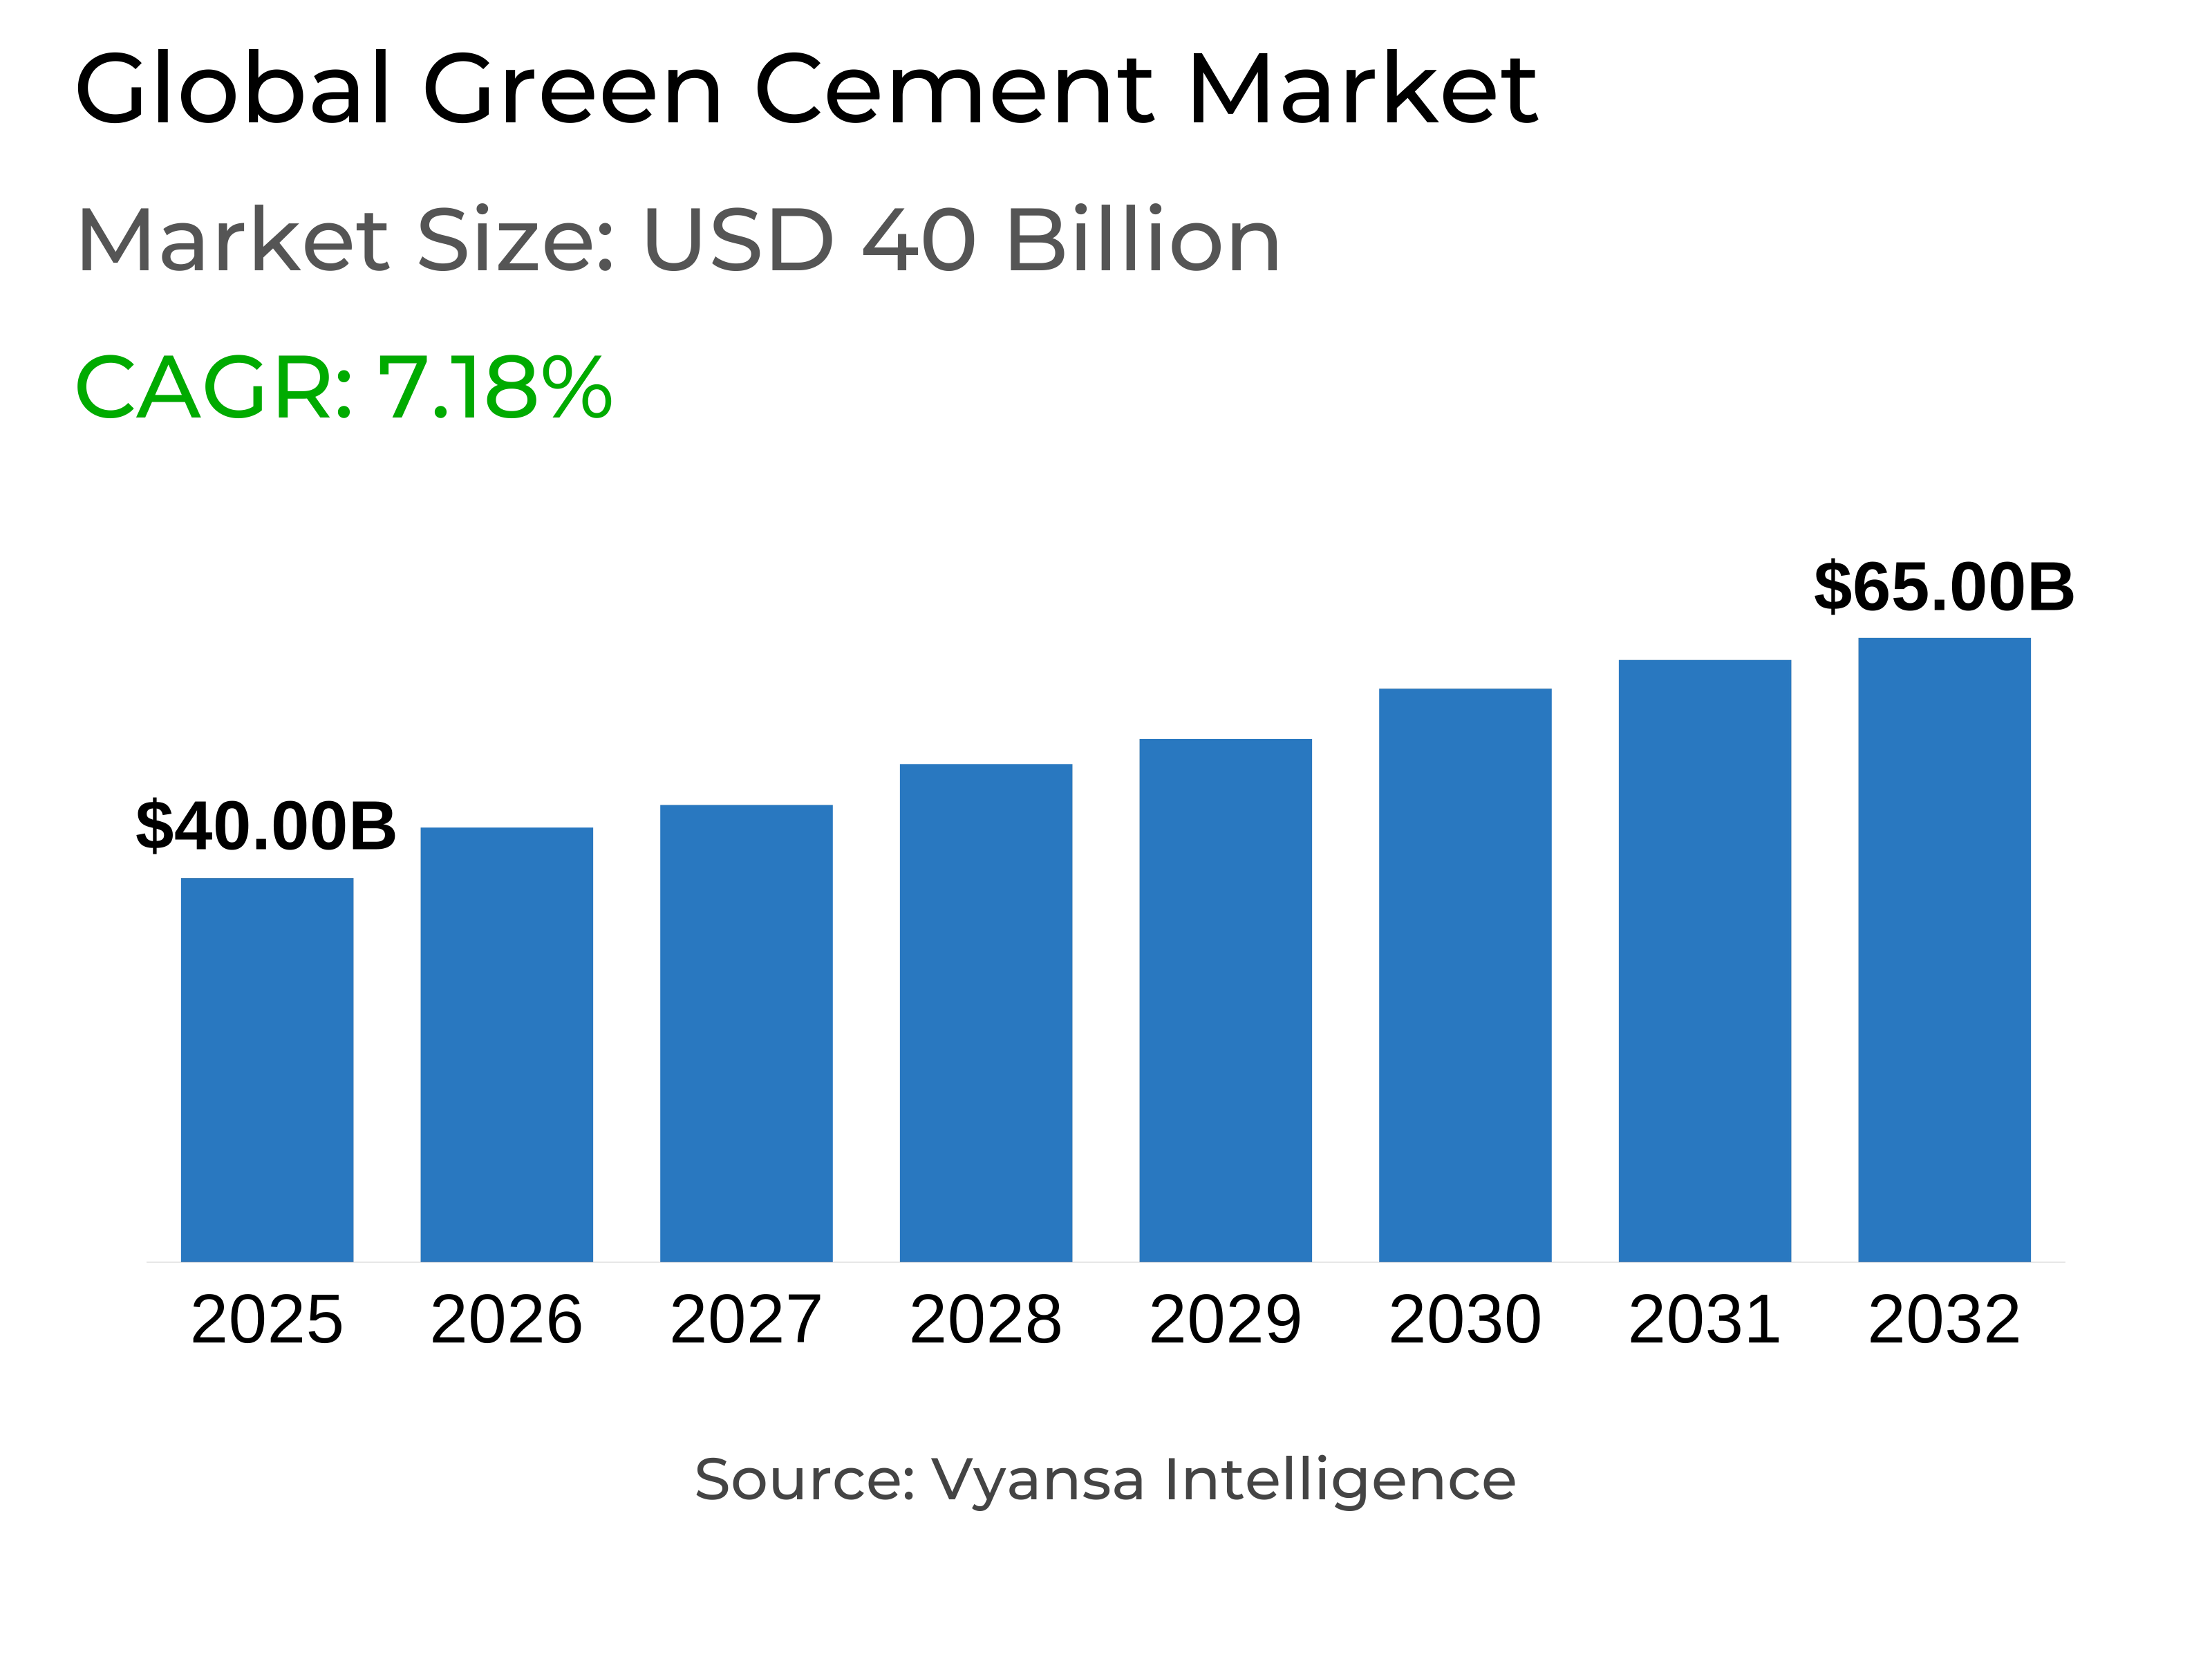
- Global green cement market is estimated at USD 40 billion.
- The market size is expected to grow to USD 65 billion by 2032.
- Market to register a cagr of around 7.18% during 2026-32.
- Raw Material Shares
- Fly ash grabbed market share of 40%.
- Competition
- More than 30 companies are actively engaged in producing green cement.
- Top 5 companies acquired around 40% of the market share.
- China National Building Material, Votorantim cimentos S.A., Anhui Conch Cement, Holcim Ltd., Heidelberg Cement (Heidelberg Materials) etc., are few of the top companies.
- Application
- Residential grabbed 50% of the market.
- Region
- North america leads with a 35% share of the global market.
Global Green Cement Market Outlook
Global Green Cement Market stands at approximately USD 40 billion in 2025 and is expected to expand to nearly USD 65 billion by 2032, at a CAGR of approximately 7.18% from 2026–2032. The market is growing as governments set stricter emission standards and carbon pricing schemes, forcing the cement industry to opt for low-carbon technology. Building regulations in the leading economies now impose carbon intensity constraints, turning green cement from a voluntary practice into a regulatory requirement for customers. Such policy-led change is reorienting construction material demand on both public and private sector infrastructure projects.
High capital costs and manufacturing expenses still pose challenges to the shift towards low-carbon cement. The International Energy Agency estimates investments of over USD 51 billion per year will be required to reach net-zero by 2050. Carbon capture utilization and storage (CCUS) is still essential but expensive, adding to price premiums that constrain uptake by smaller producers. Financial challenges notwithstanding, innovation in alternative fuels and additives like calcined clay and recycled glass is assisting with reducing cost and emissions.
Technology advances and unambiguous industry standards are speeding mainstream uptake. Initiatives such as Heidelberg Materials' Brevik plant for Norway's Longship program showcase efficient large-scale carbon capture. The release of ACI CODE-323-24 and Environmental Product Declarations is increasing builders' confidence by providing consistent low-carbon performance. These actions combined with government procurement standards promoting sustainable materials are doubling down on market preparedness for green building.
By raw material, fly ash commands approximately 40% of the world's share, aided by its established performance and availability, and residential building is leading applications with close to 50% of overall demand. Geographically, North America leads the market with a 35% share, boosted by robust regulatory environments, public infrastructure expenditure, and harmonization between the U.S. and Canada on sustainability objectives.

Global Green Cement Market Growth Driver
Sustainability Mandates Accelerating Material Transition
Decarbonization is now a top agenda for the cement sector as governments increase carbon pricing schemes and implement stricter emission controls. Cement manufacturers need to reduce emissions by 4% every year from 2020 to 2030 to reach the IEA Net Zero by 2050 Scenario, as stated by the Science Based Targets initiative. Conventional Portland cement still accounts for 7–8% of total CO₂ emissions, prompting compulsory use of low-carbon substitutes. Building regulations in a number of economies now require carbon intensity restrictions and alternative cementitious material application, moving low-carbon cement from a market choice to a statutory requirement for end users. This changing policy environment is transforming the demand for construction materials across both private and public projects.
Investments in infrastructure are also driving momentum to adopt sustainable cement. Projects like the U.S. Infrastructure Investment and Jobs Act are directing substantial funds towards decarbonized building materials. The sector has already reduced emissions by 23% since 1990, with technological viability established. Yet continued progress hinges on policy cooperation, increased carbon transportation infrastructure, and long-term procurement obligations spanning beyond single manufacturer efforts to influence more sustainable construction specifications around the world.
Global Green Cement Market Challenge
Escalating Implementation Costs Hindering Wider Adoption
Shifting to low-carbon cement manufacturing involves significant cost hurdles, with the International Energy Agency projecting yearly investment levels at over USD 51 billion for net-zero by 2050. Carbon capture utilization and storage (CCUS) is still vital but expensive, with abatement costs of USD 160–220/t CO₂ for early deployments. Therefore, CCUS-enabled cement now commands a 50–70% premium over regular cement, limiting uptake in price-sensitive markets and by smaller producers with shallow capital bases. Elevated production costs still hamper industry-wide transition in the face of increasing policy pressure to reduce emissions.
Alternative fuel supply chains and ancillary materials also pose financial burden. Hydrogen produced by electrolysis remains economically uneconomical without subsidies, and waste-derived fuels suffer from instability in both sourcing and processing. Capital-intensive upgrades in technology burden smaller producers, making them less able to cope, while larger producers have better economies of scale and infrastructure. This could further harden market structure as international producers take cost advantages to increase penetration in low-carbon cement production.
Unlock Market Intelligence
Explore the market potential with our data-driven report
Global Green Cement Market Trend
Technological Innovation and Standardization Shaping Market Direction
Accelerating tech advancement is reshaping emission reduction plans through a mix of alternative chemistries and enhanced process efficiencies. Carbon capture at scale is gaining increasing commercial viability with CCUS projects like the Norwegian Longship project backing Heidelberg Materials' Brevik facility. Calcined clay-based LC₃ cement achieves a carbon reduction of approximately 40% without compromising structure, while recycled glass pozzolans are becoming potential supplementary materials with the dwindling coal-based fly ash resources. These technologies represent intensifying diversification in the low-carbon cement technology environment.
Standardization advancements are also contributory to shaping adoption. The American Concrete Institute's ACI CODE-323-24 has established technical standards for low-carbon concrete use, providing uniform performance requirements for end users. Environmental Product Declarations are also adding to increased transparency through procurement processes, promoting specification certainty. Each of these developments builds the basis for large-scale adoption, enabling next-generation green cement innovations to transition from demonstration to widespread commercial use within world infrastructure and construction markets.
Global Green Cement Market Opportunity
Infrastructure Development Creating Strategic Growth Prospects
Stepping up investment in sustainable infrastructure presents large-scale growth opportunities for green cement manufacturers globally. Government procurement policies more and more commit to incorporating materials with confirmed low-carbon profiles, making environmentally certified cement a high-priority input for large-scale development projects. Programs under the U.S. Infrastructure Investment and Jobs Act and the EU Green Deal encourage the use of emission-reducing materials, supporting market preparedness for large-scale decarbonized infrastructure. Such initiatives have established a solid incentive for green cement use in transportation, energy, and urban development sectors.
Meanwhile, increased demand for certified green buildings is fueling long-term material substitution by private development. End users in the residential and commercial markets are harmonizing procurement practice with ESG standards, including emission measures within design and tender phases. Institutional and regulatory alignment is facilitating a structural shift in demand, which supports integrating sustainability as a performance factor throughout construction lifecycles, creating conducive conditions for ongoing expansion of low-carbon cement technologies in global markets.
Global Green Cement Market Regional Analysis

By Region
- North America
- South America
- Middle East & Africa
- Europe
- Asia Pacific
North America has a 35% global share of the green cement industry, driven by stringent carbon rules and increased investments in climate-friendly infrastructure. The United States cement production sector is exhibiting robust growth pace in low-carbon material uptake. Blended cement comprised 58% of total shipments in the first eight months of 2024, demonstrating a decisive sector move toward emissions-reducing formulations. Federal government efforts spearheaded by the U.S. General Services Administration now mandate the use of low-carbon materials in all government-funded buildings, creating steady demand for institutional and infrastructure projects. Non-residential construction accounted for around 62% of total cement demand in 2024, demonstrating its leadership in the large-scale decarbonization of construction activity.
Canada solidifies its regional position in the green cement market through favorable carbon pricing under the Output-Based Pricing System, which directly holds large producers accountable to reduce emissions. Canada's conformance to U.S. sustainability standards maximizes supply chain integration and harmonized procurement practices across North America. Increased LEED-certified building in both nations, with more than 110,000 buildings certified in the U.S. in 2024, reflects the region's focus on sustainable development. Together, these trends cement North America's position as a leader in the development of low-carbon cement production and infrastructure upgrade.
Unlock Market Intelligence
Explore the market potential with our data-driven report
Global Green Cement Market Segmentation Analysis

By Raw Material
- Fly Ash
- Slag
- Recycled Aggregate
- Silica Fumes
- Others
Fly ash holds around 40% under the raw material type segment of the global market share among supplementary cementitious materials, backed by established durability and extensive availability. The enhanced pozzolanic activity, price competitiveness, and performance advantages in sulfate resistance and alkali-silica mitigation. Its long history of approval in construction codes and established supply chains render it the go-to option for manufacturers looking at low-carbon products with secure supply chains and technical consistency.
Ground-granulated blast furnace slag is the second-largest raw material type, appreciated for equivalent performance and byproduct availability from steel production. Natural pozzolans like volcanic ash and pumice are taking on increasing significance as local, low-carbon alternatives. New SCMs like calcined clay, rice husk ash, and recycled glass pozzolans are moving from pilot schemes to regional commercialization. This changing blend highlights the market shift from industrial byproduct-based centralized dependence to decentralized regional resource use, fueling localized supply growth and price variation.
By Application
- Residential
- Commercial & Industrial
- Infrastructure
Application-wise, new residential construction contributes around 50% of overall green cement demand, spurred by expanding housing requirements and green building certification requirements. Single-family residence developments use large volumes of cement, while rising multi-family projects amplify total requirements. Constructors are embracing tested low-carbon materials to conform to sustainability levels, lowering embodied emissions in urban and suburban residential projects. This incorporation of environmental adherence in housing construction remains the largest proportion of total cement use.
Commercial, institutional, and infrastructure projects also see growing adoption, with public sector investment fueling procurement of certified green materials. Infrastructure uses—across transport, utilities, and renewable energy—are especially active, with financing for resilient, low-carbon building. Industrial buildings like data centers and renewable component manufacturing plants drive further diversification of demand. Combined, these uses represent a systemic market transformation towards sustainability-driven construction, where environmental performance actively informs material selection and project delivery.
Top Companies in Global Green Cement Market
The top companies operating in the market include China National Building Material, Votorantim cimentos S.A., Anhui Conch Cement, Holcim Ltd., Heidelberg Cement (Heidelberg Materials), CEMEX S.A.B. de C.V., UltraTech Cement Limited, CRH plc, Taiheiyo Cement Corporation, ACC Limited, Taiwan Cement Corporation, JSW Cement, CarbonCure Technologies Inc., Kiran Global Chems Limited, Fortera Corporation, etc., are the top players operating in the Global Green Cement Market.
Frequently Asked Questions
Related Report
1. Market Segmentation
1.1. Research Scope
1.2. Research Methodology
1.3. Definitions and Assumptions
2. Executive Summary
3. Global Green Cement Market Policies, Regulations, and Standards
4. Global Green Cement Market Dynamics
4.1. Growth Factors
4.2. Challenges
4.3. Trends
4.4. Opportunities
5. Global Green Cement Market Statistics, 2022-2032F
5.1. Market Size & Growth Outlook
5.1.1.By Revenues in US$ Million
5.2. Market Segmentation & Growth Outlook
5.2.1.By Raw Material
5.2.1.1. Fly Ash- Market Insights and Forecast 2022-2032, USD Million
5.2.1.2. Slag- Market Insights and Forecast 2022-2032, USD Million
5.2.1.3. Recycled Aggregate- Market Insights and Forecast 2022-2032, USD Million
5.2.1.4. Silica Fumes- Market Insights and Forecast 2022-2032, USD Million
5.2.1.5. Others- Market Insights and Forecast 2022-2032, USD Million
5.2.2.By Product Type
5.2.2.1. Ekkomaxx Cement- Market Insights and Forecast 2022-2032, USD Million
5.2.2.2. Geopolymer Cement- Market Insights and Forecast 2022-2032, USD Million
5.2.2.3. Magnesium Oxychloride Cement- Market Insights and Forecast 2022-2032, USD Million
5.2.2.4. Calcium Sulfoaluminate Cement- Market Insights and Forecast 2022-2032, USD Million
5.2.2.5. Others- Market Insights and Forecast 2022-2032, USD Million
5.2.3.By Application
5.2.3.1. Residential- Market Insights and Forecast 2022-2032, USD Million
5.2.3.2. Commercial & Industrial- Market Insights and Forecast 2022-2032, USD Million
5.2.3.3. Infrastructure- Market Insights and Forecast 2022-2032, USD Million
5.2.4.By Region
5.2.4.1. North America
5.2.4.2. South America
5.2.4.3. Middle East & Africa
5.2.4.4. Europe
5.2.4.5. Asia Pacific
5.2.5.By Competitors
5.2.5.1. Competition Characteristics
5.2.5.2. Market Share & Analysis
6. North America Green Cement Market Statistics, 2022-2032F
6.1. Market Size & Growth Outlook
6.1.1.By Revenues in US$ Million
6.2. Market Segmentation & Growth Outlook
6.2.1.By Raw Material- Market Insights and Forecast 2022-2032, USD Million
6.2.2.By Product Type- Market Insights and Forecast 2022-2032, USD Million
6.2.3.By Application- Market Insights and Forecast 2022-2032, USD Million
6.2.4.By Country
6.2.4.1. US
6.2.4.2. Canada
6.2.4.3. Mexico
6.2.4.4. Rest of North America
6.3. US Green Cement Market Statistics, 2022-2032F
6.3.1.Market Size & Growth Outlook
6.3.1.1. By Revenues in US$ Million
6.3.2.Market Segmentation & Growth Outlook
6.3.2.1. By Raw Material- Market Insights and Forecast 2022-2032, USD Million
6.3.2.2. By Product Type- Market Insights and Forecast 2022-2032, USD Million
6.4. Canada Green Cement Market Statistics, 2022-2032F
6.4.1.Market Size & Growth Outlook
6.4.1.1. By Revenues in US$ Million
6.4.2.Market Segmentation & Growth Outlook
6.4.2.1. By Raw Material- Market Insights and Forecast 2022-2032, USD Million
6.4.2.2. By Product Type- Market Insights and Forecast 2022-2032, USD Million
6.5. Mexico Green Cement Market Statistics, 2022-2032F
6.5.1.Market Size & Growth Outlook
6.5.1.1. By Revenues in US$ Million
6.5.2.Market Segmentation & Growth Outlook
6.5.2.1. By Raw Material- Market Insights and Forecast 2022-2032, USD Million
6.5.2.2. By Product Type- Market Insights and Forecast 2022-2032, USD Million
7. South America Green Cement Market Statistics, 2022-2032F
7.1. Market Size & Growth Outlook
7.1.1.By Revenues in US$ Million
7.2. Market Segmentation & Growth Outlook
7.2.1.By Raw Material- Market Insights and Forecast 2022-2032, USD Million
7.2.2.By Product Type- Market Insights and Forecast 2022-2032, USD Million
7.2.3.By Application- Market Insights and Forecast 2022-2032, USD Million
7.2.4.By Country
7.2.4.1. Brazil
7.2.4.2. Argentina
7.2.4.3. Rest of South America
7.3. Brazil Green Cement Market Statistics, 2022-2032F
7.3.1.Market Size & Growth Outlook
7.3.1.1. By Revenues in US$ Million
7.3.2.Market Segmentation & Growth Outlook
7.3.2.1. By Raw Material- Market Insights and Forecast 2022-2032, USD Million
7.3.2.2. By Product Type- Market Insights and Forecast 2022-2032, USD Million
7.4. Argentina Green Cement Market Statistics, 2022-2032F
7.4.1.Market Size & Growth Outlook
7.4.1.1. By Revenues in US$ Million
7.4.2.Market Segmentation & Growth Outlook
7.4.2.1. By Raw Material- Market Insights and Forecast 2022-2032, USD Million
7.4.2.2. By Product Type- Market Insights and Forecast 2022-2032, USD Million
8. Middle East & Africa Green Cement Market Statistics, 2022-2032F
8.1. Market Size & Growth Outlook
8.1.1.By Revenues in US$ Million
8.2. Market Segmentation & Growth Outlook
8.2.1.By Raw Material- Market Insights and Forecast 2022-2032, USD Million
8.2.2.By Product Type- Market Insights and Forecast 2022-2032, USD Million
8.2.3.By Application- Market Insights and Forecast 2022-2032, USD Million
8.2.4.By Country
8.2.4.1. Saudi Arabia
8.2.4.2. UAE
8.2.4.3. South Africa
8.2.4.4. Rest of Middle East & Africa
8.3. Saudi Arabia Green Cement Market Statistics, 2022-2032F
8.3.1.Market Size & Growth Outlook
8.3.1.1. By Revenues in US$ Million
8.3.2.Market Segmentation & Growth Outlook
8.3.2.1. By Raw Material- Market Insights and Forecast 2022-2032, USD Million
8.3.2.2. By Product Type- Market Insights and Forecast 2022-2032, USD Million
8.4. UAE Green Cement Market Statistics, 2022-2032F
8.4.1.Market Size & Growth Outlook
8.4.1.1. By Revenues in US$ Million
8.4.2.Market Segmentation & Growth Outlook
8.4.2.1. By Raw Material- Market Insights and Forecast 2022-2032, USD Million
8.4.2.2. By Product Type- Market Insights and Forecast 2022-2032, USD Million
8.5. South Africa Green Cement Market Statistics, 2022-2032F
8.5.1.Market Size & Growth Outlook
8.5.1.1. By Revenues in US$ Million
8.5.2.Market Segmentation & Growth Outlook
8.5.2.1. By Raw Material- Market Insights and Forecast 2022-2032, USD Million
8.5.2.2. By Product Type- Market Insights and Forecast 2022-2032, USD Million
9. Europe Green Cement Market Statistics, 2022-2032F
9.1. Market Size & Growth Outlook
9.1.1.By Revenues in US$ Million
9.2. Market Segmentation & Growth Outlook
9.2.1.By Raw Material- Market Insights and Forecast 2022-2032, USD Million
9.2.2.By Product Type- Market Insights and Forecast 2022-2032, USD Million
9.2.3.By Application- Market Insights and Forecast 2022-2032, USD Million
9.2.4.By Country
9.2.4.1. France
9.2.4.2. Germany
9.2.4.3. Italy
9.2.4.4. UK
9.2.4.5. Rest of Europe
9.3. France Green Cement Market Statistics, 2022-2032F
9.3.1.Market Size & Growth Outlook
9.3.1.1. By Revenues in US$ Million
9.3.2.Market Segmentation & Growth Outlook
9.3.2.1. By Raw Material- Market Insights and Forecast 2022-2032, USD Million
9.3.2.2. By Product Type- Market Insights and Forecast 2022-2032, USD Million
9.4. Germany Green Cement Market Statistics, 2022-2032F
9.4.1.Market Size & Growth Outlook
9.4.1.1. By Revenues in US$ Million
9.4.2.Market Segmentation & Growth Outlook
9.4.2.1. By Raw Material- Market Insights and Forecast 2022-2032, USD Million
9.4.2.2. By Product Type- Market Insights and Forecast 2022-2032, USD Million
9.5. Italy Green Cement Market Statistics, 2022-2032F
9.5.1.Market Size & Growth Outlook
9.5.1.1. By Revenues in US$ Million
9.5.2.Market Segmentation & Growth Outlook
9.5.2.1. By Raw Material- Market Insights and Forecast 2022-2032, USD Million
9.5.2.2. By Product Type- Market Insights and Forecast 2022-2032, USD Million
9.6. UK Green Cement Market Statistics, 2022-2032F
9.6.1.Market Size & Growth Outlook
9.6.1.1. By Revenues in US$ Million
9.6.2.Market Segmentation & Growth Outlook
9.6.2.1. By Raw Material- Market Insights and Forecast 2022-2032, USD Million
9.6.2.2. By Product Type- Market Insights and Forecast 2022-2032, USD Million
10. Asia Pacific Green Cement Market Statistics, 2022-2032F
10.1. Market Size & Growth Outlook
10.1.1. By Revenues in US$ Million
10.2. Market Segmentation & Growth Outlook
10.2.1. By Raw Material- Market Insights and Forecast 2022-2032, USD Million
10.2.2. By Product Type- Market Insights and Forecast 2022-2032, USD Million
10.2.3. By Application- Market Insights and Forecast 2022-2032, USD Million
10.2.4. By Country
10.2.4.1. China
10.2.4.2. Japan
10.2.4.3. India
10.2.4.4. South Korea
10.2.4.5. Rest of Asia Pacific
10.3. China Green Cement Market Statistics, 2022-2032F
10.3.1. Market Size & Growth Outlook
10.3.1.1. By Revenues in US$ Million
10.3.2. Market Segmentation & Growth Outlook
10.3.2.1. By Raw Material- Market Insights and Forecast 2022-2032, USD Million
10.3.2.2. By Product Type- Market Insights and Forecast 2022-2032, USD Million
10.4. Japan Green Cement Market Statistics, 2022-2032F
10.4.1. Market Size & Growth Outlook
10.4.1.1. By Revenues in US$ Million
10.4.2. Market Segmentation & Growth Outlook
10.4.2.1. By Raw Material- Market Insights and Forecast 2022-2032, USD Million
10.4.2.2. By Product Type- Market Insights and Forecast 2022-2032, USD Million
10.5. India Green Cement Market Statistics, 2022-2032F
10.5.1. Market Size & Growth Outlook
10.5.1.1. By Revenues in US$ Million
10.5.2. Market Segmentation & Growth Outlook
10.5.2.1. By Raw Material- Market Insights and Forecast 2022-2032, USD Million
10.5.2.2. By Product Type- Market Insights and Forecast 2022-2032, USD Million
10.6. South Korea Green Cement Market Statistics, 2022-2032F
10.6.1. Market Size & Growth Outlook
10.6.1.1. By Revenues in US$ Million
10.6.2. Market Segmentation & Growth Outlook
10.6.2.1. By Raw Material- Market Insights and Forecast 2022-2032, USD Million
10.6.2.2. By Product Type- Market Insights and Forecast 2022-2032, USD Million
11. Competitive Outlook
11.1. Company Profiles
11.1.1. Holcim Ltd.
11.1.1.1. Business Description
11.1.1.2. Product Portfolio
11.1.1.3. Collaborations & Alliances
11.1.1.4. Recent Developments
11.1.1.5. Financial Details
11.1.1.6. Others
11.1.2. Heidelberg Cement (Heidelberg Materials)
11.1.2.1. Business Description
11.1.2.2. Product Portfolio
11.1.2.3. Collaborations & Alliances
11.1.2.4. Recent Developments
11.1.2.5. Financial Details
11.1.2.6. Others
11.1.3. CEMEX S.A.B. de C.V.
11.1.3.1. Business Description
11.1.3.2. Product Portfolio
11.1.3.3. Collaborations & Alliances
11.1.3.4. Recent Developments
11.1.3.5. Financial Details
11.1.3.6. Others
11.1.4. UltraTech Cement Limited
11.1.4.1. Business Description
11.1.4.2. Product Portfolio
11.1.4.3. Collaborations & Alliances
11.1.4.4. Recent Developments
11.1.4.5. Financial Details
11.1.4.6. Others
11.1.5. CRH plc
11.1.5.1. Business Description
11.1.5.2. Product Portfolio
11.1.5.3. Collaborations & Alliances
11.1.5.4. Recent Developments
11.1.5.5. Financial Details
11.1.5.6. Others
11.1.6. China National Building Material
11.1.6.1. Business Description
11.1.6.2. Product Portfolio
11.1.6.3. Collaborations & Alliances
11.1.6.4. Recent Developments
11.1.6.5. Financial Details
11.1.6.6. Others
11.1.7. Votorantim cimentos S.A.
11.1.7.1. Business Description
11.1.7.2. Product Portfolio
11.1.7.3. Collaborations & Alliances
11.1.7.4. Recent Developments
11.1.7.5. Financial Details
11.1.7.6. Others
11.1.8. Anhui Conch Cement
11.1.8.1. Business Description
11.1.8.2. Product Portfolio
11.1.8.3. Collaborations & Alliances
11.1.8.4. Recent Developments
11.1.8.5. Financial Details
11.1.8.6. Others
11.1.9. Taiheiyo Cement Corporation
11.1.9.1. Business Description
11.1.9.2. Product Portfolio
11.1.9.3. Collaborations & Alliances
11.1.9.4. Recent Developments
11.1.9.5. Financial Details
11.1.9.6. Others
11.1.10. ACC Limited
11.1.10.1.Business Description
11.1.10.2.Product Portfolio
11.1.10.3.Collaborations & Alliances
11.1.10.4.Recent Developments
11.1.10.5.Financial Details
11.1.10.6.Others
11.1.11. Taiwan Cement Corporation
11.1.11.1.Business Description
11.1.11.2.Product Portfolio
11.1.11.3.Collaborations & Alliances
11.1.11.4.Recent Developments
11.1.11.5.Financial Details
11.1.11.6.Others
11.1.12. JSW Cement
11.1.12.1.Business Description
11.1.12.2.Product Portfolio
11.1.12.3.Collaborations & Alliances
11.1.12.4.Recent Developments
11.1.12.5.Financial Details
11.1.12.6.Others
11.1.13. CarbonCure Technologies Inc.
11.1.13.1.Business Description
11.1.13.2.Product Portfolio
11.1.13.3.Collaborations & Alliances
11.1.13.4.Recent Developments
11.1.13.5.Financial Details
11.1.13.6.Others
11.1.14. Kiran Global Chems Limited
11.1.14.1.Business Description
11.1.14.2.Product Portfolio
11.1.14.3.Collaborations & Alliances
11.1.14.4.Recent Developments
11.1.14.5.Financial Details
11.1.14.6.Others
11.1.15. Fortera Corporation
11.1.15.1.Business Description
11.1.15.2.Product Portfolio
11.1.15.3.Collaborations & Alliances
11.1.15.4.Recent Developments
11.1.15.5.Financial Details
11.1.15.6.Others
12. Disclaimer
| Segment | Sub-Segment |
|---|---|
| By Raw Material |
|
| By Product Type |
|
| By Application |
|
| By Region |
|
Research Methodology
This study followed a structured approach comprising four key phases to assess the size and scope of the electro-oxidation market. The process began with thorough secondary research to collect data on the target market, related markets, and broader industry context. These findings, along with preliminary assumptions and estimates, were then validated through extensive primary research involving industry experts from across the value chain. To calculate the overall market size, both top-down and bottom-up methodologies were employed. Finally, market segmentation and data triangulation techniques were applied to refine and validate segment-level estimations.
Secondary Research
The secondary research phase involved gathering data from a wide range of credible and published sources. This step helped in identifying industry trends, defining market segmentation, and understanding the market landscape and value chain.
Sources consulted during this phase included:
- Company annual reports, investor presentations, and press releases
- Industry white papers and certified publications
- Trade directories and market-recognized databases
- Articles from authoritative authors and reputable journals
- Gold and silver standard websites
Secondary research was critical in mapping out the industry's value chain and monetary flow, identifying key market segments, understanding regional variations, and tracking significant industry developments.
Other key sources:
- Financial disclosures
- Industry associations and trade bodies
- News outlets and business magazines
- Academic journals and research studies
- Paid industry databases
Primary Research
To validate secondary data and gain deeper market insights, primary research was conducted with key stakeholders across both the supply and demand sides of the market.
On the demand side, participants included decision-makers and influencers from end-user industries—such as CIOs, CTOs, and CSOs—who provided first-hand perspectives on market needs, product usage, and future expectations.
On the supply side, interviews were conducted with manufacturers, industry associations, and institutional participants to gather insights into current offerings, product pipelines, and market challenges.
Primary interviews provided critical inputs such as:
- Market size and revenue data
- Product and service breakdowns
- Market forecasts
- Regional and application-specific trends
Stakeholders consulted included:
- Leading OEM and solution providers
- Channel and distribution partners
- End users across various applications
- Independent consultants and industry specialists
Market Size Estimation and Data Triangulation
- Identifying Key Market Participants (Secondary Research)
- Goal: To identify the major players or companies in the target market. This typically involves using publicly available data sources such as industry reports, market research publications, and financial statements of companies.
- Tools: Reports from firms like Gartner, Forrester, Euromonitor, Statista, IBISWorld, and others. Public financial statements, news articles, and press releases from top market players.
- Extracting Earnings of Key Market Participants
- Goal: To estimate the earnings generated from the product or service being analyzed. This step helps in understanding the revenue potential of each market player in a specific geography.
- Methods: Earnings data can be gathered from:
- Publicly available financial reports (for listed companies).
- Interviews and primary data sources from professionals, such as Directors, VPs, SVPs, etc. This is especially useful for understanding more nuanced, internal data that isn't publicly disclosed.
- Annual reports and investor presentations of key players.
- Data Collation and Development of a Relevant Data Model
- Goal: To collate inputs from both primary and secondary sources into a structured, data-driven model for market estimation. This model will incorporate key market KPIs and any independent variables relevant to the market.
- Key KPIs: These could include:
- Market size, growth rate, and demand drivers.
- Industry-specific metrics like market share, average revenue per customer (ARPC), or average deal size.
- External variables, such as economic growth rates, inflation rates, or commodity prices, that could affect the market.
- Data Modeling: Based on this data, the market forecasts are developed for the next 5 years. A combination of trend analysis, scenario modeling, and statistical regression might be used to generate projections.
- Scenario Analysis
- Goal: To test different assumptions and validate how sensitive the market is to changes in key variables (e.g., market demand, regulatory changes, technological disruptions).
- Types of Scenarios:
- Base Case: Based on current assumptions and historical data.
- Best-Case Scenario: Assuming favorable market conditions, regulatory environments, and technological advancements.
- Worst-Case Scenario: Accounting for adverse factors, such as economic downturns, stricter regulations, or unexpected disruptions.


