Greece Sports Nutrition Market Report: Trends, Growth and Forecast (2026-2032)
Product Type (Sports Protein Products (Protein/Energy Bars, Sports Protein Powder, Sports Protein RTD), Sports Non-Protein Products), Sales Channel (Retail Offline, Retail Online), Ingredients (Vitamins and Minerals, Proteins and Amino Acids, Carbohydrates, Probiotics, Botanicals/Herbals, Others), Functionality (Energy, Muscle growth, Hydration, Weight Management, Others), End User (Bodybuilders, Athletes, Lifestyle Users) ... Read more
|
Major Players
|
Greece Sports Nutrition Market Statistics and Insights, 2026
- Market Size Statistics
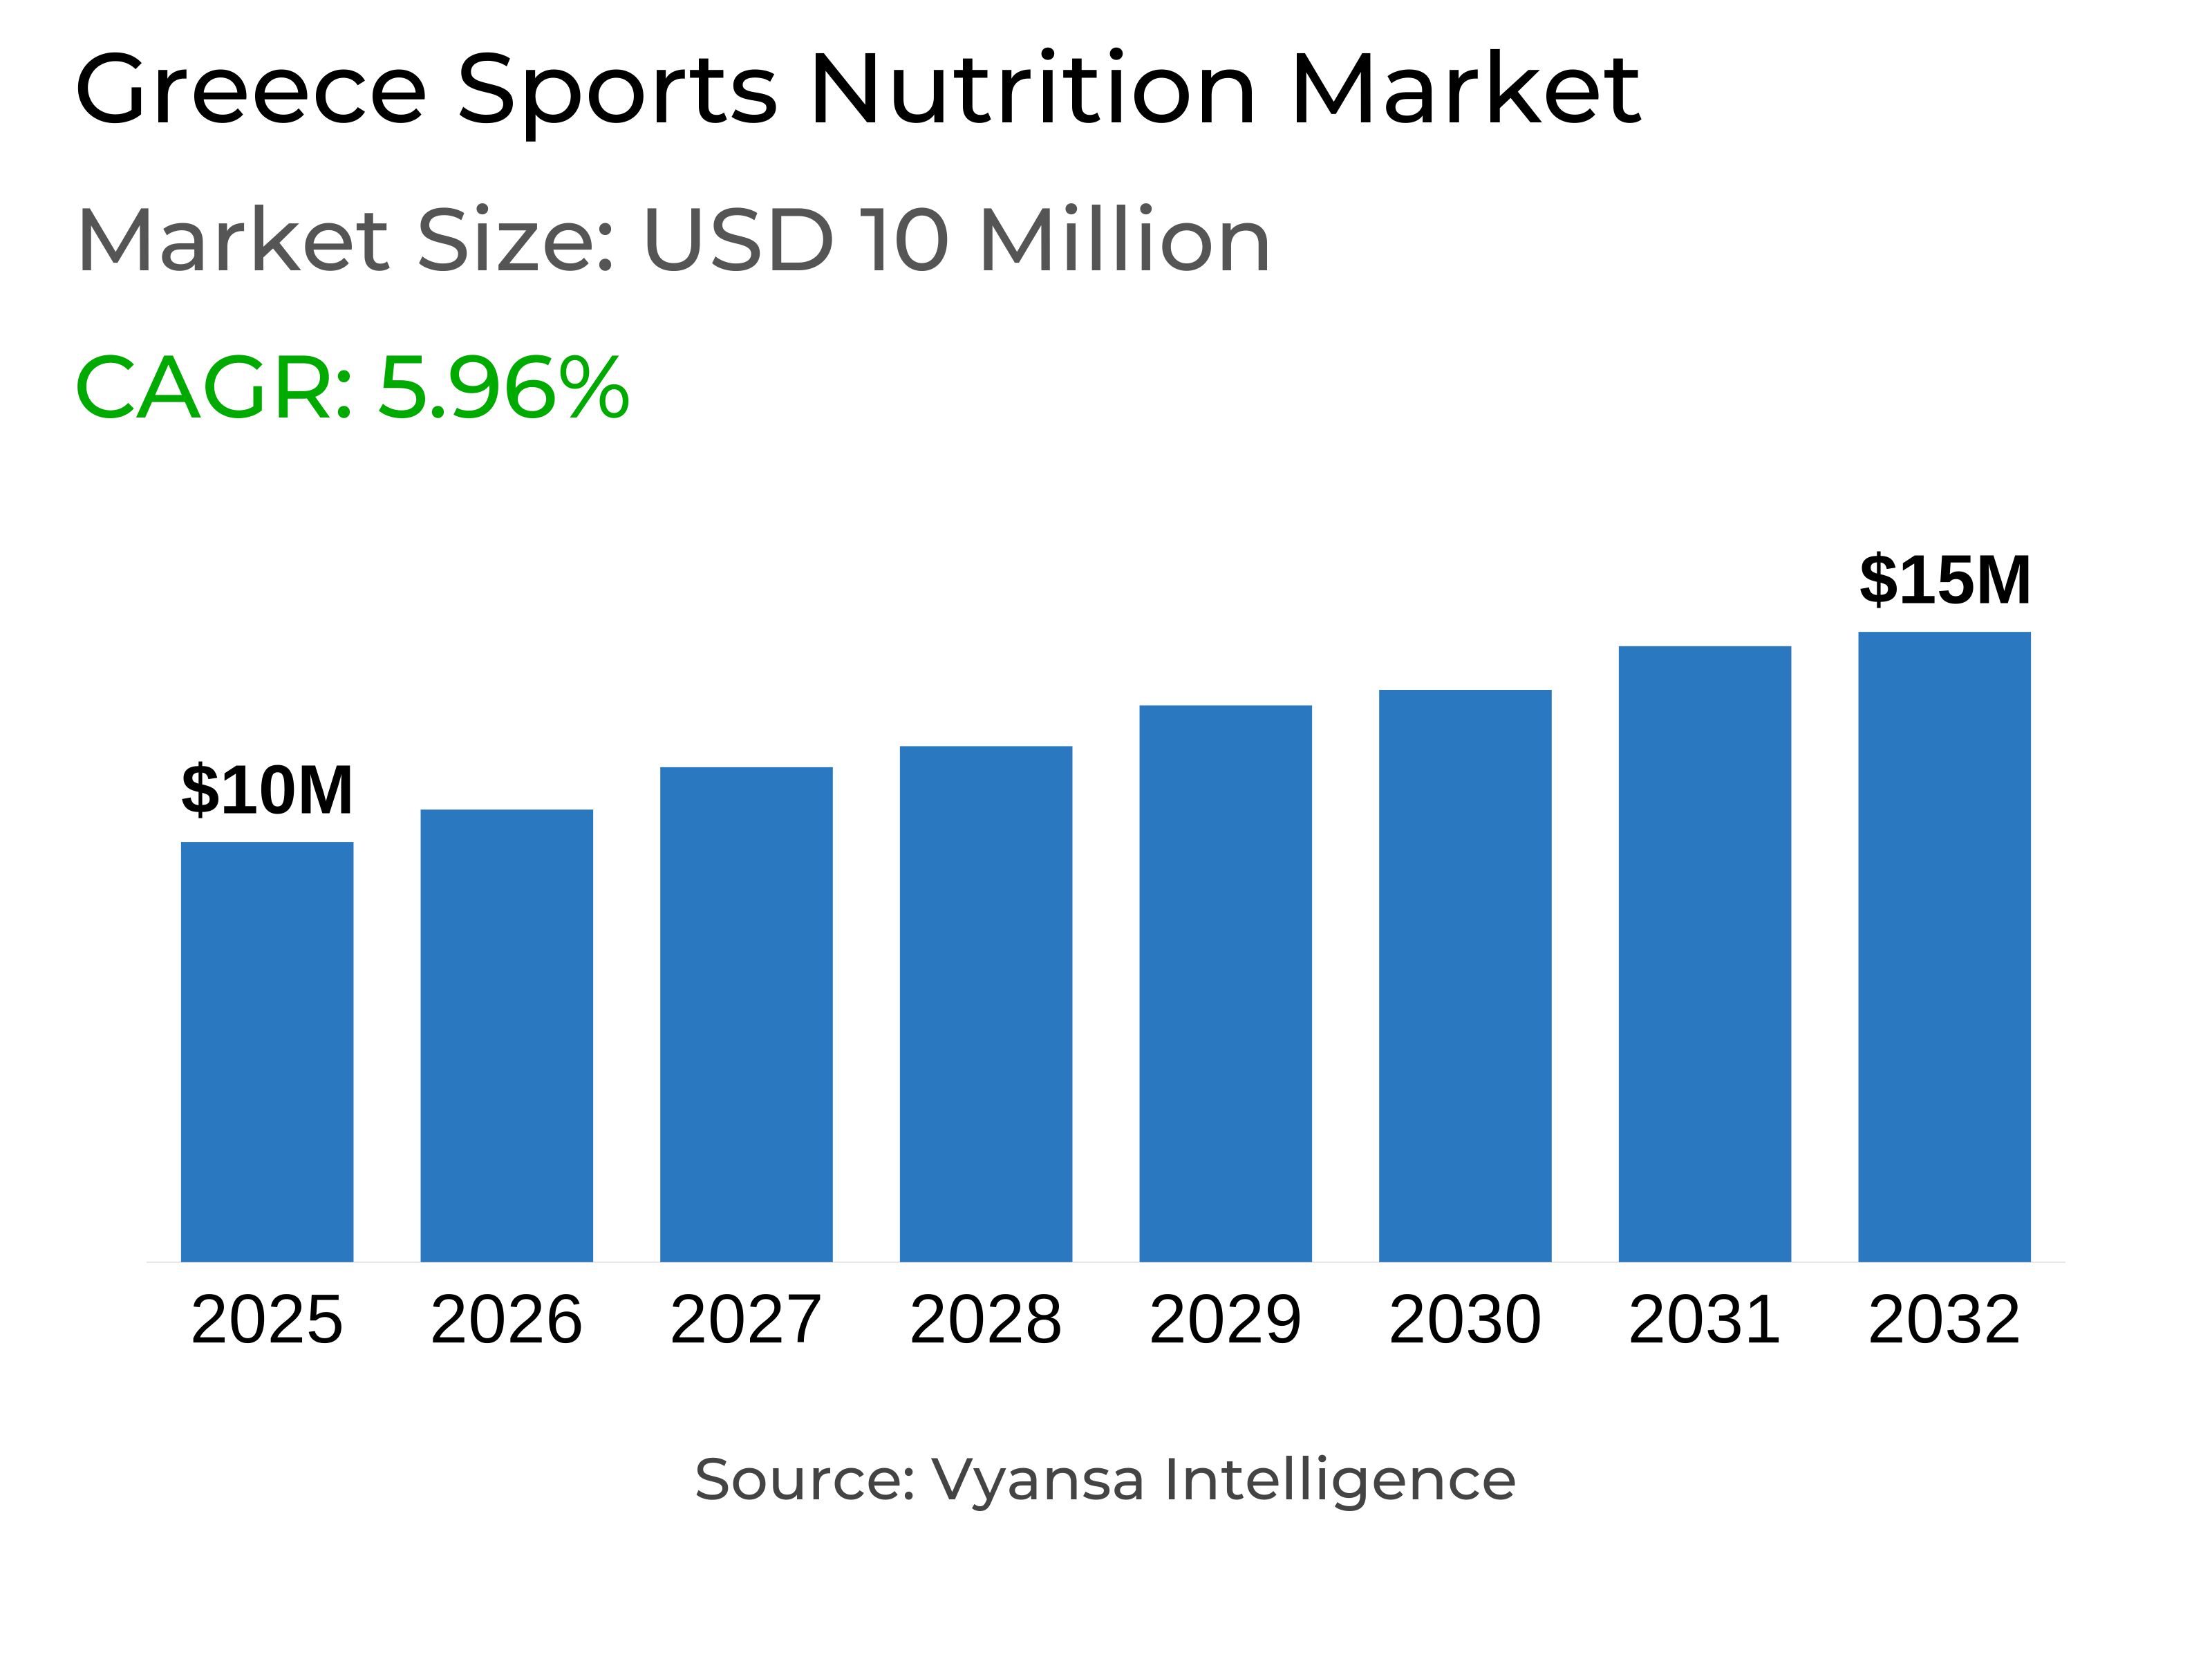
- Sports nutrition in Greece is estimated at USD 10 million.
- The market size is expected to grow to USD 15 million by 2032.
- Market to register a cagr of around 5.96% during 2026-32.
- Product Type Shares
- Sports protein products grabbed market share of 80%.
- Competition
- More than 20 companies are actively engaged in producing sports nutrition in Greece.
- Top 5 companies acquired around 60% of the market share.
- QNT International Inc, Iso Plus SA, Post Holdings Inc, X-Treme Stores SA, Nutrend DS as etc., are few of the top companies.
- Sales Channel
- Retail online grabbed 65% of the market.
Greece Sports Nutrition Market Outlook
The sports nutrition market in Greece is expanding as growing number of individuals are paying attention to healthy living and fitness. The market is estimated at around $10 million in 2025 and is likely to grow to around $15 million by 2032, with an estimated CAGR of around 5.96% from 2026-2032. More end users now include protein shakes, bars, and supplements in their daily diets to stay active and improve recovery. This growing interest in fitness and balanced nutrition continues to support the steady rise of the market across the country.
Sports protein products occupy the largest share of the market, accounting for around 80% of total sales. They are utilized by gym enthusiasts, athletes, and other end users who desire to sustain energy and strength. Protein powders, ready to consume beverages, and bars have become common for quick nutrition and recovery. The growing demand for vegan, lactose-free, and plant-based protein options is also helping expand the reach of these products among new end user groups.
The top five players control around 60% of the total market share. These companies compete mainly on product innovation, quality, and pricing. New entrants are focusing on building a strong retail online presence and expanding their product variety to attract a broader group of end users. This growing competition is improving product standards and making the market more dynamic.
A majority of these products are bought through retail online, which represents a share of around 65% of the total market sales. A large number of end users like buying from online stores because it provides convenience, comparison in price, and an increased variety of products. Retail online has become the main channel for sports nutrition in Greece and will continue to lead as digital buying habits grow. With both protein and non-protein products gaining attention, the market is expected to show steady and healthy growth through 2032.

Greece Sports Nutrition Market Growth Driver
Rising Fitness Awareness Expands Product Use
More end users are becoming health and fitness conscious, increasing their interest in improving physical performance and overall wellbeing. This shift encourages more end users to go to the gym and include sport nutrition into their lifestyle. The category has evolved from a small target group and now appeals to a wider audience looking for products that support strength, recovery, and endurance.
Additionally, growing interest in activities such as High Intensity Interval Training and CrossFit enhances demand for such products even further. Endurance based products, such as electrolytes that were previously underdeveloped, are gaining traction. Sports nutrition is is also becoming more varied, with non protein products gaining the limelight. Although sports protein products like whey protein and BCAA continue to remain popular, non protein products are recording faster growth both in volume and retail value.
Greece Sports Nutrition Market Challenge
Regulatory and Compliance Barriers Affect Market Stability
The sports nutrition market continues to face difficulties from complicated and changing regulations on labeling, health claims, and product formulations. According to government and policy assessments, gaps remain in nutrition labeling standards and public education about product information. This leaves end users uncertain and increases compliance burden on companies as they need to constantly change packaging and marketing materials to comply with new regulations.
Regular changes in tax and regulatory environments further contribute to the complexity, making it hard for both local and international brands to plan long-term strategies. Companies in the nutrition and supplement category must constantly adapt to remain compliant, which in return slows down product launches and increases the cost of operations. These constant regulatory challenges restrict market stability and slow the overall rate of category growth.
Unlock Market Intelligence
Explore the market potential with our data-driven report
Greece Sports Nutrition Market Trend
Growing Shift Toward Diverse Protein Options
Sports protein products remain popular with end users outside gym enthusiasts, as end users want to incorporate additional protein in their diets on a daily basis. Others also consume these products as the meal substitutes for weight management. The ever growing vegetarian and vegan population is contributing towards this transition, with more number of companies offering pea protein and lactose free versions for end users with specific dietary requirements. Plant based proteins are now more prominent and gradually becoming more widely distributed, showing how brands are diversifying to reach different end user groups.
Simultaneously, the craze surrounding keto and similar high protein diet programs is boosting the application of sports protein powders. These powders are not just used during exercise but also added into smoothies and breakfast foods. This wider use helps expand the end user base and strengthens the position of sports protein products in everyday nutrition.
Greece Sports Nutrition Market Opportunity
Expanding Potential for Sports Non-Protein Products
The market will show strong potential for sports non-protein products throughout the forecast period as more end users adopts active and fitness oriented lifestyles. Whereas sports protein products will keep growing, future expansion will mainly come from non protein ranges that support endurance and faster recovery. With low penetration of sports non protein products along with increasing investment by companies, will create room for innovation and new product launches targeting a wider group of end users seeking improved performance and convenience.
Moreover a larger variety of sports non protein products will be launched, with endurance based gels becoming popular in gyms and training spaces. As end users pursue high performance routines like CrossFit, knowledge and usage of these products will further accelerate. Meanwhile, companies already present in supplements will enter this segment, strengthening market competition and boosting long-term category growth.
Unlock Market Intelligence
Explore the market potential with our data-driven report
Greece Sports Nutrition Market Segmentation Analysis

By Product Type
- Sports Protein Products
- Sports Non-Protein Products
The segment with the highest share is Sports Protein Products, holding around 80% of the total market. This segment leads due to an increased number of end users interest in muscle building, recovery, and active lifestyles. In this segment, the sports protein powder captures the largest share due to its flexible use in shakes, smoothies, and meal plans. Protein or energy bars and ready-to-drink (RTD) protein drinks also play their part in the segment, providing convenient solutions for busy end user. The robust availability of such products in both retail online and retail offline platforms further support to their wide reach and consistent growth.
Sports protein products are increasingly going beyond the gym enthusiasts and reaching a larger base including those consuming them for weight management and balanced diet. The rise of vegan and lactose free options, such as pea protein and plant based powders, strengthens this segment even more, ensuring its leading position through the forecast period.
By Sales Channel
- Retail Offline
- Retail Online
The segment with the highest share is Retail Online, holding around 65% of the total market. This channel leads as end users prefer to purchase sports nutrition products online for lower prices, greater product options, and convenient access. The digital space has expanded rapidly with the rise of local e-retailers, enhancing product accessibility and minimizing dependece on foreign platform. The growing number of online stores and improved digital payment systems have made shopping faster and more reliable for end users.
Retail online also makes it possible for end users to compare brands, read reviews, and find special discounts, solidifying its place within the marketplace. Even more companies are placing their sales efforts on digital platforms in order to reach more end users and gain more visibility. As convenience and variety fuel sales, retail online will keep leading and providing support for overall market growth.
Top Companies in Greece Sports Nutrition Market
The top companies operating in the market include QNT International Inc, Iso Plus SA, Post Holdings Inc, X-Treme Stores SA, Nutrend DS as, Herbalife International Greece SA, Scitec Nutrition Inc, BioTech Nutrition Inc, Hut Group Ltd, The, Supreme Imports Ltd, etc., are the top players operating in the Greece sports nutrition market.
Frequently Asked Questions
Related Report
1. Market Segmentation
1.1. Research Scope
1.2. Research Methodology
1.3. Definitions and Assumptions
2. Executive Summary
3. Greece Sports Nutrition Market Policies, Regulations, and Standards
4. Greece Sports Nutrition Market Dynamics
4.1. Growth Factors
4.2. Challenges
4.3. Trends
4.4. Opportunities
5. Greece Sports Nutrition Market Statistics, 2022-2032F
5.1. Market Size & Growth Outlook
5.1.1.By Revenues in US$ Million
5.2. Market Segmentation & Growth Outlook
5.2.1.By Product Type
5.2.1.1. Sports Protein Products- Market Insights and Forecast 2022-2032, USD Million
5.2.1.1.1. Protein/Energy Bars- Market Insights and Forecast 2022-2032, USD Million
5.2.1.1.2. Sports Protein Powder- Market Insights and Forecast 2022-2032, USD Million
5.2.1.1.3. Sports Protein RTD- Market Insights and Forecast 2022-2032, USD Million
5.2.1.2. Sports Non-Protein Products- Market Insights and Forecast 2022-2032, USD Million
5.2.2.By Sales Channel
5.2.2.1. Retail Offline- Market Insights and Forecast 2022-2032, USD Million
5.2.2.2. Retail Online- Market Insights and Forecast 2022-2032, USD Million
5.2.3.By Ingredients
5.2.3.1. Vitamins and Minerals- Market Insights and Forecast 2022-2032, USD Million
5.2.3.2. Proteins and Amino Acids- Market Insights and Forecast 2022-2032, USD Million
5.2.3.3. Carbohydrates- Market Insights and Forecast 2022-2032, USD Million
5.2.3.4. Probiotics- Market Insights and Forecast 2022-2032, USD Million
5.2.3.5. Botanicals/Herbals- Market Insights and Forecast 2022-2032, USD Million
5.2.3.6. Others- Market Insights and Forecast 2022-2032, USD Million
5.2.4.By Functionality
5.2.4.1. Energy- Market Insights and Forecast 2022-2032, USD Million
5.2.4.2. Muscle growth- Market Insights and Forecast 2022-2032, USD Million
5.2.4.3. Hydration- Market Insights and Forecast 2022-2032, USD Million
5.2.4.4. Weight Management- Market Insights and Forecast 2022-2032, USD Million
5.2.4.5. Others- Market Insights and Forecast 2022-2032, USD Million
5.2.5.By End User
5.2.5.1. Bodybuilders- Market Insights and Forecast 2022-2032, USD Million
5.2.5.2. Athletes- Market Insights and Forecast 2022-2032, USD Million
5.2.5.3. Lifestyle Users- Market Insights and Forecast 2022-2032, USD Million
5.2.6.By Competitors
5.2.6.1. Competition Characteristics
5.2.6.2. Market Share & Analysis
6. Greece Protein Products Sports Nutrition Market Statistics, 2022-2032F
6.1. Market Size & Growth Outlook
6.1.1.By Revenues in US$ Million
6.2. Market Segmentation & Growth Outlook
6.2.1.By Sales Channel- Market Insights and Forecast 2022-2032, USD Million
6.2.2.By Ingredients- Market Insights and Forecast 2022-2032, USD Million
6.2.3.By Functionality- Market Insights and Forecast 2022-2032, USD Million
6.2.4.By End User- Market Insights and Forecast 2022-2032, USD Million
7. Greece Non-Protein Products Sports Nutrition Market Statistics, 2022-2032F
7.1. Market Size & Growth Outlook
7.1.1.By Revenues in US$ Million
7.2. Market Segmentation & Growth Outlook
7.2.1.By Sales Channel- Market Insights and Forecast 2022-2032, USD Million
7.2.2.By Ingredients- Market Insights and Forecast 2022-2032, USD Million
7.2.3.By Functionality- Market Insights and Forecast 2022-2032, USD Million
7.2.4.By End User- Market Insights and Forecast 2022-2032, USD Million
8. Competitive Outlook
8.1. Company Profiles
8.1.1.X-Treme Stores SA
8.1.1.1. Business Description
8.1.1.2. Product Portfolio
8.1.1.3. Collaborations & Alliances
8.1.1.4. Recent Developments
8.1.1.5. Financial Details
8.1.1.6. Others
8.1.2.Nutrend DS as
8.1.2.1. Business Description
8.1.2.2. Product Portfolio
8.1.2.3. Collaborations & Alliances
8.1.2.4. Recent Developments
8.1.2.5. Financial Details
8.1.2.6. Others
8.1.3.Herbalife International Greece SA
8.1.3.1. Business Description
8.1.3.2. Product Portfolio
8.1.3.3. Collaborations & Alliances
8.1.3.4. Recent Developments
8.1.3.5. Financial Details
8.1.3.6. Others
8.1.4.Scitec Nutrition Inc
8.1.4.1. Business Description
8.1.4.2. Product Portfolio
8.1.4.3. Collaborations & Alliances
8.1.4.4. Recent Developments
8.1.4.5. Financial Details
8.1.4.6. Others
8.1.5.BioTech Nutrition Inc
8.1.5.1. Business Description
8.1.5.2. Product Portfolio
8.1.5.3. Collaborations & Alliances
8.1.5.4. Recent Developments
8.1.5.5. Financial Details
8.1.5.6. Others
8.1.6.QNT International Inc
8.1.6.1. Business Description
8.1.6.2. Product Portfolio
8.1.6.3. Collaborations & Alliances
8.1.6.4. Recent Developments
8.1.6.5. Financial Details
8.1.6.6. Others
8.1.7.Iso Plus SA
8.1.7.1. Business Description
8.1.7.2. Product Portfolio
8.1.7.3. Collaborations & Alliances
8.1.7.4. Recent Developments
8.1.7.5. Financial Details
8.1.7.6. Others
8.1.8.Post Holdings Inc
8.1.8.1. Business Description
8.1.8.2. Product Portfolio
8.1.8.3. Collaborations & Alliances
8.1.8.4. Recent Developments
8.1.8.5. Financial Details
8.1.8.6. Others
8.1.9.Hut Group Ltd, The
8.1.9.1. Business Description
8.1.9.2. Product Portfolio
8.1.9.3. Collaborations & Alliances
8.1.9.4. Recent Developments
8.1.9.5. Financial Details
8.1.9.6. Others
8.1.10. Supreme Imports Ltd
8.1.10.1. Business Description
8.1.10.2. Product Portfolio
8.1.10.3. Collaborations & Alliances
8.1.10.4. Recent Developments
8.1.10.5. Financial Details
8.1.10.6. Others
9. Disclaimer
| Segment | Sub-Segment |
|---|---|
| By Product Type |
|
| By Sales Channel |
|
| By Ingredients |
|
| By Functionality |
|
| By End User |
|
Research Methodology
This study followed a structured approach comprising four key phases to assess the size and scope of the electro-oxidation market. The process began with thorough secondary research to collect data on the target market, related markets, and broader industry context. These findings, along with preliminary assumptions and estimates, were then validated through extensive primary research involving industry experts from across the value chain. To calculate the overall market size, both top-down and bottom-up methodologies were employed. Finally, market segmentation and data triangulation techniques were applied to refine and validate segment-level estimations.
Secondary Research
The secondary research phase involved gathering data from a wide range of credible and published sources. This step helped in identifying industry trends, defining market segmentation, and understanding the market landscape and value chain.
Sources consulted during this phase included:
- Company annual reports, investor presentations, and press releases
- Industry white papers and certified publications
- Trade directories and market-recognized databases
- Articles from authoritative authors and reputable journals
- Gold and silver standard websites
Secondary research was critical in mapping out the industry's value chain and monetary flow, identifying key market segments, understanding regional variations, and tracking significant industry developments.
Other key sources:
- Financial disclosures
- Industry associations and trade bodies
- News outlets and business magazines
- Academic journals and research studies
- Paid industry databases
Primary Research
To validate secondary data and gain deeper market insights, primary research was conducted with key stakeholders across both the supply and demand sides of the market.
On the demand side, participants included decision-makers and influencers from end-user industries—such as CIOs, CTOs, and CSOs—who provided first-hand perspectives on market needs, product usage, and future expectations.
On the supply side, interviews were conducted with manufacturers, industry associations, and institutional participants to gather insights into current offerings, product pipelines, and market challenges.
Primary interviews provided critical inputs such as:
- Market size and revenue data
- Product and service breakdowns
- Market forecasts
- Regional and application-specific trends
Stakeholders consulted included:
- Leading OEM and solution providers
- Channel and distribution partners
- End users across various applications
- Independent consultants and industry specialists
Market Size Estimation and Data Triangulation
- Identifying Key Market Participants (Secondary Research)
- Goal: To identify the major players or companies in the target market. This typically involves using publicly available data sources such as industry reports, market research publications, and financial statements of companies.
- Tools: Reports from firms like Gartner, Forrester, Euromonitor, Statista, IBISWorld, and others. Public financial statements, news articles, and press releases from top market players.
- Extracting Earnings of Key Market Participants
- Goal: To estimate the earnings generated from the product or service being analyzed. This step helps in understanding the revenue potential of each market player in a specific geography.
- Methods: Earnings data can be gathered from:
- Publicly available financial reports (for listed companies).
- Interviews and primary data sources from professionals, such as Directors, VPs, SVPs, etc. This is especially useful for understanding more nuanced, internal data that isn't publicly disclosed.
- Annual reports and investor presentations of key players.
- Data Collation and Development of a Relevant Data Model
- Goal: To collate inputs from both primary and secondary sources into a structured, data-driven model for market estimation. This model will incorporate key market KPIs and any independent variables relevant to the market.
- Key KPIs: These could include:
- Market size, growth rate, and demand drivers.
- Industry-specific metrics like market share, average revenue per customer (ARPC), or average deal size.
- External variables, such as economic growth rates, inflation rates, or commodity prices, that could affect the market.
- Data Modeling: Based on this data, the market forecasts are developed for the next 5 years. A combination of trend analysis, scenario modeling, and statistical regression might be used to generate projections.
- Scenario Analysis
- Goal: To test different assumptions and validate how sensitive the market is to changes in key variables (e.g., market demand, regulatory changes, technological disruptions).
- Types of Scenarios:
- Base Case: Based on current assumptions and historical data.
- Best-Case Scenario: Assuming favorable market conditions, regulatory environments, and technological advancements.
- Worst-Case Scenario: Accounting for adverse factors, such as economic downturns, stricter regulations, or unexpected disruptions.


