Global Explainable AI Software Market Report: Trends, Growth and Forecast (2026-2032)
By Component (Software, Services, Professional Services, Managed Services), By Explanation Type (Feature Attribution, Prediction Explanation, Model Transparency, Bias & Fairness Analysis, Decision Reason Codes, Model Documentation, LLM Output Explanation), By Model Type (Traditional Machine Learning Models, Deep Learning Models, Generative AI/LLMs, Natural Language Processing Models, Computer Vision Models), By Application (Credit Scoring, Fraud Detection, Risk Management, Healthcare Decision Support, Insurance Underwriting, Regulatory Compliance, Customer Analytics), By Deployment Mode (Cloud-Based, On-Premises, Hybrid), By Organization Size (Large Enterprises, Small & Medium Enterprises), By End User (BFSI, Healthcare, Insurance, IT & Telecom, Government & Public Sector, Retail & E-Commerce, Automotive, Others), By Region (North America, South America, Europe, Middle East & Africa, Asia Pacific) ... Read more
|
Major Players
|
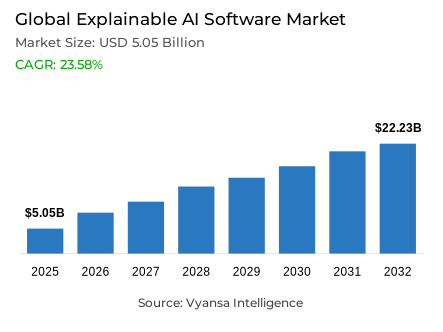
Global Explainable AI Software Market Statistics and Insights, 2026
- Market Size Statistics
- Explainable ai software market size in Global was valued at USD 5.05 billion in 2025 and is estimated at USD 8.32 billion in 2026.
- The market size is expected to grow to USD 22.23 billion by 2032.
- Market to register a CAGR of around 23.58% during 2026-32.
- Explanation Type Shares
- Feature attribution grabbed market share of 30%.
- Competition
- More than 25 companies are actively engaged in producing explainable ai software.
- Top 5 companies acquired around 40% of the market share.
- Microsoft, Amazon Web Services, SAS, IBM, Fiddler AI etc., are few of the top companies.
- Deployment Mode
- Cloud-based grabbed 65% of the market.
- Region
- North America leads with a 45% share of the global market.
Global Explainable AI Software Market Outlook
The Global Explainable AI Market was valued at USD 5.05 billion in 2025 and is projected to grow from USD 8.32 billion in 2026 to USD 22.23 billion by 2032, at a CAGR of 23.58%. Demand is shaped by enterprises moving AI into decision-sensitive workflows where models approve, reject, classify, score, rank, or recommend outcomes. Therefore, AI explainability software is becoming important for model interpretation, bias detection, audit documentation, and decision traceability.
Macroeconomic conditions also support controlled AI adoption. IMF projects global growth at 3.1% in 2026 and 3.2% in 2027, creating a moderate environment where enterprises seek productivity improvement while limiting regulatory, reputational, and operational risk. Hence, model interpretability tools gain relevance in credit scoring, fraud detection, underwriting, diagnostics, pricing, workforce analytics, and supply-chain forecasting, where opaque outputs can delay business approval and compliance review.
Governance-led adoption is reshaping the market structure as enterprises connect explainability with MLOps, model monitoring, AI governance, and risk management workflows. XAI software now supports live decision review, explanation storage, model version comparison, feature drift tracking, fairness testing, and regulatory reporting. However, predictive AI and GenAI need different transparency layers, since predictive models require feature-level explanations, while GenAI tools require prompt traceability, source grounding, response validation, and policy logs.
North America remains the strongest commercialization base, supported by AI investment, mature cloud adoption, enterprise software depth, and responsible AI governance activity. The region benefits from technology providers, model developers, financial institutions, healthcare networks, and regulated enterprises that require explainability before scaling AI systems. Through 2032, the XAI market remains tied to model approval, compliance readiness, audit review, and business-user acceptance across high-risk AI workflows. This supports disciplined adoption where automated decisions need technical clarity, business review, and evidence retention across regulated AI portfolios and enterprise workflows globally.

Global Explainable AI Software Market Growth Driver
Auditability Becomes the Enterprise Trust Engine
Auditability remains the strongest driver for the Global Explainable AI Market, as AI systems are entering workflows that affect customers, patients, employees, transactions, claims, and public services. Stanford HAI reports that 78% of organizations used AI in 2024, compared with 55% in 2023, while generative AI use in at least one business function increased from 33% to 71%. Therefore, AI transparency platforms are needed to explain model outputs, preserve decision evidence, and support review by risk, audit, compliance, and business teams.
This driver directly supports feature attribution engines, SHAP-based interpretation tools, LIME-style local explanations, counterfactual modules, bias dashboards, model cards, explanation APIs, decision logs, and audit reporting platforms. In banking, attribution can show whether income, credit utilization, or repayment history shaped a score. In healthcare, it can explain which clinical indicators influenced a recommendation. Hence, AI model auditability becomes central to model validation, production monitoring, version comparison, explanation drift tracking, and controlled use of automated decisions across regulated enterprise workflows. It also improves communication between data scientists and non-technical reviewers, reducing interpretation gaps when models influence pricing, fraud alerts, underwriting, diagnostics, or workforce decisions during production use. This keeps explanations tied to evidence, not assumptions, across review cycles and audits.
Global Explainable AI Software Market Challenge
Regulatory Scrutiny Raises Compliance Complexity
Regulatory scrutiny creates the main challenge for the Global Explainable AI Market, as enterprises need explanations that are technically valid, understandable for non-technical users, and defensible during legal or regulatory review. The European Commission states that the EU AI Act entered into force on 1 August 2024 and becomes fully applicable on 2 August 2026, with some exceptions. Therefore, AI compliance requirements increase around risk classification, documentation, transparency, human oversight, model accountability, and audit readiness.
However, explanation requirements vary sharply by use case. Credit scoring needs feature attribution, adverse-action support, fairness testing, and decision records, while healthcare models need clinical-variable explanations and human-review traceability. Fraud systems require anomaly reasoning, and GenAI assistants need prompt logs, source visibility, hallucination checks, and sensitive-data controls. Hence, responsible AI implementation becomes complex when XAI platforms must integrate with model registries, feature stores, MLOps pipelines, monitoring dashboards, compliance systems, and cloud environments. Adoption remains tied to workflow fit, explanation quality, governance usability, and consistent audit evidence across regulated decisions. The burden rises further when organizations must define review ownership, record retention rules, escalation paths, and acceptable explanation formats for multiple departments, jurisdictions, and model types simultaneously. This keeps compliance execution detailed, resource-intensive, and ongoing globally.
Unlock Market Intelligence
Explore the market potential with our data-driven report
Global Explainable AI Software Market Trend
Responsible AI Tooling Moves Into Production
Responsible AI tooling is the strongest trend in the Global Explainable AI Market, as explainability moves from research notebooks into production governance workflows. NIST states that its Generative AI Profile was released on 26 July 2024 as a companion to the AI Risk Management Framework, helping organizations incorporate trustworthiness considerations into AI design, development, use, and evaluation. Therefore, model explanation tools are increasingly embedded in validation, deployment, monitoring, documentation, and governance processes from the start.
This trend changes product design across predictive AI and GenAI. Predictive models still need feature attribution, counterfactual analysis, fairness testing, model behavior summaries, and decision logs. However, GenAI systems require prompt-output traceability, source grounding, hallucination monitoring, toxicity checks, sensitive-data detection, and safety-filter records. Hence, LLM explainability is becoming part of broader explainability platforms that support business users, risk officers, legal teams, auditors, and data scientists through role-specific dashboards, explanation histories, governance exports, and production monitoring. The trend keeps XAI software tied to continuous oversight rather than one-time model review. It also strengthens links with MLOps, AI governance, model monitoring, and compliance reporting, as enterprises need shared evidence across development, approval, runtime use, and incident review. This makes explainability operational across the AI lifecycle today consistently.
Global Explainable AI Software Market Opportunity
Cloud Governance Opens Scalable Adoption
Cloud governance creates the clearest opportunity for the Global Explainable AI Market, as enterprises already run data storage, analytics, model development, collaboration tools, and business applications across cloud environments. Eurostat reports that 52.7% of EU enterprises used paid cloud computing services in 2025, up 7.4 percentage points from 2023. Therefore, cloud-based AI transparency platforms can connect with model registries, data pipelines, MLOps systems, monitoring tools, and governance dashboards without separate infrastructure in each business unit.
This opportunity supports scalable explanation management. Large organizations run credit models, fraud engines, recommendation systems, diagnostics tools, workforce analytics, and GenAI assistants across functions and regions. Hence, cloud-based XAI can centralize feature attribution, bias reports, prompt-output records, audit logs, model documentation, and approval workflows. Explainable AI tools for enterprises also help mid-sized firms use ready dashboards, API connectors, role-based access, and governance templates. The opportunity remains tied to standardized review, secure storage, explanation automation, and cross-team visibility across cloud-based AI portfolios. Cloud delivery also supports global operations, where banks, healthcare networks, retailers, and insurers need consistent explainability across regional models, shared data environments, and regulated workflows without duplicating governance systems. This improves explanation access while preserving centralized control and audit consistency globally overall.
Global Explainable AI Software Market Regional Analysis

By Region
- North America
- South America
- Europe
- Middle East & Africa
- Asia Pacific
North America leads the Global Explainable AI Market with 45% share, supported by AI investment, mature cloud infrastructure, early enterprise AI adoption, regulated industry demand, and responsible AI governance activity. Stanford HAI reports that U.S. private AI investment reached USD 109.1 billion in 2024, nearly 12 times China’s USD 9.3 billion and 24 times the U.K.’s USD 4.5 billion. Therefore, regional demand for AI explainability software remains closely linked with model validation, bias detection, decision traceability, and audit documentation.
WTO notes that AI-related investment contributed almost half of merchandise trade growth in 2025 and up to 70% of total productive investment in certain regions. Hence, North America’s position is reinforced by cloud, semiconductors, data centers, enterprise AI systems, and high-value use cases. Banks need explanations for credit scoring and fraud models, insurers need underwriting transparency, healthcare organizations need diagnostic review, and public agencies need accountable automated decisions. The regional outlook remains tied to AI bias detection, GenAI transparency, model auditability, cloud-based deployment, and responsible AI governance across regulated enterprise environments. This keeps North America central to commercial XAI adoption through production-scale AI oversight and compliance-led decision review across sectors and workflows globally today overall.
Unlock Market Intelligence
Explore the market potential with our data-driven report
Global Explainable AI Software Market Segmentation Analysis
By Explanation Type
- Feature Attribution
- Prediction Explanation
- Model Transparency
- Bias & Fairness Analysis
- Decision Reason Codes
- Model Documentation
- LLM Output Explanation
The leading Explanation Type segment is Feature Attribution, holding 30% of the Global Explainable AI Market. This segment leads as enterprises need practical methods that show how model inputs influence outputs. Feature attribution helps explain why a model approves a loan, flags a transaction, assigns risk, predicts churn, recommends a product, or classifies a medical image. Therefore, it remains one of the most usable explanation layers for data scientists, business stakeholders, risk teams, compliance teams, and internal auditors.
The segment includes SHAP-based tools, LIME-style explainability, permutation importance, partial dependence analysis, local explanation views, and model-specific attribution methods. In credit scoring, attribution can show whether repayment history, income, debt ratio, or credit utilization shaped an outcome. In fraud analytics, it can explain transaction amount, location, device behavior, or account pattern influence. Hence, SHAP and related attribution methods support debugging, version comparison, sensitive-variable review, explanation drift tracking, and audit documentation. Feature Attribution remains tied to repeatable model review, business-readable explanation, and accountable decision workflows. Its position is reinforced by continuous monitoring needs, as teams compare explanation patterns after retraining, new data intake, business-rule changes, and production drift across regulated AI systems. This keeps interpretation measurable across model versions and workflows consistently today.

By Deployment Mode
- Cloud-Based
- On-Premises
- Hybrid
The leading Deployment Mode segment is Cloud-Based, holding 65% of the Global Explainable AI Market. This segment leads as enterprises need scalable XAI platforms that integrate with cloud AI services, data pipelines, MLOps systems, model monitoring tools, governance dashboards, and business applications. Cloud-based XAI is especially relevant when models are distributed across departments, applications, regions, and user groups, making centralized explanation management difficult through isolated on-premise systems.
Cloud platforms support live explanation APIs, automated monitoring, distributed user access, scheduled reports, model version comparison, and cross-region governance. They also connect with cloud security controls, identity management, access permissions, and data governance systems. Hence, AI transparency platforms deployed in cloud environments help teams manage credit risk, fraud detection, medical support, demand forecasting, customer personalization, and GenAI assistants through shared explanation workflows. The segment remains tied to flexible integration, secure evidence storage, and faster governance rollout across enterprise AI portfolios. Cloud deployment also reduces infrastructure duplication, allowing business units to apply common explanation standards while preserving role-based access, audit records, policy workflows, and model documentation across multiple AI use cases. This keeps deployment scalable while maintaining controlled explanation access and review consistency across regulated workflows, business units, and regional operations globally today consistently.
Market Players in Global Explainable AI Software Market
These market players maintain a significant presence in the Global explainable ai software market and contribute to its ongoing evolution.
- Microsoft
- Amazon Web Services
- SAS
- IBM
- Fiddler AI
- DataRobot
- H2O.ai
- Google Cloud
- Dataiku
- Arize AI
- Arthur AI
- Snowflake
- FICO
- Zest AI
- Aporia
Market News & Updates
- Arthur AI, 2025:
Arthur AI open-sourced Arthur Engine in March 2025 as a real-time AI evaluation engine for generative AI and traditional ML models. The release supports real-time evaluation, active guardrails, continuous monitoring, customizable metrics, and local deployment. The update adds explainability-adjacent evaluation and monitoring capabilities for model reliability workflows.
- Microsoft, 2026:
Microsoft updated Foundry observability documentation in April 2026 with lifecycle evaluation guidance for AI applications. The update covers base model selection, pre-production evaluation, post-production monitoring, and built-in evaluators for quality, safety, and reliability. The release supports explainability and validation workflows for enterprise AI systems.
Frequently Asked Questions
Related Report
- Market Segmentation
- Research Scope
- Research Methodology
- Definitions and Assumptions
- Executive Summary
- Global Explainable AI Software Market Policies, Regulations, and Standards
- Global Explainable AI Software Market Dynamics
- Growth Factors
- Challenges
- Trends
- Opportunities
- Global Explainable AI Software Market Statistics, 2022-2032F
- Market Size & Growth Outlook
- By Revenues in USD Million
- Market Segmentation & Growth Outlook
- By Component
- Software- Market Insights and Forecast 2022-2032, USD Million
- Services- Market Insights and Forecast 2022-2032, USD Million
- Professional Services- Market Insights and Forecast 2022-2032, USD Million
- Managed Services- Market Insights and Forecast 2022-2032, USD Million
- By Explanation Type
- Feature Attribution- Market Insights and Forecast 2022-2032, USD Million
- Prediction Explanation- Market Insights and Forecast 2022-2032, USD Million
- Model Transparency- Market Insights and Forecast 2022-2032, USD Million
- Bias & Fairness Analysis- Market Insights and Forecast 2022-2032, USD Million
- Decision Reason Codes- Market Insights and Forecast 2022-2032, USD Million
- Model Documentation- Market Insights and Forecast 2022-2032, USD Million
- LLM Output Explanation- Market Insights and Forecast 2022-2032, USD Million
- By Model Type
- Traditional Machine Learning Models- Market Insights and Forecast 2022-2032, USD Million
- Deep Learning Models- Market Insights and Forecast 2022-2032, USD Million
- Generative AI/LLMs- Market Insights and Forecast 2022-2032, USD Million
- Natural Language Processing Models- Market Insights and Forecast 2022-2032, USD Million
- Computer Vision Models- Market Insights and Forecast 2022-2032, USD Million
- By Application
- Credit Scoring- Market Insights and Forecast 2022-2032, USD Million
- Fraud Detection- Market Insights and Forecast 2022-2032, USD Million
- Risk Management- Market Insights and Forecast 2022-2032, USD Million
- Healthcare Decision Support- Market Insights and Forecast 2022-2032, USD Million
- Insurance Underwriting- Market Insights and Forecast 2022-2032, USD Million
- Regulatory Compliance- Market Insights and Forecast 2022-2032, USD Million
- Customer Analytics- Market Insights and Forecast 2022-2032, USD Million
- By Deployment Mode
- Cloud-Based- Market Insights and Forecast 2022-2032, USD Million
- On-Premises- Market Insights and Forecast 2022-2032, USD Million
- Hybrid- Market Insights and Forecast 2022-2032, USD Million
- By Organization Size
- Large Enterprises- Market Insights and Forecast 2022-2032, USD Million
- Small & Medium Enterprises- Market Insights and Forecast 2022-2032, USD Million
- By End User
- BFSI- Market Insights and Forecast 2022-2032, USD Million
- Healthcare- Market Insights and Forecast 2022-2032, USD Million
- Insurance- Market Insights and Forecast 2022-2032, USD Million
- IT & Telecom- Market Insights and Forecast 2022-2032, USD Million
- Government & Public Sector- Market Insights and Forecast 2022-2032, USD Million
- Retail & E-Commerce- Market Insights and Forecast 2022-2032, USD Million
- Automotive- Market Insights and Forecast 2022-2032, USD Million
- Others- Market Insights and Forecast 2022-2032, USD Million
- By Region
- North America
- South America
- Europe
- Middle East & Africa
- Asia Pacific
- By Competitors
- Competition Characteristics
- Market Share & Analysis
- By Component
- Market Size & Growth Outlook
- North America Explainable AI Software Market Statistics, 2022-2032F
- Market Size & Growth Outlook
- By Revenues in USD Million
- Market Segmentation & Growth Outlook
- By Component- Market Insights and Forecast 2022-2032, USD Million
- By Explanation Type- Market Insights and Forecast 2022-2032, USD Million
- By Model Type- Market Insights and Forecast 2022-2032, USD Million
- By Application- Market Insights and Forecast 2022-2032, USD Million
- By Deployment Mode- Market Insights and Forecast 2022-2032, USD Million
- By Organization Size- Market Insights and Forecast 2022-2032, USD Million
- By End User- Market Insights and Forecast 2022-2032, USD Million
- By Country
- The US
- Canada
- Mexico
- Rest of North America
- The US Explainable AI Software Market Statistics, 2022-2032F
- Market Size & Growth Outlook
- By Revenues in USD Million
- Market Segmentation & Growth Outlook
- By Component- Market Insights and Forecast 2022-2032, USD Million
- By Explanation Type- Market Insights and Forecast 2022-2032, USD Million
- By Model Type- Market Insights and Forecast 2022-2032, USD Million
- By Application- Market Insights and Forecast 2022-2032, USD Million
- By Deployment Mode- Market Insights and Forecast 2022-2032, USD Million
- By Organization Size- Market Insights and Forecast 2022-2032, USD Million
- By End User- Market Insights and Forecast 2022-2032, USD Million
- Market Size & Growth Outlook
- Canada Explainable AI Software Market Statistics, 2022-2032F
- Market Size & Growth Outlook
- By Revenues in USD Million
- Market Segmentation & Growth Outlook
- By Component- Market Insights and Forecast 2022-2032, USD Million
- By Explanation Type- Market Insights and Forecast 2022-2032, USD Million
- By Model Type- Market Insights and Forecast 2022-2032, USD Million
- By Application- Market Insights and Forecast 2022-2032, USD Million
- By Deployment Mode- Market Insights and Forecast 2022-2032, USD Million
- By Organization Size- Market Insights and Forecast 2022-2032, USD Million
- By End User- Market Insights and Forecast 2022-2032, USD Million
- Market Size & Growth Outlook
- Mexico Explainable AI Software Market Statistics, 2022-2032F
- Market Size & Growth Outlook
- By Revenues in USD Million
- Market Segmentation & Growth Outlook
- By Component- Market Insights and Forecast 2022-2032, USD Million
- By Explanation Type- Market Insights and Forecast 2022-2032, USD Million
- By Model Type- Market Insights and Forecast 2022-2032, USD Million
- By Application- Market Insights and Forecast 2022-2032, USD Million
- By Deployment Mode- Market Insights and Forecast 2022-2032, USD Million
- By Organization Size- Market Insights and Forecast 2022-2032, USD Million
- By End User- Market Insights and Forecast 2022-2032, USD Million
- Market Size & Growth Outlook
- Market Size & Growth Outlook
- South America Explainable AI Software Market Statistics, 2022-2032F
- Market Size & Growth Outlook
- By Revenues in USD Million
- Market Segmentation & Growth Outlook
- By Component- Market Insights and Forecast 2022-2032, USD Million
- By Explanation Type- Market Insights and Forecast 2022-2032, USD Million
- By Model Type- Market Insights and Forecast 2022-2032, USD Million
- By Application- Market Insights and Forecast 2022-2032, USD Million
- By Deployment Mode- Market Insights and Forecast 2022-2032, USD Million
- By Organization Size- Market Insights and Forecast 2022-2032, USD Million
- By End User- Market Insights and Forecast 2022-2032, USD Million
- By Country
- Brazil
- Argentina
- Rest of South America
- Brazil Explainable AI Software Market Statistics, 2022-2032F
- Market Size & Growth Outlook
- By Revenues in USD Million
- Market Segmentation & Growth Outlook
- By Component- Market Insights and Forecast 2022-2032, USD Million
- By Explanation Type- Market Insights and Forecast 2022-2032, USD Million
- By Model Type- Market Insights and Forecast 2022-2032, USD Million
- By Application- Market Insights and Forecast 2022-2032, USD Million
- By Deployment Mode- Market Insights and Forecast 2022-2032, USD Million
- By Organization Size- Market Insights and Forecast 2022-2032, USD Million
- By End User- Market Insights and Forecast 2022-2032, USD Million
- Market Size & Growth Outlook
- Argentina Explainable AI Software Market Statistics, 2022-2032F
- Market Size & Growth Outlook
- By Revenues in USD Million
- Market Segmentation & Growth Outlook
- By Component- Market Insights and Forecast 2022-2032, USD Million
- By Explanation Type- Market Insights and Forecast 2022-2032, USD Million
- By Model Type- Market Insights and Forecast 2022-2032, USD Million
- By Application- Market Insights and Forecast 2022-2032, USD Million
- By Deployment Mode- Market Insights and Forecast 2022-2032, USD Million
- By Organization Size- Market Insights and Forecast 2022-2032, USD Million
- By End User- Market Insights and Forecast 2022-2032, USD Million
- Market Size & Growth Outlook
- Market Size & Growth Outlook
- Europe Explainable AI Software Market Statistics, 2022-2032F
- Market Size & Growth Outlook
- By Revenues in USD Million
- Market Segmentation & Growth Outlook
- By Component- Market Insights and Forecast 2022-2032, USD Million
- By Explanation Type- Market Insights and Forecast 2022-2032, USD Million
- By Model Type- Market Insights and Forecast 2022-2032, USD Million
- By Application- Market Insights and Forecast 2022-2032, USD Million
- By Deployment Mode- Market Insights and Forecast 2022-2032, USD Million
- By Organization Size- Market Insights and Forecast 2022-2032, USD Million
- By End User- Market Insights and Forecast 2022-2032, USD Million
- By Country
- Germany
- The UK
- France
- Italy
- Spain
- Rest of Europe
- Germany Explainable AI Software Market Statistics, 2022-2032F
- Market Size & Growth Outlook
- By Revenues in USD Million
- Market Segmentation & Growth Outlook
- By Component- Market Insights and Forecast 2022-2032, USD Million
- By Explanation Type- Market Insights and Forecast 2022-2032, USD Million
- By Model Type- Market Insights and Forecast 2022-2032, USD Million
- By Application- Market Insights and Forecast 2022-2032, USD Million
- By Deployment Mode- Market Insights and Forecast 2022-2032, USD Million
- By Organization Size- Market Insights and Forecast 2022-2032, USD Million
- By End User- Market Insights and Forecast 2022-2032, USD Million
- Market Size & Growth Outlook
- The UK Explainable AI Software Market Statistics, 2022-2032F
- Market Size & Growth Outlook
- By Revenues in USD Million
- Market Segmentation & Growth Outlook
- By Component- Market Insights and Forecast 2022-2032, USD Million
- By Explanation Type- Market Insights and Forecast 2022-2032, USD Million
- By Model Type- Market Insights and Forecast 2022-2032, USD Million
- By Application- Market Insights and Forecast 2022-2032, USD Million
- By Deployment Mode- Market Insights and Forecast 2022-2032, USD Million
- By Organization Size- Market Insights and Forecast 2022-2032, USD Million
- By End User- Market Insights and Forecast 2022-2032, USD Million
- Market Size & Growth Outlook
- France Explainable AI Software Market Statistics, 2022-2032F
- Market Size & Growth Outlook
- By Revenues in USD Million
- Market Segmentation & Growth Outlook
- By Component- Market Insights and Forecast 2022-2032, USD Million
- By Explanation Type- Market Insights and Forecast 2022-2032, USD Million
- By Model Type- Market Insights and Forecast 2022-2032, USD Million
- By Application- Market Insights and Forecast 2022-2032, USD Million
- By Deployment Mode- Market Insights and Forecast 2022-2032, USD Million
- By Organization Size- Market Insights and Forecast 2022-2032, USD Million
- By End User- Market Insights and Forecast 2022-2032, USD Million
- Market Size & Growth Outlook
- Italy Explainable AI Software Market Statistics, 2022-2032F
- Market Size & Growth Outlook
- By Revenues in USD Million
- Market Segmentation & Growth Outlook
- By Component- Market Insights and Forecast 2022-2032, USD Million
- By Explanation Type- Market Insights and Forecast 2022-2032, USD Million
- By Model Type- Market Insights and Forecast 2022-2032, USD Million
- By Application- Market Insights and Forecast 2022-2032, USD Million
- By Deployment Mode- Market Insights and Forecast 2022-2032, USD Million
- By Organization Size- Market Insights and Forecast 2022-2032, USD Million
- By End User- Market Insights and Forecast 2022-2032, USD Million
- Market Size & Growth Outlook
- Spain Explainable AI Software Market Statistics, 2022-2032F
- Market Size & Growth Outlook
- By Revenues in USD Million
- Market Segmentation & Growth Outlook
- By Component- Market Insights and Forecast 2022-2032, USD Million
- By Explanation Type- Market Insights and Forecast 2022-2032, USD Million
- By Model Type- Market Insights and Forecast 2022-2032, USD Million
- By Application- Market Insights and Forecast 2022-2032, USD Million
- By Deployment Mode- Market Insights and Forecast 2022-2032, USD Million
- By Organization Size- Market Insights and Forecast 2022-2032, USD Million
- By End User- Market Insights and Forecast 2022-2032, USD Million
- Market Size & Growth Outlook
- Market Size & Growth Outlook
- Middle East & Africa Explainable AI Software Market Statistics, 2022-2032F
- Market Size & Growth Outlook
- By Revenues in USD Million
- Market Segmentation & Growth Outlook
- By Component- Market Insights and Forecast 2022-2032, USD Million
- By Explanation Type- Market Insights and Forecast 2022-2032, USD Million
- By Model Type- Market Insights and Forecast 2022-2032, USD Million
- By Application- Market Insights and Forecast 2022-2032, USD Million
- By Deployment Mode- Market Insights and Forecast 2022-2032, USD Million
- By Organization Size- Market Insights and Forecast 2022-2032, USD Million
- By End User- Market Insights and Forecast 2022-2032, USD Million
- By Country
- The UAE
- Saudi Arabia
- South Africa
- Egypt
- Rest of Middle East and Africa
- The UAE Explainable AI Software Market Statistics, 2022-2032F
- Market Size & Growth Outlook
- By Revenues in USD Million
- Market Segmentation & Growth Outlook
- By Component- Market Insights and Forecast 2022-2032, USD Million
- By Explanation Type- Market Insights and Forecast 2022-2032, USD Million
- By Model Type- Market Insights and Forecast 2022-2032, USD Million
- By Application- Market Insights and Forecast 2022-2032, USD Million
- By Deployment Mode- Market Insights and Forecast 2022-2032, USD Million
- By Organization Size- Market Insights and Forecast 2022-2032, USD Million
- By End User- Market Insights and Forecast 2022-2032, USD Million
- Market Size & Growth Outlook
- Saudi Arabia Explainable AI Software Market Statistics, 2022-2032F
- Market Size & Growth Outlook
- By Revenues in USD Million
- Market Segmentation & Growth Outlook
- By Component- Market Insights and Forecast 2022-2032, USD Million
- By Explanation Type- Market Insights and Forecast 2022-2032, USD Million
- By Model Type- Market Insights and Forecast 2022-2032, USD Million
- By Application- Market Insights and Forecast 2022-2032, USD Million
- By Deployment Mode- Market Insights and Forecast 2022-2032, USD Million
- By Organization Size- Market Insights and Forecast 2022-2032, USD Million
- By End User- Market Insights and Forecast 2022-2032, USD Million
- Market Size & Growth Outlook
- South Africa Explainable AI Software Market Statistics, 2022-2032F
- Market Size & Growth Outlook
- By Revenues in USD Million
- Market Segmentation & Growth Outlook
- By Component- Market Insights and Forecast 2022-2032, USD Million
- By Explanation Type- Market Insights and Forecast 2022-2032, USD Million
- By Model Type- Market Insights and Forecast 2022-2032, USD Million
- By Application- Market Insights and Forecast 2022-2032, USD Million
- By Deployment Mode- Market Insights and Forecast 2022-2032, USD Million
- By Organization Size- Market Insights and Forecast 2022-2032, USD Million
- By End User- Market Insights and Forecast 2022-2032, USD Million
- Market Size & Growth Outlook
- Egypt Explainable AI Software Market Statistics, 2022-2032F
- Market Size & Growth Outlook
- By Revenues in USD Million
- Market Segmentation & Growth Outlook
- By Component- Market Insights and Forecast 2022-2032, USD Million
- By Explanation Type- Market Insights and Forecast 2022-2032, USD Million
- By Model Type- Market Insights and Forecast 2022-2032, USD Million
- By Application- Market Insights and Forecast 2022-2032, USD Million
- By Deployment Mode- Market Insights and Forecast 2022-2032, USD Million
- By Organization Size- Market Insights and Forecast 2022-2032, USD Million
- By End User- Market Insights and Forecast 2022-2032, USD Million
- Market Size & Growth Outlook
- Market Size & Growth Outlook
- Asia Pacific Explainable AI Software Market Statistics, 2022-2032F
- Market Size & Growth Outlook
- By Revenues in USD Million
- Market Segmentation & Growth Outlook
- By Component- Market Insights and Forecast 2022-2032, USD Million
- By Explanation Type- Market Insights and Forecast 2022-2032, USD Million
- By Model Type- Market Insights and Forecast 2022-2032, USD Million
- By Application- Market Insights and Forecast 2022-2032, USD Million
- By Deployment Mode- Market Insights and Forecast 2022-2032, USD Million
- By Organization Size- Market Insights and Forecast 2022-2032, USD Million
- By End User- Market Insights and Forecast 2022-2032, USD Million
- By Country
- China
- India
- Japan
- South Korea
- Australia
- Indonesia
- Rest of Asia Pacific
- China Explainable AI Software Market Statistics, 2022-2032F
- Market Size & Growth Outlook
- By Revenues in USD Million
- Market Segmentation & Growth Outlook
- By Component- Market Insights and Forecast 2022-2032, USD Million
- By Explanation Type- Market Insights and Forecast 2022-2032, USD Million
- By Model Type- Market Insights and Forecast 2022-2032, USD Million
- By Application- Market Insights and Forecast 2022-2032, USD Million
- By Deployment Mode- Market Insights and Forecast 2022-2032, USD Million
- By Organization Size- Market Insights and Forecast 2022-2032, USD Million
- By End User- Market Insights and Forecast 2022-2032, USD Million
- Market Size & Growth Outlook
- India Explainable AI Software Market Statistics, 2022-2032F
- Market Size & Growth Outlook
- By Revenues in USD Million
- Market Segmentation & Growth Outlook
- By Component- Market Insights and Forecast 2022-2032, USD Million
- By Explanation Type- Market Insights and Forecast 2022-2032, USD Million
- By Model Type- Market Insights and Forecast 2022-2032, USD Million
- By Application- Market Insights and Forecast 2022-2032, USD Million
- By Deployment Mode- Market Insights and Forecast 2022-2032, USD Million
- By Organization Size- Market Insights and Forecast 2022-2032, USD Million
- By End User- Market Insights and Forecast 2022-2032, USD Million
- Market Size & Growth Outlook
- Japan Explainable AI Software Market Statistics, 2022-2032F
- Market Size & Growth Outlook
- By Revenues in USD Million
- Market Segmentation & Growth Outlook
- By Component- Market Insights and Forecast 2022-2032, USD Million
- By Explanation Type- Market Insights and Forecast 2022-2032, USD Million
- By Model Type- Market Insights and Forecast 2022-2032, USD Million
- By Application- Market Insights and Forecast 2022-2032, USD Million
- By Deployment Mode- Market Insights and Forecast 2022-2032, USD Million
- By Organization Size- Market Insights and Forecast 2022-2032, USD Million
- By End User- Market Insights and Forecast 2022-2032, USD Million
- Market Size & Growth Outlook
- South Korea Explainable AI Software Market Statistics, 2022-2032F
- Market Size & Growth Outlook
- By Revenues in USD Million
- Market Segmentation & Growth Outlook
- By Component- Market Insights and Forecast 2022-2032, USD Million
- By Explanation Type- Market Insights and Forecast 2022-2032, USD Million
- By Model Type- Market Insights and Forecast 2022-2032, USD Million
- By Application- Market Insights and Forecast 2022-2032, USD Million
- By Deployment Mode- Market Insights and Forecast 2022-2032, USD Million
- By Organization Size- Market Insights and Forecast 2022-2032, USD Million
- By End User- Market Insights and Forecast 2022-2032, USD Million
- Market Size & Growth Outlook
- Australia Explainable AI Software Market Statistics, 2022-2032F
- Market Size & Growth Outlook
- By Revenues in USD Million
- Market Segmentation & Growth Outlook
- By Component- Market Insights and Forecast 2022-2032, USD Million
- By Explanation Type- Market Insights and Forecast 2022-2032, USD Million
- By Model Type- Market Insights and Forecast 2022-2032, USD Million
- By Application- Market Insights and Forecast 2022-2032, USD Million
- By Deployment Mode- Market Insights and Forecast 2022-2032, USD Million
- By Organization Size- Market Insights and Forecast 2022-2032, USD Million
- By End User- Market Insights and Forecast 2022-2032, USD Million
- Market Size & Growth Outlook
- Indonesia Explainable AI Software Market Statistics, 2022-2032F
- Market Size & Growth Outlook
- By Revenues in USD Million
- Market Segmentation & Growth Outlook
- By Component- Market Insights and Forecast 2022-2032, USD Million
- By Explanation Type- Market Insights and Forecast 2022-2032, USD Million
- By Model Type- Market Insights and Forecast 2022-2032, USD Million
- By Application- Market Insights and Forecast 2022-2032, USD Million
- By Deployment Mode- Market Insights and Forecast 2022-2032, USD Million
- By Organization Size- Market Insights and Forecast 2022-2032, USD Million
- By End User- Market Insights and Forecast 2022-2032, USD Million
- Market Size & Growth Outlook
- Market Size & Growth Outlook
- Competitive Outlook
- Company Profiles
- IBM
- Business Description
- Product Portfolio
- Collaborations & Alliances
- Recent Developments
- Financial Details
- Others
- Fiddler AI
- Business Description
- Product Portfolio
- Collaborations & Alliances
- Recent Developments
- Financial Details
- Others
- DataRobot
- Business Description
- Product Portfolio
- Collaborations & Alliances
- Recent Developments
- Financial Details
- Others
- H2O.ai
- Business Description
- Product Portfolio
- Collaborations & Alliances
- Recent Developments
- Financial Details
- Others
- Google Cloud
- Business Description
- Product Portfolio
- Collaborations & Alliances
- Recent Developments
- Financial Details
- Others
- Microsoft
- Business Description
- Product Portfolio
- Collaborations & Alliances
- Recent Developments
- Financial Details
- Others
- Amazon Web Services
- Business Description
- Product Portfolio
- Collaborations & Alliances
- Recent Developments
- Financial Details
- Others
- SAS
- Business Description
- Product Portfolio
- Collaborations & Alliances
- Recent Developments
- Financial Details
- Others
- Dataiku
- Business Description
- Product Portfolio
- Collaborations & Alliances
- Recent Developments
- Financial Details
- Others
- Arize AI
- Business Description
- Product Portfolio
- Collaborations & Alliances
- Recent Developments
- Financial Details
- Others
- Arthur AI
- Business Description
- Product Portfolio
- Collaborations & Alliances
- Recent Developments
- Financial Details
- Others
- Snowflake
- Business Description
- Product Portfolio
- Collaborations & Alliances
- Recent Developments
- Financial Details
- Others
- FICO
- Business Description
- Product Portfolio
- Collaborations & Alliances
- Recent Developments
- Financial Details
- Others
- Zest AI
- Business Description
- Product Portfolio
- Collaborations & Alliances
- Recent Developments
- Financial Details
- Others
- Aporia
- Business Description
- Product Portfolio
- Collaborations & Alliances
- Recent Developments
- Financial Details
- Others
- IBM
- Company Profiles
- Disclaimer
| Segment | Sub-Segment |
|---|---|
| By Component |
|
| By Explanation Type |
|
| By Model Type |
|
| By Application |
|
| By Deployment Mode |
|
| By Organization Size |
|
| By End User |
|
| By Region |
|
Research Methodology
This study followed a structured approach comprising four key phases to assess the size and scope of the electro-oxidation market. The process began with thorough secondary research to collect data on the target market, related markets, and broader industry context. These findings, along with preliminary assumptions and estimates, were then validated through extensive primary research involving industry experts from across the value chain. To calculate the overall market size, both top-down and bottom-up methodologies were employed. Finally, market segmentation and data triangulation techniques were applied to refine and validate segment-level estimations.
Secondary Research
The secondary research phase involved gathering data from a wide range of credible and published sources. This step helped in identifying industry trends, defining market segmentation, and understanding the market landscape and value chain.
Sources consulted during this phase included:
- Company annual reports, investor presentations, and press releases
- Industry white papers and certified publications
- Trade directories and market-recognized databases
- Articles from authoritative authors and reputable journals
- Gold and silver standard websites
Secondary research was critical in mapping out the industry's value chain and monetary flow, identifying key market segments, understanding regional variations, and tracking significant industry developments.
Other key sources:
- Financial disclosures
- Industry associations and trade bodies
- News outlets and business magazines
- Academic journals and research studies
- Paid industry databases
Primary Research
To validate secondary data and gain deeper market insights, primary research was conducted with key stakeholders across both the supply and demand sides of the market.
On the demand side, participants included decision-makers and influencers from end-user industries—such as CIOs, CTOs, and CSOs—who provided first-hand perspectives on market needs, product usage, and future expectations.
On the supply side, interviews were conducted with manufacturers, industry associations, and institutional participants to gather insights into current offerings, product pipelines, and market challenges.
Primary interviews provided critical inputs such as:
- Market size and revenue data
- Product and service breakdowns
- Market forecasts
- Regional and application-specific trends
Stakeholders consulted included:
- Leading OEM and solution providers
- Channel and distribution partners
- End users across various applications
- Independent consultants and industry specialists
Market Size Estimation and Data Triangulation
- Identifying Key Market Participants (Secondary Research)
- Goal: To identify the major players or companies in the target market. This typically involves using publicly available data sources such as industry reports, market research publications, and financial statements of companies.
- Tools: Reports from firms like Gartner, Forrester, Euromonitor, Statista, IBISWorld, and others. Public financial statements, news articles, and press releases from top market players.
- Extracting Earnings of Key Market Participants
- Goal: To estimate the earnings generated from the product or service being analyzed. This step helps in understanding the revenue potential of each market player in a specific geography.
- Methods: Earnings data can be gathered from:
- Publicly available financial reports (for listed companies).
- Interviews and primary data sources from professionals, such as Directors, VPs, SVPs, etc. This is especially useful for understanding more nuanced, internal data that isn't publicly disclosed.
- Annual reports and investor presentations of key players.
- Data Collation and Development of a Relevant Data Model
- Goal: To collate inputs from both primary and secondary sources into a structured, data-driven model for market estimation. This model will incorporate key market KPIs and any independent variables relevant to the market.
- Key KPIs: These could include:
- Market size, growth rate, and demand drivers.
- Industry-specific metrics like market share, average revenue per customer (ARPC), or average deal size.
- External variables, such as economic growth rates, inflation rates, or commodity prices, that could affect the market.
- Data Modeling: Based on this data, the market forecasts are developed for the next 5 years. A combination of trend analysis, scenario modeling, and statistical regression might be used to generate projections.
- Scenario Analysis
- Goal: To test different assumptions and validate how sensitive the market is to changes in key variables (e.g., market demand, regulatory changes, technological disruptions).
- Types of Scenarios:
- Base Case: Based on current assumptions and historical data.
- Best-Case Scenario: Assuming favorable market conditions, regulatory environments, and technological advancements.
- Worst-Case Scenario: Accounting for adverse factors, such as economic downturns, stricter regulations, or unexpected disruptions.


