Europe Positive Displacement Pump Market Report: Trends, Growth and Forecast (2026-2032)
By Pump Type (Reciprocating Pump (Piston, Plunger, Diaphragm), Rotary Pump (Gear, Screw, Lobe, Vane), Peristaltic Pump), By Pressure Rating (Up to 50 bar, 51 to 150 bar, Above 150 bar), By End-user Industry (Oil & Gas, Power Generation, Water & Wastewater, Chemical & Petrochemical, Food & Beverage, Pharmaceutical & Biotechnology, Mining & Minerals, Pulp & Paper, Others), By Country (Germany, France, UK, Italy, Spain, Rest of Europe) ... Read more
|
Major Players
|
Europe Positive Displacement Pump Market Statistics and Insights, 2026
- Market Size Statistics
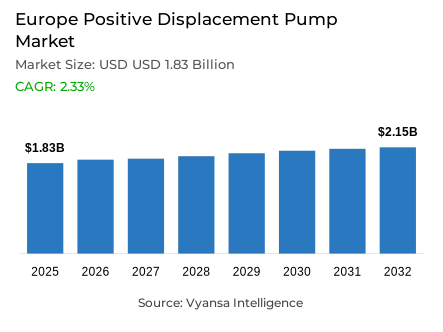
- Europe positive displacement pump market is estimated at USD 1.83 billion in 2025.
- The market size is expected to grow to USD 2.15 billion by 2032.
- Market to register a cagr of around 2.33% during 2026-32.
- Pump Type Shares
- Rotary pump grabbed market share of 50%.
- Competition
- Positive displacement pump in Europe is currently being catered to by more than 10 companies.
- Top 5 companies acquired around 60% of the market share.
- Grindex AB; SPT Pumpen; Flowserve Corporation; Grundfos Holding A/S; Sulzer Ltd. etc., are few of the top companies.
- End-user Industry
- Chemical & Petrochemical grabbed 35% of the market.
- Country
- Germany leads with a 30% share of the Europe market.
Europe Positive Displacement Pump Market Outlook
The European positive displacement pump market, is estimated at around USD 1.83 billion in 2025 and is projected to increase to USD 2.15 billion in 2032, with a CAGR of 2.33% during 2026-32. This growth is credited to the increasing demand in various industries, including pharmaceuticals, chemicals, and renewable energy, thus guaranteeing a consistent market trend within the forecast period.
Rotary pumps form the largest market in the European market, with 50% of the total sales. Their outstanding ability to handle high-viscosity fluids, maintain steady flow rates, and offer reliable operation in challenging environments makes them invaluable in the chemical, pharmaceutical, and water treatment industries. The continued use of rotary pumps is a testimony to their technical excellence in precision work and in the severe industrial conditions.
The largest portion of the market is held by the chemical and petrochemical industry, which occupies 35% of the demand. Despite the short-term underutilisation of capacity, the industry remains a reliable and significant end-user of positive displacement pumps, driven by regulatory requirements and modernisation efforts. Pumps are essential in the transfer of fluids, chemical dosing, and high-precision in the manufacturing processes across this industry.
Germany controls the European market with a 30% share, which is backed by its strong industrial base and high export potential. The pharmaceutical exports of the country and the current modernisation of infrastructure support the long-term demand of positive displacement pumps. The focus on energy-efficient technologies and regulatory compliance in Germany ensures that the country will be the key driver of market development in Europe in the 2026-2032 period.

Europe Positive Displacement Pump Market Growth Driver
Expansion of Pharmaceutical Manufacturing Stimulates Precision Pump Demand
The European pharmaceutical industry showed a high growth in 2024, thus creating a strong base of demand of positive displacement pumps in manufacturing plants. According to Eurostat reports, the value of pharmaceutical production grew by 12.7% in 2024, to EUR 263 billion, compared to EUR 234 billion in 2023. This growth indicates a high level of investment in biologics, complex pharmaceutical, and high-potency active pharmaceutical ingred manufacturing capacity. In this regard, positive displacement pumps are necessary, which provide accurate, contamination-free fluid transfer and precise dosing functions that cannot be ignored in modern pharmaceutical processes.
The geographical clustering of pharmaceutical manufacturing also consolidates steady demand of pumps. Germany leads the list with EUR 67.9 billion in exports, then Ireland (EUR 56.6 billion) and Belgium (EUR 41.4 billion), thus creating manufacturing centers that require continuous equipment upgrades. The trade surplus of the sector was at an all-time high of EUR 193.6 billion in 2024, which indicates profitability and ability to reinvest. These dynamics ensure that there is a stable and predictable demand of positive displacement pumps that are used in sterile transfer, viscosity control, and high-precision metering over the forecast horizon.
Europe Positive Displacement Pump Market Challenge
Underutilization in Chemical Manufacturing Limits Pump Investment
The Europe chemical industry is facing structural capacity underutilisation that restricts equipment investment and market growth of positive displacement pumps. By Q2 2025, EU27 chemical capacity utilisation was 74.6% below long-term averages and a sign of long-term overcapacity. Manufacturers are still unwilling to invest in new pumping infrastructure or upgrades, operating at 9.5% below pre-crisis levels (2014-2019 average). The long-term underutilisation has continued since Q3 2022, highlighting structural issues that are chronic and not cyclical softness.
Added to these limitations are high energy prices; the European natural gas prices are still 3.3 times higher than the U.S. prices in early 2025, which puts the regional chemical manufacturers at a competitive disadvantage. The EU27 chemical trade surplus declined 17% in H1 2025 versus 2024 to EUR 20.1 billion, further undermining investment confidence. The 2025 forecasts show a decrease after 2.4% growth in 2024, which constrains the short-term demand of positive displacement pumps in an industry that has historically been a significant industrial end-user.
Unlock Market Intelligence
Explore the market potential with our data-driven report
Europe Positive Displacement Pump Market Trend
Accelerating Renewable Energy Infrastructure Generates Industrial Pump Demand
The shift to renewable energy in Europe is transforming the industrial energy infrastructure and establishing new demand streams in the specialised pumping solutions. The European Union has established a binding goal of at least 42.5% of renewable energy by 2030, which is accelerating the installation of solar and wind capacity, with 205 gigawatts of capacity to be installed between 2022 and 2024. This massive growth is driving the need of precision pumps in energy generation, storage and distribution systems where fluid handling is required to be reliable.
The production of hydrogen is a major ancillary market; the capacity of electrolyser in Europe was 8.8 gigawatts per year at the end of 2024 and is expected to increase to 10.5 gigawatts by 2026. Positive displacement pumps are essential in the process of hydrogen production, purification and storage, and thermal energy storage and cooling systems. These advancements establish a long-term, long-term growth trajectory of pumps that facilitate high-precision industrial operations related to the transformation of renewable energy in the continent.
Europe Positive Displacement Pump Market Opportunity
Water Infrastructure Development Establishes Long-Term Pumping Opportunities
The water and wastewater infrastructure investment cycle in Europe has a high growth potential to the positive displacement pump manufacturers. In 2024, multilateral development banks pledged to fund global water projects to the tune of USD 19.6 billion (€17 billion), of which over a quarter was provided by the European Investment Bank. The Water Resilience Programme of the EIB aims at lending up to EUR 15 billion annually between 2025 and 2027, and the overall investments may reach EUR 40 billion, which highlights a consistent, high-volume demand of pumping solutions.
The long-term capital investment in wastewater treatment, water recycling, and associated infrastructure will guarantee long-term pump demand during the 2026-2032 period. This growth trend is further supported by regulatory requirements of better water quality, urban water shortages, and circular economy efforts. Positive displacement pumps are especially adapted to critical applications in water circulation, chemical dosing, and high-precision metering, making this sector a stable and growth-oriented market segment of European pump manufacturers.
Europe Positive Displacement Pump Market Country Analysis
By Country
- Germany
- France
- UK
- Italy
- Spain
- Rest of Europe
Germany holds the largest share of around 30% Europe’s positive displacement pump market, driven by its substantial industrial base spanning chemicals, pharmaceuticals, food processing, and mechanical engineering. The country’s pharmaceutical exports reached €67.9 billion in 2024, reflecting robust production capacity and establishing Germany as the continent’s leading hub for precision manufacturing. Continuous infrastructure modernization across industrial sectors drives consistent pump demand domestically.
Germany’s influence extends to manufacturing and global supply, positioning it as a key exporter of industrial pumping equipment. Ambitious CO2 reduction targets, aiming for a 55% cut by 2030 compared to 1990 levels, stimulate investment in energy-efficient, high-performance positive displacement pumps. The convergence of industrial scale, regulatory compliance, advanced manufacturing, and sustained capital deployment ensures that Germany maintains its position as Europe’s dominant pump market throughout the 2026-2032 period.
Unlock Market Intelligence
Explore the market potential with our data-driven report
Europe Positive Displacement Pump Market Segmentation Analysis
By Pump Type
- Reciprocating Pump
- Piston
- Plunger
- Diaphragm
- Rotary Pump
- Gear
- Screw
- Lobe
- Vane
- Peristaltic Pump
Rotary positive displacement pumps account for 50% of Europe’s market, maintaining the largest share across industrial applications. Their technical advantages, including the ability to manage high-viscosity fluids, deliver precise constant flow rates, and operate reliably under demanding conditions, make them essential in chemical, pharmaceutical, and water treatment applications. Rotary technology’s versatility and durability ensure that it remains the standard for complex industrial processes requiring consistent, high-precision performance.
Their prevalence reflects a critical role in transferring pharmaceutical active ingredients, managing chemical feedstocks, and supporting continuous water circulation. In high-value sectors such as pharmaceuticals, where dosing accuracy and contamination control are non-negotiable, rotary pumps are indispensable.

By End-user Industry
- Oil & Gas
- Power Generation
- Water & Wastewater
- Chemical & Petrochemical
- Food & Beverage
- Pharmaceutical & Biotechnology
- Mining & Minerals
- Pulp & Paper
- Others
The chemical and petrochemical industry represents the largest end-user segment for positive displacement pumps in Europe, holding 35% of total market demand. This leadership reflects the sector’s reliance on pumps for critical fluid transfer, circulation, and precise dosing across polymerization, distillation, and chemical reaction processes. Positive displacement pumps are technically irreplaceable for managing viscous products, reactive intermediates, and applications demanding exact flow control.
Despite current capacity underutilization, European chemical facilities continue to modernize pumping infrastructure to comply with EU environmental regulations and improve operational efficiency. This ongoing modernization supports stable demand for positive displacement pumps through 2032. The sector’s market share highlights its enduring significance, demonstrating that even amid near-term production weakness, chemical and petrochemical operations remain the continent’s largest industrial consumers of high-performance pumping solutions.
Various Market Players in Europe Positive Displacement Pump Market
The companies mentioned below are highly active in the Europe positive displacement pump market, occupying a considerable portion of the market and shaping industry progress.
- Grindex AB
- SPT Pumpen
- Flowserve Corporation
- Grundfos Holding A/S
- Sulzer Ltd.
- Wilo SE
- KSB SE & Co. KGaA
- Alfa Laval AB
- NETZSCH Holding
- VANSAN Makina
- Xavitech Micropumps AB
- Pentair PLC
Market News & Updates
- Alfa Laval AB, 2025:
Alfa Laval launched an upgraded DuraCirc® positive displacement pump featuring integrated Condition Monitoring technology that delivers predictive maintenance alerts and real-time health insights for sanitary pumping systems. The pump achieved a significant 360 PSI pressure capacity advancement over traditional designs (which typically experience contact failure at 20-30 PSI), eliminating the need for weekly grease injection through an oil-filled bearing design. Maintenance intervals were extended conservatively from every 250 operating hours to 3,000-hour oil change intervals. A 60-unit customer deployment demonstrated estimated annual savings exceeding $100,000 through reduced downtime and spare parts consumption, with identical port-to-port compatibility enabling retrofit without requiring motor or pipework modifications.
Frequently Asked Questions
Related Report
1. Market Segmentation
1.1. Research Scope
1.2. Research Methodology
1.3. Definitions and Assumptions
2. Executive Summary
3. Europe Positive Displacement Pump Market Policies, Regulations, and Standards
4. Europe Positive Displacement Pump Market Dynamics
4.1. Growth Factors
4.2. Challenges
4.3. Trends
4.4. Opportunities
5. Europe Positive Displacement Pump Market Statistics, 2022-2032F
5.1. Market Size & Growth Outlook
5.1.1.By Revenues in USD Million
5.1.2.By Units Sold in Million Units
5.2. Market Segmentation & Growth Outlook
5.2.1.By Pump Type
5.2.1.1. Reciprocating Pump- Market Insights and Forecast 2022-2032, USD Million
5.2.1.1.1. Piston- Market Insights and Forecast 2022-2032, USD Million
5.2.1.1.2. Plunger- Market Insights and Forecast 2022-2032, USD Million
5.2.1.1.3. Diaphragm- Market Insights and Forecast 2022-2032, USD Million
5.2.1.2. Rotary Pump- Market Insights and Forecast 2022-2032, USD Million
5.2.1.2.1. Gear- Market Insights and Forecast 2022-2032, USD Million
5.2.1.2.2. Screw- Market Insights and Forecast 2022-2032, USD Million
5.2.1.2.3. Lobe- Market Insights and Forecast 2022-2032, USD Million
5.2.1.2.4. Vane- Market Insights and Forecast 2022-2032, USD Million
5.2.1.3. Peristaltic Pump- Market Insights and Forecast 2022-2032, USD Million
5.2.2.By Pressure Rating
5.2.2.1. Up to 50 bar- Market Insights and Forecast 2022-2032, USD Million
5.2.2.2. 51 to 150 bar- Market Insights and Forecast 2022-2032, USD Million
5.2.2.3. Above 150 bar- Market Insights and Forecast 2022-2032, USD Million
5.2.3.By End-user Industry
5.2.3.1. Oil & Gas- Market Insights and Forecast 2022-2032, USD Million
5.2.3.2. Power Generation- Market Insights and Forecast 2022-2032, USD Million
5.2.3.3. Water & Wastewater- Market Insights and Forecast 2022-2032, USD Million
5.2.3.4. Chemical & Petrochemical- Market Insights and Forecast 2022-2032, USD Million
5.2.3.5. Food & Beverage- Market Insights and Forecast 2022-2032, USD Million
5.2.3.6. Pharmaceutical & Biotechnology- Market Insights and Forecast 2022-2032, USD Million
5.2.3.7. Mining & Minerals- Market Insights and Forecast 2022-2032, USD Million
5.2.3.8. Pulp & Paper- Market Insights and Forecast 2022-2032, USD Million
5.2.3.9. Others- Market Insights and Forecast 2022-2032, USD Million
5.2.4.By Country
5.2.4.1. Germany
5.2.4.2. France
5.2.4.3. UK
5.2.4.4. Italy
5.2.4.5. Spain
5.2.4.6. Rest of Europe
5.2.5.By Competitors
5.2.5.1. Competition Characteristics
5.2.5.2. Market Share & Analysis
6. Germany Positive Displacement Pump Market Statistics, 2022-2032F
6.1. Market Size & Growth Outlook
6.1.1.By Revenues in USD Million
6.1.2.By Units Sold in Million Units
6.2. Market Segmentation & Growth Outlook
6.2.1.By Pump Type- Market Insights and Forecast 2022-2032, USD Million
6.2.2.By Pressure Rating- Market Insights and Forecast 2022-2032, USD Million
6.2.3.By End-user Industry- Market Insights and Forecast 2022-2032, USD Million
7. France Positive Displacement Pump Market Statistics, 2022-2032F
7.1. Market Size & Growth Outlook
7.1.1.By Revenues in USD Million
7.1.2.By Units Sold in Million Units
7.2. Market Segmentation & Growth Outlook
7.2.1.By Pump Type- Market Insights and Forecast 2022-2032, USD Million
7.2.2.By Pressure Rating- Market Insights and Forecast 2022-2032, USD Million
7.2.3.By End-user Industry- Market Insights and Forecast 2022-2032, USD Million
8. UK Positive Displacement Pump Market Statistics, 2022-2032F
8.1. Market Size & Growth Outlook
8.1.1.By Revenues in USD Million
8.1.2.By Units Sold in Million Units
8.2. Market Segmentation & Growth Outlook
8.2.1.By Pump Type- Market Insights and Forecast 2022-2032, USD Million
8.2.2.By Pressure Rating- Market Insights and Forecast 2022-2032, USD Million
8.2.3.By End-user Industry- Market Insights and Forecast 2022-2032, USD Million
9. Italy Positive Displacement Pump Market Statistics, 2022-2032F
9.1. Market Size & Growth Outlook
9.1.1.By Revenues in USD Million
9.1.2.By Units Sold in Million Units
9.2. Market Segmentation & Growth Outlook
9.2.1.By Pump Type- Market Insights and Forecast 2022-2032, USD Million
9.2.2.By Pressure Rating- Market Insights and Forecast 2022-2032, USD Million
9.2.3.By End-user Industry- Market Insights and Forecast 2022-2032, USD Million
10. Spain Positive Displacement Pump Market Statistics, 2022-2032F
10.1. Market Size & Growth Outlook
10.1.1. By Revenues in USD Million
10.1.2. By Units Sold in Million Units
10.2. Market Segmentation & Growth Outlook
10.2.1. By Pump Type- Market Insights and Forecast 2022-2032, USD Million
10.2.2. By Pressure Rating- Market Insights and Forecast 2022-2032, USD Million
10.2.3. By End-user Industry- Market Insights and Forecast 2022-2032, USD Million
11. Competitive Outlook
11.1. Company Profiles
11.1.1. Grundfos Holding A/S
11.1.1.1. Business Description
11.1.1.2. Product Portfolio
11.1.1.3. Collaborations & Alliances
11.1.1.4. Recent Developments
11.1.1.5. Financial Details
11.1.1.6. Others
11.1.2. Sulzer Ltd.
11.1.2.1. Business Description
11.1.2.2. Product Portfolio
11.1.2.3. Collaborations & Alliances
11.1.2.4. Recent Developments
11.1.2.5. Financial Details
11.1.2.6. Others
11.1.3. Wilo SE
11.1.3.1. Business Description
11.1.3.2. Product Portfolio
11.1.3.3. Collaborations & Alliances
11.1.3.4. Recent Developments
11.1.3.5. Financial Details
11.1.3.6. Others
11.1.4. KSB SE & Co. KGaA
11.1.4.1. Business Description
11.1.4.2. Product Portfolio
11.1.4.3. Collaborations & Alliances
11.1.4.4. Recent Developments
11.1.4.5. Financial Details
11.1.4.6. Others
11.1.5. Alfa Laval AB
11.1.5.1. Business Description
11.1.5.2. Product Portfolio
11.1.5.3. Collaborations & Alliances
11.1.5.4. Recent Developments
11.1.5.5. Financial Details
11.1.5.6. Others
11.1.6. Grindex AB
11.1.6.1. Business Description
11.1.6.2. Product Portfolio
11.1.6.3. Collaborations & Alliances
11.1.6.4. Recent Developments
11.1.6.5. Financial Details
11.1.6.6. Others
11.1.7. SPT Pumpen
11.1.7.1. Business Description
11.1.7.2. Product Portfolio
11.1.7.3. Collaborations & Alliances
11.1.7.4. Recent Developments
11.1.7.5. Financial Details
11.1.7.6. Others
11.1.8. Flowserve Corporation
11.1.8.1. Business Description
11.1.8.2. Product Portfolio
11.1.8.3. Collaborations & Alliances
11.1.8.4. Recent Developments
11.1.8.5. Financial Details
11.1.8.6. Others
11.1.9. NETZSCH Holding
11.1.9.1. Business Description
11.1.9.2. Product Portfolio
11.1.9.3. Collaborations & Alliances
11.1.9.4. Recent Developments
11.1.9.5. Financial Details
11.1.9.6. Others
11.1.10. VANSAN Makina
11.1.10.1.Business Description
11.1.10.2.Product Portfolio
11.1.10.3.Collaborations & Alliances
11.1.10.4.Recent Developments
11.1.10.5.Financial Details
11.1.10.6.Others
11.1.11. Xavitech Micropumps AB
11.1.11.1.Business Description
11.1.11.2.Product Portfolio
11.1.11.3.Collaborations & Alliances
11.1.11.4.Recent Developments
11.1.11.5.Financial Details
11.1.11.6.Others
11.1.12. Pentair PLC
11.1.12.1.Business Description
11.1.12.2.Product Portfolio
11.1.12.3.Collaborations & Alliances
11.1.12.4.Recent Developments
11.1.12.5.Financial Details
11.1.12.6.Others
12. Disclaimer
| Segment | Sub-Segment |
|---|---|
| By Pump Type |
|
| By Pressure Rating |
|
| By End-user Industry |
|
| By Country |
|
Research Methodology
This study followed a structured approach comprising four key phases to assess the size and scope of the electro-oxidation market. The process began with thorough secondary research to collect data on the target market, related markets, and broader industry context. These findings, along with preliminary assumptions and estimates, were then validated through extensive primary research involving industry experts from across the value chain. To calculate the overall market size, both top-down and bottom-up methodologies were employed. Finally, market segmentation and data triangulation techniques were applied to refine and validate segment-level estimations.
Secondary Research
The secondary research phase involved gathering data from a wide range of credible and published sources. This step helped in identifying industry trends, defining market segmentation, and understanding the market landscape and value chain.
Sources consulted during this phase included:
- Company annual reports, investor presentations, and press releases
- Industry white papers and certified publications
- Trade directories and market-recognized databases
- Articles from authoritative authors and reputable journals
- Gold and silver standard websites
Secondary research was critical in mapping out the industry's value chain and monetary flow, identifying key market segments, understanding regional variations, and tracking significant industry developments.
Other key sources:
- Financial disclosures
- Industry associations and trade bodies
- News outlets and business magazines
- Academic journals and research studies
- Paid industry databases
Primary Research
To validate secondary data and gain deeper market insights, primary research was conducted with key stakeholders across both the supply and demand sides of the market.
On the demand side, participants included decision-makers and influencers from end-user industries—such as CIOs, CTOs, and CSOs—who provided first-hand perspectives on market needs, product usage, and future expectations.
On the supply side, interviews were conducted with manufacturers, industry associations, and institutional participants to gather insights into current offerings, product pipelines, and market challenges.
Primary interviews provided critical inputs such as:
- Market size and revenue data
- Product and service breakdowns
- Market forecasts
- Regional and application-specific trends
Stakeholders consulted included:
- Leading OEM and solution providers
- Channel and distribution partners
- End users across various applications
- Independent consultants and industry specialists
Market Size Estimation and Data Triangulation
- Identifying Key Market Participants (Secondary Research)
- Goal: To identify the major players or companies in the target market. This typically involves using publicly available data sources such as industry reports, market research publications, and financial statements of companies.
- Tools: Reports from firms like Gartner, Forrester, Euromonitor, Statista, IBISWorld, and others. Public financial statements, news articles, and press releases from top market players.
- Extracting Earnings of Key Market Participants
- Goal: To estimate the earnings generated from the product or service being analyzed. This step helps in understanding the revenue potential of each market player in a specific geography.
- Methods: Earnings data can be gathered from:
- Publicly available financial reports (for listed companies).
- Interviews and primary data sources from professionals, such as Directors, VPs, SVPs, etc. This is especially useful for understanding more nuanced, internal data that isn't publicly disclosed.
- Annual reports and investor presentations of key players.
- Data Collation and Development of a Relevant Data Model
- Goal: To collate inputs from both primary and secondary sources into a structured, data-driven model for market estimation. This model will incorporate key market KPIs and any independent variables relevant to the market.
- Key KPIs: These could include:
- Market size, growth rate, and demand drivers.
- Industry-specific metrics like market share, average revenue per customer (ARPC), or average deal size.
- External variables, such as economic growth rates, inflation rates, or commodity prices, that could affect the market.
- Data Modeling: Based on this data, the market forecasts are developed for the next 5 years. A combination of trend analysis, scenario modeling, and statistical regression might be used to generate projections.
- Scenario Analysis
- Goal: To test different assumptions and validate how sensitive the market is to changes in key variables (e.g., market demand, regulatory changes, technological disruptions).
- Types of Scenarios:
- Base Case: Based on current assumptions and historical data.
- Best-Case Scenario: Assuming favorable market conditions, regulatory environments, and technological advancements.
- Worst-Case Scenario: Accounting for adverse factors, such as economic downturns, stricter regulations, or unexpected disruptions.


