Asia Pacific Positive Displacement Pump Market Report: Trends, Growth and Forecast (2026-2032)
By Pump Type (Reciprocating Pump (Piston, Plunger, Diaphragm), Rotary Pump (Gear, Screw, Lobe, Vane), Peristaltic Pump), By Pressure Rating (Up to 50 bar, 51 to 150 bar, Above 150 bar), By End-user Industry (Oil & Gas, Power Generation, Water & Wastewater, Chemical & Petrochemical, Food & Beverage, Pharmaceutical & Biotechnology, Mining & Minerals, Pulp & Paper, Others), By Country (China, India, Japan, South Korea, Australia, Rest of Asia Pacific) ... Read more
|
Major Players
|
Asia Pacific Positive Displacement Pump Market Statistics and Insights, 2026
- Market Size Statistics
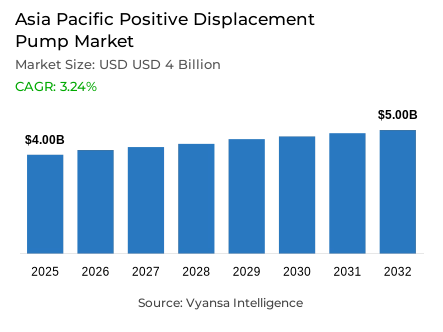
- Asia Pacific positive displacement pump market is estimated at USD 4 billion in 2025.
- The market size is expected to grow to USD 5 billion by 2032.
- Market to register a cagr of around 3.24% during 2026-32.
- Pump Type Shares
- Rotary pump grabbed market share of 45%.
- Competition
- Positive displacement pump in Asia Pacific is currently being catered to by more than 10 companies.
- Top 5 companies acquired around 65% of the market share.
- The Weir Group PLC; NETZSCH Holding; Sulzer Ltd.; Grundfos Holding A/S; Xylem Inc. etc., are few of the top companies.
- End-user Industry
- Water & Wastewater grabbed 40% of the market.
- Country
- China leads with a 40% share of the Asia Pacific market.
Asia Pacific Positive Displacement Pump Market Outlook
The Asia Pacific positive displacement pump market is estimated to be USD 4 billion in 2025 and is projected to be around USD 5 billion in 2032 with a compound annual growth rate of about 3.24% in 2026-2032. This positive growth prospect is backed by long term investment requirements in municipal and industrial water systems. The ongoing shortages in water and wastewater infrastructure funding remain a source of constant equipment demand, as governments and utilities strive to increase treatment capacity, modernise older networks, and enhance service coverage in urban and rural regions.
One of the key pillars of this perspective is long-term capital investment in water and wastewater projects. The region needs almost USD 250 billion per year to satisfy water, sanitation, and hygiene demands, and the current public funding is less than 40% of the demand. This deficit continues to keep infrastructure projects on the go in wastewater treatment plants, potable water systems and sludge management facilities. The positive displacement pumps are still needed in these applications because they can be used to pump viscous fluids, sludge, and accurate dosing of chemicals, thus guaranteeing a repeat replacement and upgrade cycle.
The market direction is further determined by the type of pump and the end-user trends. Rotary pumps represent about 45% of the total market volume, which is indicative of their high applicability to municipal and industrial water conditions, which demand constant flow and solids-handling capacity. In end-user terms, the largest segment of the industry is water and wastewater treatment, which constitutes approximately 40% of the total demand. This segment is the most stable source of pump procurement due to regulatory requirements, urban population growth, and more stringent environmental standards.
China is the key market in the regional perspective, with an estimated 40% of the demand in the Asia Pacific. High equipment purchasing levels are maintained by large-scale investment in national development plans such as sewage expansion, water reuse, and network upgrades. The size of China, coupled with an increasing use of modern and digitally compatible systems, still has an impact on procurement practices and growth momentum in the broader Asia Pacific market.

Asia Pacific Positive Displacement Pump Market Growth Driver
Infrastructure Investment Momentum Supporting Long-Term Demand
The chronic underinvestment in municipal and industrial water infrastructure is a key factor that is shaping the Asia Pacific positive displacement pump market. According to the Asian Water Development Outlook 2025 by Asian Development Bank, the estimated amount needed to satisfy the WASH needs of the region is approximately USD 250 billion per year up to 2040, but the current public expenditure is less than 40% of the estimated amount. This long-term deficit requires continuous capital investment in wastewater treatment, drinking water distribution, and rural supply systems. The direct result of such infrastructure programs is the repeated purchase of positive displacement pumps that are needed in sludge handling, chemical dosing, and controlled flow applications in water utilities.
This demand base is strengthened by concurrent industrial growth. The increasing foreign direct investment and production of manufacturing in the leading economies in Asia-Pacific are pushing new installations of process water, cooling, and effluent treatment systems. Industrial plants are increasingly requiring accurate, high-reliability fluid-handling solutions, which continue to maintain a consistent equipment replacement and growth cycle among municipal and industrial end users.
Asia Pacific Positive Displacement Pump Market Challenge
Environmental Stress and Climate Volatility Restraining Operational Efficiency
The pace of environmental degradation is a structural limitation to the water infrastructure operators in Asia-Pacific. The 2025 assessment by the Asian Development Bank indicates that the extensive degradation of rivers, aquifers, wetlands, and forests is compromising freshwater supply, especially in highly populated and industrialized corridors. The loss of groundwater in urban basins and the deterioration of surface water quality complicate the treatment process, increase the cost of operation, and strain the available pumping facilities that are not designed to operate under degraded source-water conditions. These make it difficult to plan systems and postpone project execution schedules of utilities.
These constraints are further aggravated by climate-induced extreme weather. The area contributes about 41% of the worldwide floods, which subject water infrastructure to physical damages, operational disturbances, and rapid wear. Flooding, saltwater intrusion, and storm-related outages force utilities and industrial end users to redirect capital to emergency repairs instead of planned upgrades, which introduces uncertainty in procurement cycles even though long-term infrastructure requirements are structurally sound.
Unlock Market Intelligence
Explore the market potential with our data-driven report
Asia Pacific Positive Displacement Pump Market Trend
Digital Integration Reshaping Equipment Specifications and Procurement
The Asia Pacific positive displacement pump market is being redefined by gradual adoption of smart water technologies that are transforming performance expectations. According to World Bank evaluations released in 2025, less than 10% of utilities in low- and middle-income economies are already using sophisticated digital solutions, including AI analytics or digital twins. This low penetration underscores the early-stage of digital transformation in most parts of the region. Nevertheless, the direction of change is shown by the leading markets, especially where utilities are focused on efficiency and loss minimization.
China is an example of this transition, with more than 90% of urban water utilities implementing simple IoT monitoring by 2024 and approximately 70% of new wastewater facilities incorporating smart systems. These implementations show practical advantages, such as 20-50% non-revenue water savings. As a result, utilities are gradually specifying pumps that are compatible with VFDs, embedded sensors, and data platforms, and are moving the demand to digitally enabled, higher-specification equipment.
Asia Pacific Positive Displacement Pump Market Opportunity
Treatment Expansion and Water Reuse Unlocking High-Value Growth Potential
The growth in wastewater treatment and water reuse infrastructure due to policy will present a significant future opportunity to equipment vendors. The water reuse market in China is estimated at USD 2.07 billion in 2023 and is expected to almost reach double by 2030 due to the mandates that promote the use of recycled water in municipal and industrial processes. The 14th Five-Year Plan has large-scale investments in the form of increased sewage systems, increased treatment rates, and large additions to daily treatment capacity, which generate concentrated capital expenditure cycles.
Such programs prefer positive displacement pumps that are reliable in primary, secondary, and tertiary treatment processes. The same trends are being observed in Southeast and South Asia, where urbanization and water shortage are fueling the use of reuse. The utilities and industrial end users are becoming more lifecycle efficient than cost effective, with a preference to purchase high quality equipment and enter into long term service contracts in line with the increased treatment capacity goals.
Asia Pacific Positive Displacement Pump Market Country Analysis
By Country
- China
- India
- Japan
- South Korea
- Australia
- Rest of Asia Pacific
China holds a dominant position in the Asia Pacific positive displacement pump market, accounting for roughly 40% of regional demand. This leadership is underpinned by unparalleled infrastructure investment scale and policy prioritization of water security. Government commitments exceeding 5.4 trillion yuan under the 14th Five-Year Plan have accelerated sewage treatment expansion, water reuse deployment, and network modernization, driving sustained equipment procurement across municipal and industrial projects.
Annual water conservancy spending surpassed 1.3 trillion yuan in 2024, reflecting the intensity of ongoing construction activity. China’s water and wastewater treatment industry reached approximately USD 152 billion in 2024, supported by strong annual growth. The country’s investment-driven scale, combined with advanced technology adoption, positions it as the primary reference market, with its standards and procurement practices increasingly influencing neighboring Asia-Pacific economies.
Unlock Market Intelligence
Explore the market potential with our data-driven report
Asia Pacific Positive Displacement Pump Market Segmentation Analysis
By Pump Type
- Reciprocating Pump
- Piston
- Plunger
- Diaphragm
- Rotary Pump
- Gear
- Screw
- Lobe
- Vane
- Peristaltic Pump
Rotary pumps represent the largest pump type segment within the Asia Pacific positive displacement pump market, accounting for approximately 45% of total market share. Their dominance reflects strong suitability for water and wastewater environments, where consistent flow, solids handling capability, and resistance to cavitation are critical. Rotary lobe configurations, in particular, are widely specified across sludge transfer and biological treatment stages, supporting reliable performance under abrasive and variable-load conditions commonly found in municipal facilities.
Continued design refinement reinforces this leadership position. Manufacturers have optimized rotary platforms for chemical dosing, viscous fluid handling, and energy-efficient operation, extending applicability across both municipal and industrial end users. This technological maturity, combined with incremental innovation, ensures rotary pumps remain the preferred architecture within treatment-focused procurement, particularly where operational stability and maintenance predictability are prioritized.

By End-user Industry
- Oil & Gas
- Power Generation
- Water & Wastewater
- Chemical & Petrochemical
- Food & Beverage
- Pharmaceutical & Biotechnology
- Mining & Minerals
- Pulp & Paper
- Others
Water and wastewater treatment represent the largest end-user industry within the Asia Pacific positive displacement pump market, accounting for approximately 40% of total demand. This concentration reflects the essential role of positive displacement pumps across all treatment stages, from influent handling and sludge processing to chemical dosing and reuse distribution. Municipal utilities, industrial effluent treatment plants, and decentralized recycling systems collectively form the region’s most consistent equipment-consuming end-user group.
Investment cycles in this segment are closely linked to regulatory mandates, urban expansion, and environmental compliance requirements. Treatment facilities typically operate under long asset lifecycles, prompting end users to prioritize reliability, efficiency, and service support. As treatment standards tighten and reuse targets expand, this end-user group increasingly specifies advanced pump designs, reinforcing its influence on overall market structure and technology adoption patterns.
Various Market Players in Asia Pacific Positive Displacement Pump Market
The companies mentioned below are highly active in the Asia Pacific positive displacement pump market, occupying a considerable portion of the market and shaping industry progress.
- The Weir Group PLC
- NETZSCH Holding
- Sulzer Ltd.
- Grundfos Holding A/S
- Xylem Inc.
- KSB SE & Co. KGaA
- Ebara Corporation
- Flowserve Corporation
- Pentair PLC
- Ingersoll Rand
- SPX FLOW Inc.
- Atlas Copco AB
Market News & Updates
- NETZSCH Holding, 2025:
NETZSCH unveiled the NEMO® Progressing Cavity Battery Industry Pump specifically engineered for lithium battery manufacturing. This pump features a magnetic drive coupling that eliminates traditional shaft seals, delivering completely zero-leak operation with no vapor emissions or air ingress—preventing the bubble formation critical for high-purity battery electrode coating and slurry transfer processes. The pump's design eliminates all metal-to-metal contact between wetted components, preventing metal particle contamination of electrode slurries. Complementing this innovation, the PERIPRO™ Peristaltic Pump platform delivers 30% energy savings compared to traditional hose pump designs while requiring 90% less lubricant, making it ideal for electrode slurry coating, mixing, transfer/recirculation, and battery recycling applications across India and the broader Asia-Pacific market.
Frequently Asked Questions
Related Report
1. Market Segmentation
1.1. Research Scope
1.2. Research Methodology
1.3. Definitions and Assumptions
2. Executive Summary
3. Asia Pacific Positive Displacement Pump Market Policies, Regulations, and Standards
4. Asia Pacific Positive Displacement Pump Market Dynamics
4.1. Growth Factors
4.2. Challenges
4.3. Trends
4.4. Opportunities
5. Asia Pacific Positive Displacement Pump Market Statistics, 2022-2032F
5.1. Market Size & Growth Outlook
5.1.1.By Revenues in USD Million
5.1.2.By Units Sold in Million Units
5.2. Market Segmentation & Growth Outlook
5.2.1.By Pump Type
5.2.1.1. Reciprocating Pump- Market Insights and Forecast 2022-2032, USD Million
5.2.1.1.1. Piston- Market Insights and Forecast 2022-2032, USD Million
5.2.1.1.2. Plunger- Market Insights and Forecast 2022-2032, USD Million
5.2.1.1.3. Diaphragm- Market Insights and Forecast 2022-2032, USD Million
5.2.1.2. Rotary Pump- Market Insights and Forecast 2022-2032, USD Million
5.2.1.2.1. Gear- Market Insights and Forecast 2022-2032, USD Million
5.2.1.2.2. Screw- Market Insights and Forecast 2022-2032, USD Million
5.2.1.2.3. Lobe- Market Insights and Forecast 2022-2032, USD Million
5.2.1.2.4. Vane- Market Insights and Forecast 2022-2032, USD Million
5.2.1.3. Peristaltic Pump- Market Insights and Forecast 2022-2032, USD Million
5.2.2.By Pressure Rating
5.2.2.1. Up to 50 bar- Market Insights and Forecast 2022-2032, USD Million
5.2.2.2. 51 to 150 bar- Market Insights and Forecast 2022-2032, USD Million
5.2.2.3. Above 150 bar- Market Insights and Forecast 2022-2032, USD Million
5.2.3.By End-user Industry
5.2.3.1. Oil & Gas- Market Insights and Forecast 2022-2032, USD Million
5.2.3.2. Power Generation- Market Insights and Forecast 2022-2032, USD Million
5.2.3.3. Water & Wastewater- Market Insights and Forecast 2022-2032, USD Million
5.2.3.4. Chemical & Petrochemical- Market Insights and Forecast 2022-2032, USD Million
5.2.3.5. Food & Beverage- Market Insights and Forecast 2022-2032, USD Million
5.2.3.6. Pharmaceutical & Biotechnology- Market Insights and Forecast 2022-2032, USD Million
5.2.3.7. Mining & Minerals- Market Insights and Forecast 2022-2032, USD Million
5.2.3.8. Pulp & Paper- Market Insights and Forecast 2022-2032, USD Million
5.2.3.9. Others- Market Insights and Forecast 2022-2032, USD Million
5.2.4.By Country
5.2.4.1. China
5.2.4.2. India
5.2.4.3. Japan
5.2.4.4. South Korea
5.2.4.5. Australia
5.2.4.6. Rest of Asia Pacific
5.2.5.By Competitors
5.2.5.1. Competition Characteristics
5.2.5.2. Market Share & Analysis
6. China Positive Displacement Pump Market Statistics, 2022-2032F
6.1. Market Size & Growth Outlook
6.1.1.By Revenues in USD Million
6.1.2.By Units Sold in Million Units
6.2. Market Segmentation & Growth Outlook
6.2.1.By Pump Type- Market Insights and Forecast 2022-2032, USD Million
6.2.2.By Pressure Rating- Market Insights and Forecast 2022-2032, USD Million
6.2.3.By End-user Industry- Market Insights and Forecast 2022-2032, USD Million
7. India Positive Displacement Pump Market Statistics, 2022-2032F
7.1. Market Size & Growth Outlook
7.1.1.By Revenues in USD Million
7.1.2.By Units Sold in Million Units
7.2. Market Segmentation & Growth Outlook
7.2.1.By Pump Type- Market Insights and Forecast 2022-2032, USD Million
7.2.2.By Pressure Rating- Market Insights and Forecast 2022-2032, USD Million
7.2.3.By End-user Industry- Market Insights and Forecast 2022-2032, USD Million
8. Japan Positive Displacement Pump Market Statistics, 2022-2032F
8.1. Market Size & Growth Outlook
8.1.1.By Revenues in USD Million
8.1.2.By Units Sold in Million Units
8.2. Market Segmentation & Growth Outlook
8.2.1.By Pump Type- Market Insights and Forecast 2022-2032, USD Million
8.2.2.By Pressure Rating- Market Insights and Forecast 2022-2032, USD Million
8.2.3.By End-user Industry- Market Insights and Forecast 2022-2032, USD Million
9. South Korea Positive Displacement Pump Market Statistics, 2022-2032F
9.1. Market Size & Growth Outlook
9.1.1.By Revenues in USD Million
9.1.2.By Units Sold in Million Units
9.2. Market Segmentation & Growth Outlook
9.2.1.By Pump Type- Market Insights and Forecast 2022-2032, USD Million
9.2.2.By Pressure Rating- Market Insights and Forecast 2022-2032, USD Million
9.2.3.By End-user Industry- Market Insights and Forecast 2022-2032, USD Million
10. Australia Positive Displacement Pump Market Statistics, 2022-2032F
10.1. Market Size & Growth Outlook
10.1.1. By Revenues in USD Million
10.1.2. By Units Sold in Million Units
10.2. Market Segmentation & Growth Outlook
10.2.1. By Pump Type- Market Insights and Forecast 2022-2032, USD Million
10.2.2. By Pressure Rating- Market Insights and Forecast 2022-2032, USD Million
10.2.3. By End-user Industry- Market Insights and Forecast 2022-2032, USD Million
11. Competitive Outlook
11.1. Company Profiles
11.1.1. Grundfos Holding A/S
11.1.1.1. Business Description
11.1.1.2. Product Portfolio
11.1.1.3. Collaborations & Alliances
11.1.1.4. Recent Developments
11.1.1.5. Financial Details
11.1.1.6. Others
11.1.2. Xylem Inc.
11.1.2.1. Business Description
11.1.2.2. Product Portfolio
11.1.2.3. Collaborations & Alliances
11.1.2.4. Recent Developments
11.1.2.5. Financial Details
11.1.2.6. Others
11.1.3. KSB SE & Co. KGaA
11.1.3.1. Business Description
11.1.3.2. Product Portfolio
11.1.3.3. Collaborations & Alliances
11.1.3.4. Recent Developments
11.1.3.5. Financial Details
11.1.3.6. Others
11.1.4. Ebara Corporation
11.1.4.1. Business Description
11.1.4.2. Product Portfolio
11.1.4.3. Collaborations & Alliances
11.1.4.4. Recent Developments
11.1.4.5. Financial Details
11.1.4.6. Others
11.1.5. Flowserve Corporation
11.1.5.1. Business Description
11.1.5.2. Product Portfolio
11.1.5.3. Collaborations & Alliances
11.1.5.4. Recent Developments
11.1.5.5. Financial Details
11.1.5.6. Others
11.1.6. The Weir Group PLC
11.1.6.1. Business Description
11.1.6.2. Product Portfolio
11.1.6.3. Collaborations & Alliances
11.1.6.4. Recent Developments
11.1.6.5. Financial Details
11.1.6.6. Others
11.1.7. NETZSCH Holding
11.1.7.1. Business Description
11.1.7.2. Product Portfolio
11.1.7.3. Collaborations & Alliances
11.1.7.4. Recent Developments
11.1.7.5. Financial Details
11.1.7.6. Others
11.1.8. Sulzer Ltd.
11.1.8.1. Business Description
11.1.8.2. Product Portfolio
11.1.8.3. Collaborations & Alliances
11.1.8.4. Recent Developments
11.1.8.5. Financial Details
11.1.8.6. Others
11.1.9. Pentair PLC
11.1.9.1. Business Description
11.1.9.2. Product Portfolio
11.1.9.3. Collaborations & Alliances
11.1.9.4. Recent Developments
11.1.9.5. Financial Details
11.1.9.6. Others
11.1.10. Ingersoll Rand
11.1.10.1.Business Description
11.1.10.2.Product Portfolio
11.1.10.3.Collaborations & Alliances
11.1.10.4.Recent Developments
11.1.10.5.Financial Details
11.1.10.6.Others
11.1.11. SPX FLOW Inc.
11.1.11.1.Business Description
11.1.11.2.Product Portfolio
11.1.11.3.Collaborations & Alliances
11.1.11.4.Recent Developments
11.1.11.5.Financial Details
11.1.11.6.Others
11.1.12. Atlas Copco AB
11.1.12.1.Business Description
11.1.12.2.Product Portfolio
11.1.12.3.Collaborations & Alliances
11.1.12.4.Recent Developments
11.1.12.5.Financial Details
11.1.12.6.Others
12. Disclaimer
| Segment | Sub-Segment |
|---|---|
| By Pump Type |
|
| By Pressure Rating |
|
| By End-user Industry |
|
| By Country |
|
Research Methodology
This study followed a structured approach comprising four key phases to assess the size and scope of the electro-oxidation market. The process began with thorough secondary research to collect data on the target market, related markets, and broader industry context. These findings, along with preliminary assumptions and estimates, were then validated through extensive primary research involving industry experts from across the value chain. To calculate the overall market size, both top-down and bottom-up methodologies were employed. Finally, market segmentation and data triangulation techniques were applied to refine and validate segment-level estimations.
Secondary Research
The secondary research phase involved gathering data from a wide range of credible and published sources. This step helped in identifying industry trends, defining market segmentation, and understanding the market landscape and value chain.
Sources consulted during this phase included:
- Company annual reports, investor presentations, and press releases
- Industry white papers and certified publications
- Trade directories and market-recognized databases
- Articles from authoritative authors and reputable journals
- Gold and silver standard websites
Secondary research was critical in mapping out the industry's value chain and monetary flow, identifying key market segments, understanding regional variations, and tracking significant industry developments.
Other key sources:
- Financial disclosures
- Industry associations and trade bodies
- News outlets and business magazines
- Academic journals and research studies
- Paid industry databases
Primary Research
To validate secondary data and gain deeper market insights, primary research was conducted with key stakeholders across both the supply and demand sides of the market.
On the demand side, participants included decision-makers and influencers from end-user industries—such as CIOs, CTOs, and CSOs—who provided first-hand perspectives on market needs, product usage, and future expectations.
On the supply side, interviews were conducted with manufacturers, industry associations, and institutional participants to gather insights into current offerings, product pipelines, and market challenges.
Primary interviews provided critical inputs such as:
- Market size and revenue data
- Product and service breakdowns
- Market forecasts
- Regional and application-specific trends
Stakeholders consulted included:
- Leading OEM and solution providers
- Channel and distribution partners
- End users across various applications
- Independent consultants and industry specialists
Market Size Estimation and Data Triangulation
- Identifying Key Market Participants (Secondary Research)
- Goal: To identify the major players or companies in the target market. This typically involves using publicly available data sources such as industry reports, market research publications, and financial statements of companies.
- Tools: Reports from firms like Gartner, Forrester, Euromonitor, Statista, IBISWorld, and others. Public financial statements, news articles, and press releases from top market players.
- Extracting Earnings of Key Market Participants
- Goal: To estimate the earnings generated from the product or service being analyzed. This step helps in understanding the revenue potential of each market player in a specific geography.
- Methods: Earnings data can be gathered from:
- Publicly available financial reports (for listed companies).
- Interviews and primary data sources from professionals, such as Directors, VPs, SVPs, etc. This is especially useful for understanding more nuanced, internal data that isn't publicly disclosed.
- Annual reports and investor presentations of key players.
- Data Collation and Development of a Relevant Data Model
- Goal: To collate inputs from both primary and secondary sources into a structured, data-driven model for market estimation. This model will incorporate key market KPIs and any independent variables relevant to the market.
- Key KPIs: These could include:
- Market size, growth rate, and demand drivers.
- Industry-specific metrics like market share, average revenue per customer (ARPC), or average deal size.
- External variables, such as economic growth rates, inflation rates, or commodity prices, that could affect the market.
- Data Modeling: Based on this data, the market forecasts are developed for the next 5 years. A combination of trend analysis, scenario modeling, and statistical regression might be used to generate projections.
- Scenario Analysis
- Goal: To test different assumptions and validate how sensitive the market is to changes in key variables (e.g., market demand, regulatory changes, technological disruptions).
- Types of Scenarios:
- Base Case: Based on current assumptions and historical data.
- Best-Case Scenario: Assuming favorable market conditions, regulatory environments, and technological advancements.
- Worst-Case Scenario: Accounting for adverse factors, such as economic downturns, stricter regulations, or unexpected disruptions.


