Europe Industrial Gases Market Report: Trends, Growth and Forecast (2026-2032)
Gas (Nitrogen Gas, Oxygen Gas, Carbon dioxide Gas, Argon Gas, Hydrogen Gas, Helium Gas, Acetylene Gas, Others), Application (Combustion and Process Oxygen, Welding and Metal Fabrication, Inerting Blanketing and Heat Treating, Cryogenics and liquefaction, Chemical Synthesis and Hydrogenation, Purging and Purifications, Analytical and Calibration), Supply Mode (Packaged Gas Supply (Merchant Sales), Bulk or Liquid Gas Supply, Onsite Generation or Pipeline Supply, Gas-as-a-Service Model), End User Industry (Oil and Gas, Petrochemicals and Chemicals, Power and Energy, Mining, Steelmaking, Metals, Healthcare, Food and Beverages, Fertilizers, Others), Country (Germany, UK, France, Italy, Belgium, Spain, Sweden, Netherlands, Rest of Europe) ... Read more
|
Major Players
|
Europe Industrial Gases Market Statistics and Insights, 2026
- Market Size Statistics
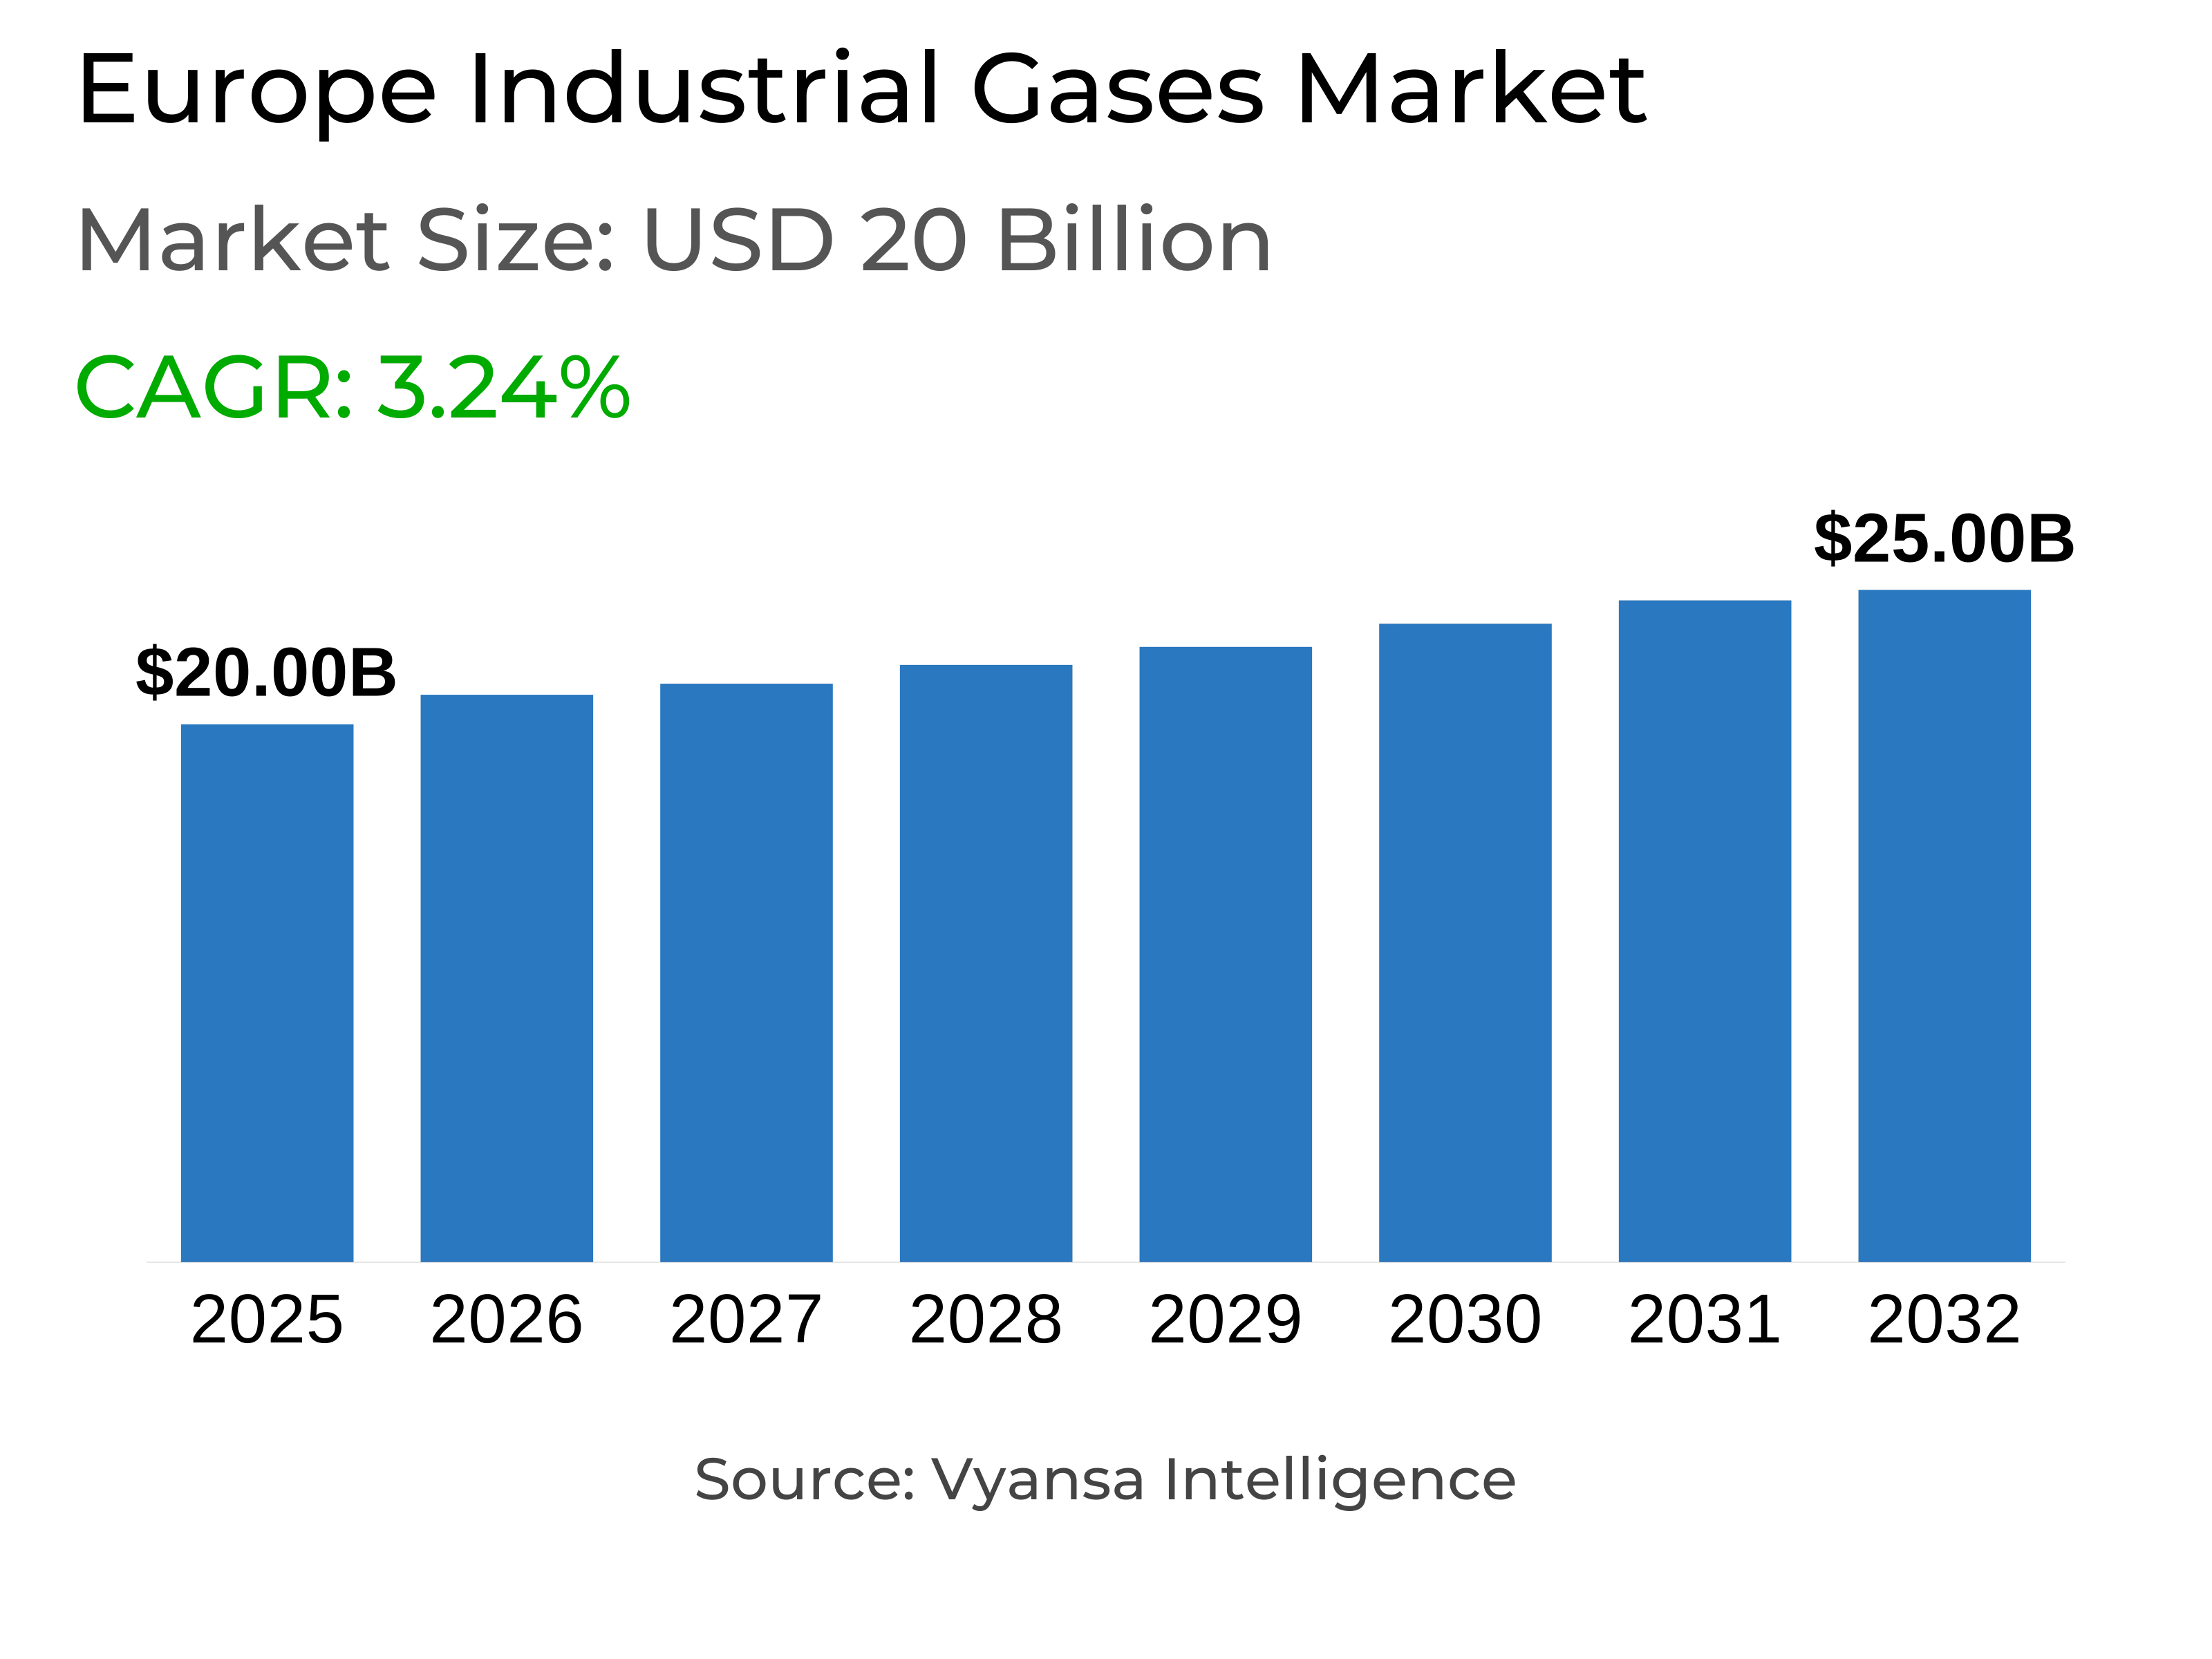
- Europe industrial gases market is estimated at USD 20 billion.
- The market size is expected to grow to USD 25 billion by 2032.
- Market to register a cagr of around 3.24% during 2026-32.
- Application Shares
- Chemical synthesis and hydrogenation grabbed market share of 25%.
- Competition
- More than 10 companies are actively engaged in producing industrial gases in europe.
- Top 5 companies acquired around 75% of the market share.
- Taiyo Nippon Sanso, Nippon Sanso Holdings Corporation, Iwatani Corporation, Linde plc, Air Liquide S.A. etc., are few of the top companies.
- End User Industry
- Petrochemicals and chemicals grabbed 30% of the market.
- Country
- Germany leads with a 30% share of the europe market.
Europe Industrial Gases Market Outlook
The Europe Industrial Gases Market was valued at approximately USD 20 billion in 2025 and is expected to reach USD 25 billion by 2032, growing at a CAGR of about 3.24% during 2026-2032. The region is seeing a structural shift toward renewable hydrogen as part of decarbonization targets and to increase energy independence. At the end of 2023, more than 500 hydrogen production sites were present in Europe, with 11.23 million tonnes of capacity and an annual production of 7.94 million tonnes. Encouraged by the RePowerEU program, 40 gigawatts of electrolysers will be installed by 2030, which will result in large-scale production of renewable hydrogen and therefore long-term industrial gas demand.
The chemical synthesis and hydrogenation industries utilize approximately 25% of all industrial gases, forming the backbone for the production of important feedstocks like benzene, ethylene, and chlorine. In such processes, industrial gas suppliers remain indispensable partners, offering high-purity gases and sophisticated storage to maintain output at maximum capacity. Stability in the sector is underpinned by robust demand from refineries and ammonia plants, which together consume more than 80% of hydrogen used across Europe.
About 30% of Europe’s industrial gases market is comprised of end users in petrochemicals and chemicals, a fact that underlines the dependence of the industry on high-volume gases for refining, synthesis, and specialty manufacturing. While high energy prices and overcapacity continue to pose some structural challenges for the chemical industry, growth in pharmaceuticals, semiconductors, and specialty chemicals keeps sustaining gas consumption.
Germany leads the regional landscape and accounts for approximately 30% of the European market. With a huge hydrogen production capacity of nearly 2 million tonnes annually, coupled with a strong industrial base across chemicals, refining, and electronics, the dominance of Germany is consolidated. With strong infrastructure in place to support export-oriented industries, Germany will continue to be the bedrock of growth for Europe's industrial gases through 2032.

Europe Industrial Gases Market Growth Driver
Rising Adoption of Renewable Hydrogen for Industrial Decarbonization
Europe is continuing to scale up renewable hydrogen production in order to accelerate industrial decarbonization and reach the climate objectives set forth. In 2023, Europe had 512 operational hydrogen production facilities with a cumulative capacity of 11.23 million tonnes and produced 7.94 million tonnes at an average utilization rate of 71%. Through the European Commission and the initiative known as RePowerEU, the continent has set ambitious targets for deploying 40 gigawatts of renewable hydrogen electrolysers before 2030, allowing 10 million tonnes of renewable hydrogen to be produced annually. Accordingly, refineries and ammonia manufacturing constitute 82% of the total hydrogen demand: 57% and 25%, respectively, indicating that they play an important role in both the overall context of Europe's hydrogen economy.
Clean hydrogen capacity remains limited at 0.4% of total production, but more than a doubling of electrolytic hydrogen infrastructure in two years reflects growing transition momentum. Some 141 gigawatts of planned capacity through 2030 are in Europe's hydrogen pipeline, signaling large-scale industrial transformation despite project delays. The industrial gas suppliers form a critical backbone for this expansion, with underground hydrogen distribution networks and liquefaction facilities, which are key to hydrogen production, purification, and storage. This adoption toward renewable hydrogen is expected to sustain long-term industrial gas demand.
Europe Industrial Gases Market Challenge
Prolonged Demand Weakness and Overcapacity in European Chemical Production
The European chemical industry is still confronted by weak domestic demand and structural overcapacity, thus constraining industrial gas consumption. According to data from Eurostat, quoted by Cefic, in Q3 2025, the EU27 chemical sector utilization was standing at 74.6%, well behind the long-term average of 81.3% and nearly 10% below pre-crisis levels. Production was down 2.4% in early 2025 compared with 2024, against a rise in global output of 4.2%, underlining Europe's declining competitiveness. At the same time, elevated energy prices continue to be an issue; natural gas is about three times more expensive than in the United States, perpetuating the headwinds blowing through ammonia, methanol, and petrochemical producers.
More than 11 million tonnes of chemical capacity closures in 2023-2024 and about 15,000 job losses linked to such closures show structural decline across key production segments. Downstream demand from automotive, construction, and manufacturing remains weak, repressing consumption further and reducing industrial gas requirements. While chemical production remains 9.5-10% below pre-crisis levels, policy intervention and investment in next-generation production remain critical to restoring competitiveness and stabilizing industrial gas consumption through Europe's manufacturing base.
Unlock Market Intelligence
Explore the market potential with our data-driven report
Europe Industrial Gases Market Trend
Acceleration of Clean Hydrogen Infrastructure and Regulatory Integration
Europe's industrial ecosystem is rapidly shifting toward clean hydrogen, with 268 announced projects that will meet 7.1 million tonnes of annual demand by 2030. According to Hydrogen Europe's Clean Hydrogen Monitor 2023, ammonia and steel manufacture will each require around 2 million tonnes annually, underlining the pivotal position of these industries in decarbonization. Around 84% of clean hydrogen will be produced from electrolysis, while 16% will result from natural gas reforming coupled with CCS, as a balance between energy and cost. Germany, the Netherlands, Poland, France, and Italy collectively account for 57% of the production capacity, further solidifying regional infrastructure leadership.
Electrolyser manufacturing is scaling rapidly, with an additional 1.2 gigawatts of capacity expected by end-2025 to meet surging deployment targets. The European Commission's Delegated Acts on renewable fuels of non-biological origin require that 42% of industrial hydrogen come from such sources by 2030 and 60% by 2035. These policies are reworking gas purity standards and supply needs, putting industrial gas companies center stage in the European clean hydrogen transition between 2026 and 2032.
Europe Industrial Gases Market Opportunity
Expansion Opportunities in Chemical Manufacturing and Refining Activities
Besides the short-term headwinds, chemical production and refining offer strategic growth opportunities that underpin structural demand for industrial gases. In 2024, the value of EU27 chemical production reached €830 billion from €790 billion in 2023, with resilience in higher-value segments. Exports, meanwhile, were up 7% from the prior year to €560 billion in 2024, with Germany at €134 billion or 24% of the total, underlining the country's position in premium chemical manufacturing. Specialty and fine chemicals, in addition to pharmaceuticals, continue to be the main growth drivers, supported by the 12.7% increase in the value of pharmaceutical production to €263 billion in 2024.
The chemical sector in Germany alone generates revenue of €218 billion while providing jobs for 1.2 million people, sustaining a wide range of industrial gas consumption across its production facilities. Moreover, the development of semiconductor manufacturing plants, especially within Germany, increases gas demand further because of the rigorous purity requirements that occur across microchip processes. Industrial gas suppliers for pharmaceuticals, semiconductors, and special chemicals enjoy premium pricing, solid contracts, and strategic relevance through 2032.
Europe Industrial Gases Market Country Analysis
Germany is the largest industrial gas market in Europe, accounting for roughly 30% of the total market, with its infrastructure supporting robust hydrogen production. In 2023, capacity for hydrogen production in Germany was close to 1.98 million tonnes per year (the highest in Europe) fuelling a sizable portion of the total continent consumption. The industrial base in Germany, which centers primarily on chemicals, refining, and new hydrogen production, continues to generate significant demand for industrial gas. The estimated revenue of the German chemical industry in 2023 was approximately €218 billion (more than any other country in the EU-28) or roughly one-third of the EU-28 total, indicating its regional importance.
German chemicals industry exports are anticipated to reach around €134 billion for 2024 (approximately one-quarter of EU exports for this sector). Germany has a diversified industrial sector, from pharmaceuticals to semiconductors to metallurgy, and all are substantial, consistent gas consuming industries in a variety of production and process operations. Germany, with its high-tech chemical parks, and hydrogen distribution networks represents a platform for industrial gas suppliers to maintain their business relationships and generation of capacity during the forecast period 2026-2032.
Unlock Market Intelligence
Explore the market potential with our data-driven report
Europe Industrial Gases Market Segmentation Analysis

By Application
- Combustion and Process Oxygen
- Welding and Metal Fabrication
- Inerting Blanketing and Heat Treating
- Cryogenics and liquefaction
- Chemical Synthesis and Hydrogenation
- Purging and Purifications
- Analytical and Calibration
Chemical synthesis and hydrogenation applications has largest share of about 25% of Europe's total industrial gases demand, making this the largest application segment. Refinery and ammonia production together account for 82% of total hydrogen consumption, requiring 4.55 million and 2.00 million tonnes respectively in 2023. Eurostat data shows that sold production value of chemicals increased 1.5% in 2024 to €462 billion, indicating sustained reliance on industrial gases in synthesis and conversion processes. These applications remain indispensable for key feedstock transformations in benzene, ethylene, and chlorine production, providing a steady base for industrial gas usage.
Chemical synthesis demand is resilient due to the integral role of the industry in producing essential materials for automotive, pharmaceutical, and construction industries worldwide. Leadership in the manufacture of fine and specialty chemicals in Germany further produces a continuous stream of high-purity gas requirements at value premiums. Due to long-standing infrastructure and technical service partnerships, customer relationships remain durable in the industrial gas suppliers segment, contributing to consistent revenue growth throughout the 2026-2032 forecast horizon.
By End User Industry
- Oil and Gas
- Petrochemicals and Chemicals
- Power and Energy
- Mining
- Steelmaking
- Metals
- Healthcare
- Food and Beverages
- Fertilizers
- Others
The petrochemicals and chemicals industry represents the largest end-user segment, accounting for around 30% of Europe's industrial gases market. Grouped together, refining and chemical synthesis require about 6.55 million tonnes of hydrogen every year, 57% of the region's hydrogen demand. Germany has the largest share in EU-28 chemical industry revenues with 33% (€218 billion), followed by France (€92 billion), Italy (€65 billion), the Netherlands (€60 billion), and Belgium (€54 billion). This segment comprises the core user of industrial gases because it relies heavily on high-volume feedstock and process gases for refining, synthesis, and advanced manufacturing processes.
Close interdependencies between industrial gas suppliers and petrochemical producers foster long-term contractual relationships and investments in infrastructure. With EU27 chemical exports reaching €560 billion in 2024-a 7% increase year over year-the export-oriented nature of Europe's chemical industry ensures sustained gas demand. Despite temporary capacity pressures, the essential nature of the sector and its technological evolution underpin ongoing industrial gas consumption in pharmaceuticals, specialty chemicals, and advanced manufacturing through 2032.
Top Companies in Europe Industrial Gases Market
The top companies operating in the market include Taiyo Nippon Sanso, Nippon Sanso Holdings Corporation, Iwatani Corporation, Linde plc, Air Liquide S.A., Air Products and Chemicals, Inc., Taiyo Nippon Sanso Corporation, Messer Group SE & Co. KGaA, Air Water Inc., SOL Group, Yingde Gases Group, etc., are the top players operating in the Europe Industrial Gases Market.
Frequently Asked Questions
Related Report
1. Market Segmentation
1.1. Research Scope
1.2. Research Methodology
1.3. Definitions and Assumptions
2. Executive Summary
3. Europe Industrial Gases Market Policies, Regulations, and Standards
4. Europe Industrial Gases Market Dynamics
4.1. Growth Factors
4.2. Challenges
4.3. Trends
4.4. Opportunities
5. Europe Industrial Gases Market Statistics, 2022-2032F
5.1. Market Size & Growth Outlook
5.1.1.By Revenues in USD Million
5.1.2.By Quantity Sold in Tons
5.2. Market Segmentation & Growth Outlook
5.2.1.By Gas
5.2.1.1. Nitrogen Gas- Market Insights and Forecast 2022-2032, USD Million & Quantity in Tons
5.2.1.2. Oxygen Gas- Market Insights and Forecast 2022-2032, USD Million & Quantity in Tons
5.2.1.3. Carbon dioxide Gas- Market Insights and Forecast 2022-2032, USD Million & Quantity in Tons
5.2.1.4. Argon Gas- Market Insights and Forecast 2022-2032, USD Million & Quantity in Tons
5.2.1.5. Hydrogen Gas- Market Insights and Forecast 2022-2032, USD Million & Quantity in Tons
5.2.1.6. Helium Gas- Market Insights and Forecast 2022-2032, USD Million & Quantity in Tons
5.2.1.7. Acetylene Gas- Market Insights and Forecast 2022-2032, USD Million & Quantity in Tons
5.2.1.8. Others- Market Insights and Forecast 2022-2032, USD Million & Quantity in Tons
5.2.2.By Application
5.2.2.1. Combustion and Process Oxygen- Market Insights and Forecast 2022-2032, USD Million & Quantity in Tons
5.2.2.2. Welding and Metal Fabrication- Market Insights and Forecast 2022-2032, USD Million & Quantity in Tons
5.2.2.3. Inerting Blanketing and Heat Treating- Market Insights and Forecast 2022-2032, USD Million & Quantity in Tons
5.2.2.4. Cryogenics and liquefaction- Market Insights and Forecast 2022-2032, USD Million & Quantity in Tons
5.2.2.5. Chemical Synthesis and Hydrogenation- Market Insights and Forecast 2022-2032, USD Million & Quantity in Tons
5.2.2.6. Purging and Purifications- Market Insights and Forecast 2022-2032, USD Million & Quantity in Tons
5.2.2.7. Analytical and Calibration- Market Insights and Forecast 2022-2032, USD Million & Quantity in Tons
5.2.3.By Supply Mode
5.2.3.1. Packaged Gas Supply (Merchant Sales)- Market Insights and Forecast 2022-2032, USD Million & Quantity in Tons
5.2.3.2. Bulk or Liquid Gas Supply- Market Insights and Forecast 2022-2032, USD Million & Quantity in Tons
5.2.3.3. Onsite Generation or Pipeline Supply- Market Insights and Forecast 2022-2032, USD Million & Quantity in Tons
5.2.3.4. Gas-as-a-Service Model- Market Insights and Forecast 2022-2032, USD Million & Quantity in Tons
5.2.4.By End User Industry
5.2.4.1. Oil and Gas- Market Insights and Forecast 2022-2032, USD Million & Quantity in Tons
5.2.4.2. Petrochemicals and Chemicals- Market Insights and Forecast 2022-2032, USD Million & Quantity in Tons
5.2.4.3. Power and Energy- Market Insights and Forecast 2022-2032, USD Million & Quantity in Tons
5.2.4.4. Mining, Steelmaking, Metals- Market Insights and Forecast 2022-2032, USD Million & Quantity in Tons
5.2.4.5. Healthcare- Market Insights and Forecast 2022-2032, USD Million & Quantity in Tons
5.2.4.6. Food and Beverages- Market Insights and Forecast 2022-2032, USD Million & Quantity in Tons
5.2.4.7. Fertilizers- Market Insights and Forecast 2022-2032, USD Million & Quantity in Tons
5.2.4.8. Others- Market Insights and Forecast 2022-2032, USD Million & Quantity in Tons
5.2.5.By Country
5.2.5.1. Germany
5.2.5.2. UK
5.2.5.3. France
5.2.5.4. Italy
5.2.5.5. Belgium
5.2.5.6. Spain
5.2.5.7. Sweden
5.2.5.8. Netherlands
5.2.5.9. Rest of Europe
5.2.6.By Competitors
5.2.6.1. Competition Characteristics
5.2.6.2. Market Share & Analysis
6. Germany Industrial Gases Market Statistics, 2022-2032F
6.1. Market Size & Growth Outlook
6.1.1.By Revenues in USD Million
6.1.2.By Quantity Sold in Tons
6.2. Market Segmentation & Growth Outlook
6.2.1.By Gas- Market Insights and Forecast 2022-2032, USD Million & Quantity in Tons
6.2.2.By Application- Market Insights and Forecast 2022-2032, USD Million & Quantity in Tons
6.2.3.By Supply Mode- Market Insights and Forecast 2022-2032, USD Million & Quantity in Tons
6.2.4.By End User Industry- Market Insights and Forecast 2022-2032, USD Million & Quantity in Tons
7. UK Industrial Gases Market Statistics, 2022-2032F
7.1. Market Size & Growth Outlook
7.1.1.By Revenues in USD Million
7.1.2.By Quantity Sold in Tons
7.2. Market Segmentation & Growth Outlook
7.2.1.By Gas- Market Insights and Forecast 2022-2032, USD Million & Quantity in Tons
7.2.2.By Application- Market Insights and Forecast 2022-2032, USD Million & Quantity in Tons
7.2.3.By Supply Mode- Market Insights and Forecast 2022-2032, USD Million & Quantity in Tons
7.2.4.By End User Industry- Market Insights and Forecast 2022-2032, USD Million & Quantity in Tons
8. France Industrial Gases Market Statistics, 2022-2032F
8.1. Market Size & Growth Outlook
8.1.1.By Revenues in USD Million
8.1.2.By Quantity Sold in Tons
8.2. Market Segmentation & Growth Outlook
8.2.1.By Gas- Market Insights and Forecast 2022-2032, USD Million & Quantity in Tons
8.2.2.By Application- Market Insights and Forecast 2022-2032, USD Million & Quantity in Tons
8.2.3.By Supply Mode- Market Insights and Forecast 2022-2032, USD Million & Quantity in Tons
8.2.4.By End User Industry- Market Insights and Forecast 2022-2032, USD Million & Quantity in Tons
9. Italy Industrial Gases Market Statistics, 2022-2032F
9.1. Market Size & Growth Outlook
9.1.1.By Revenues in USD Million
9.1.2.By Quantity Sold in Tons
9.2. Market Segmentation & Growth Outlook
9.2.1.By Gas- Market Insights and Forecast 2022-2032, USD Million & Quantity in Tons
9.2.2.By Application- Market Insights and Forecast 2022-2032, USD Million & Quantity in Tons
9.2.3.By Supply Mode- Market Insights and Forecast 2022-2032, USD Million & Quantity in Tons
9.2.4.By End User Industry- Market Insights and Forecast 2022-2032, USD Million & Quantity in Tons
10. Belgium Industrial Gases Market Statistics, 2022-2032F
10.1. Market Size & Growth Outlook
10.1.1. By Revenues in USD Million
10.1.2. By Quantity Sold in Tons
10.2. Market Segmentation & Growth Outlook
10.2.1. By Gas- Market Insights and Forecast 2022-2032, USD Million & Quantity in Tons
10.2.2. By Application- Market Insights and Forecast 2022-2032, USD Million & Quantity in Tons
10.2.3. By Supply Mode- Market Insights and Forecast 2022-2032, USD Million & Quantity in Tons
10.2.4. By End User Industry- Market Insights and Forecast 2022-2032, USD Million & Quantity in Tons
11. Spain Industrial Gases Market Statistics, 2022-2032F
11.1. Market Size & Growth Outlook
11.1.1. By Revenues in USD Million
11.1.2. By Quantity Sold in Tons
11.2. Market Segmentation & Growth Outlook
11.2.1. By Gas- Market Insights and Forecast 2022-2032, USD Million & Quantity in Tons
11.2.2. By Application- Market Insights and Forecast 2022-2032, USD Million & Quantity in Tons
11.2.3. By Supply Mode- Market Insights and Forecast 2022-2032, USD Million & Quantity in Tons
11.2.4. By End User Industry- Market Insights and Forecast 2022-2032, USD Million & Quantity in Tons
12. Sweden Industrial Gases Market Statistics, 2022-2032F
12.1. Market Size & Growth Outlook
12.1.1. By Revenues in USD Million
12.1.2. By Quantity Sold in Tons
12.2. Market Segmentation & Growth Outlook
12.2.1. By Gas- Market Insights and Forecast 2022-2032, USD Million & Quantity in Tons
12.2.2. By Application- Market Insights and Forecast 2022-2032, USD Million & Quantity in Tons
12.2.3. By Supply Mode- Market Insights and Forecast 2022-2032, USD Million & Quantity in Tons
12.2.4. By End User Industry- Market Insights and Forecast 2022-2032, USD Million & Quantity in Tons
13. Netherlands Industrial Gases Market Statistics, 2022-2032F
13.1. Market Size & Growth Outlook
13.1.1. By Revenues in USD Million
13.1.2. By Quantity Sold in Tons
13.2. Market Segmentation & Growth Outlook
13.2.1. By Gas- Market Insights and Forecast 2022-2032, USD Million & Quantity in Tons
13.2.2. By Application- Market Insights and Forecast 2022-2032, USD Million & Quantity in Tons
13.2.3. By Supply Mode- Market Insights and Forecast 2022-2032, USD Million & Quantity in Tons
13.2.4. By End User Industry- Market Insights and Forecast 2022-2032, USD Million & Quantity in Tons
14. Competitive Outlook
14.1. Company Profiles
14.1.1. Linde plc
14.1.1.1. Business Description
14.1.1.2. Product Portfolio
14.1.1.3. Collaborations & Alliances
14.1.1.4. Recent Developments
14.1.1.5. Financial Details
14.1.1.6. Others
14.1.2. Air Liquide S.A.
14.1.2.1. Business Description
14.1.2.2. Product Portfolio
14.1.2.3. Collaborations & Alliances
14.1.2.4. Recent Developments
14.1.2.5. Financial Details
14.1.2.6. Others
14.1.3. Air Products and Chemicals, Inc.
14.1.3.1. Business Description
14.1.3.2. Product Portfolio
14.1.3.3. Collaborations & Alliances
14.1.3.4. Recent Developments
14.1.3.5. Financial Details
14.1.3.6. Others
14.1.4. Taiyo Nippon Sanso Corporation
14.1.4.1. Business Description
14.1.4.2. Product Portfolio
14.1.4.3. Collaborations & Alliances
14.1.4.4. Recent Developments
14.1.4.5. Financial Details
14.1.4.6. Others
14.1.5. Messer Group SE & Co. KGaA
14.1.5.1. Business Description
14.1.5.2. Product Portfolio
14.1.5.3. Collaborations & Alliances
14.1.5.4. Recent Developments
14.1.5.5. Financial Details
14.1.5.6. Others
14.1.6. SOL Group
14.1.6.1. Business Description
14.1.6.2. Product Portfolio
14.1.6.3. Collaborations & Alliances
14.1.6.4. Recent Developments
14.1.6.5. Financial Details
14.1.6.6. Others
14.1.7. Nippon Sanso Holdings Corporation
14.1.7.1. Business Description
14.1.7.2. Product Portfolio
14.1.7.3. Collaborations & Alliances
14.1.7.4. Recent Developments
14.1.7.5. Financial Details
14.1.7.6. Others
14.1.8. Iwatani Corporation
14.1.8.1. Business Description
14.1.8.2. Product Portfolio
14.1.8.3. Collaborations & Alliances
14.1.8.4. Recent Developments
14.1.8.5. Financial Details
14.1.8.6. Others
14.1.9. Air Water Inc.
14.1.9.1. Business Description
14.1.9.2. Product Portfolio
14.1.9.3. Collaborations & Alliances
14.1.9.4. Recent Developments
14.1.9.5. Financial Details
14.1.9.6. Others
14.1.10. SOL Group
14.1.10.1.Business Description
14.1.10.2.Product Portfolio
14.1.10.3.Collaborations & Alliances
14.1.10.4.Recent Developments
14.1.10.5.Financial Details
14.1.10.6.Others
15. Disclaimer
| Segment | Sub-Segment |
|---|---|
| By Gas |
|
| By Application |
|
| By Supply Mode |
|
| By End User Industry |
|
| By Country |
|
Research Methodology
This study followed a structured approach comprising four key phases to assess the size and scope of the electro-oxidation market. The process began with thorough secondary research to collect data on the target market, related markets, and broader industry context. These findings, along with preliminary assumptions and estimates, were then validated through extensive primary research involving industry experts from across the value chain. To calculate the overall market size, both top-down and bottom-up methodologies were employed. Finally, market segmentation and data triangulation techniques were applied to refine and validate segment-level estimations.
Secondary Research
The secondary research phase involved gathering data from a wide range of credible and published sources. This step helped in identifying industry trends, defining market segmentation, and understanding the market landscape and value chain.
Sources consulted during this phase included:
- Company annual reports, investor presentations, and press releases
- Industry white papers and certified publications
- Trade directories and market-recognized databases
- Articles from authoritative authors and reputable journals
- Gold and silver standard websites
Secondary research was critical in mapping out the industry's value chain and monetary flow, identifying key market segments, understanding regional variations, and tracking significant industry developments.
Other key sources:
- Financial disclosures
- Industry associations and trade bodies
- News outlets and business magazines
- Academic journals and research studies
- Paid industry databases
Primary Research
To validate secondary data and gain deeper market insights, primary research was conducted with key stakeholders across both the supply and demand sides of the market.
On the demand side, participants included decision-makers and influencers from end-user industries—such as CIOs, CTOs, and CSOs—who provided first-hand perspectives on market needs, product usage, and future expectations.
On the supply side, interviews were conducted with manufacturers, industry associations, and institutional participants to gather insights into current offerings, product pipelines, and market challenges.
Primary interviews provided critical inputs such as:
- Market size and revenue data
- Product and service breakdowns
- Market forecasts
- Regional and application-specific trends
Stakeholders consulted included:
- Leading OEM and solution providers
- Channel and distribution partners
- End users across various applications
- Independent consultants and industry specialists
Market Size Estimation and Data Triangulation
- Identifying Key Market Participants (Secondary Research)
- Goal: To identify the major players or companies in the target market. This typically involves using publicly available data sources such as industry reports, market research publications, and financial statements of companies.
- Tools: Reports from firms like Gartner, Forrester, Euromonitor, Statista, IBISWorld, and others. Public financial statements, news articles, and press releases from top market players.
- Extracting Earnings of Key Market Participants
- Goal: To estimate the earnings generated from the product or service being analyzed. This step helps in understanding the revenue potential of each market player in a specific geography.
- Methods: Earnings data can be gathered from:
- Publicly available financial reports (for listed companies).
- Interviews and primary data sources from professionals, such as Directors, VPs, SVPs, etc. This is especially useful for understanding more nuanced, internal data that isn't publicly disclosed.
- Annual reports and investor presentations of key players.
- Data Collation and Development of a Relevant Data Model
- Goal: To collate inputs from both primary and secondary sources into a structured, data-driven model for market estimation. This model will incorporate key market KPIs and any independent variables relevant to the market.
- Key KPIs: These could include:
- Market size, growth rate, and demand drivers.
- Industry-specific metrics like market share, average revenue per customer (ARPC), or average deal size.
- External variables, such as economic growth rates, inflation rates, or commodity prices, that could affect the market.
- Data Modeling: Based on this data, the market forecasts are developed for the next 5 years. A combination of trend analysis, scenario modeling, and statistical regression might be used to generate projections.
- Scenario Analysis
- Goal: To test different assumptions and validate how sensitive the market is to changes in key variables (e.g., market demand, regulatory changes, technological disruptions).
- Types of Scenarios:
- Base Case: Based on current assumptions and historical data.
- Best-Case Scenario: Assuming favorable market conditions, regulatory environments, and technological advancements.
- Worst-Case Scenario: Accounting for adverse factors, such as economic downturns, stricter regulations, or unexpected disruptions.


