Europe Armored Vehicles Market Report: Trends, Growth and Forecast (2026-2032)
By Platform (Combat Vehicles, Combat Support Vehicles, Unmanned or Robotic Armored Ground Vehicles), By System (Engines, Fire Control Systems, Armor & Protection Systems, Countermeasure Systems, Command & Control Systems), By Type (Conventional, Electric/Hybrid), By Mode of Operation (Manned, Unmanned), By Mobility (Wheeled (4x4), Tracked), By Sales Channel (OEM, Retrofit), By Country (Germany, The UK, France, Spain, Italy, Benelux, Scandinavia, Poland, Rest of Europe) ... Read more
|
Major Players
|
Europe Armored Vehicles Market Statistics and Insights, 2026
- Market Size Statistics
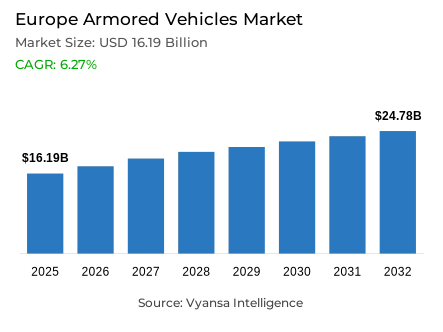
- Europe armored vehicles market is estimated at USD 16.19 billion in 2025.
- The market size is expected to grow to USD 24.78 billion by 2032.
- Market to register a cagr of around 6.27% during 2026-32.
- Platform Shares
- Combat vehicles grabbed market share of 70%.
- Competition
- More than 15 companies are actively engaged in producing armored vehicles in Europe.
- Top 5 companies acquired around 50% of the market share.
- Arquus; Patria Group; Thales; Rheinmetall AG; KNDS (Krauss-Maffei Wegmann + Nexter) etc., are few of the top companies.
- Mode of Operation
- Manned grabbed 95% of the market.
- Country
- France leads with a 20% share of the Europe market.
Europe Armored Vehicles Market Outlook
Europe armored vehicles market will reach approximately USD 24.78 billion by 2032, up from an estimated USD 16.19 billion in 2025, at a CAGR of nearly 6.27% during 2026-2032. Increasing geopolitical tension, modernization imperatives, and coordinated EU defense policies drive market growth. The ongoing conflict in Ukraine and emerging hybrid warfare threats have accelerated procurement programs across nations, stirring them toward benchmarking fleet survivability, mobility, and digital integration. This leads to serious modernization momentum in the region, as evinced by major initiatives like the German USD 12 billion Zeitenwende fund, France's USD 9 billion SCORPION program, and Poland's USD 5 billion investment in K2 MBTs and Borsuk IFVs.
Combat vehicles comprise up to 70% of overall deployments, underlining their leading role in Europe's defense posture. Main Battle Tanks and IFVs are the priorities for deterrence and interoperability as doctrinally required by NATO, while APCs/MRAPs provide troop mobility in a variety of terrain and geological environments. These vehicles are being upgraded with modular designs, digital C4ISR networks, and active protection systems to improve battlefield performance and maintain long-term operational relevance.
Manned armored platforms dominate 95%, reflecting continued dependence on human oversight for tactical decision-making and coordination. However, unmanned and robotic systems are also emerging, enabled by AI and autonomous navigation technologies in support of manned operations for reconnaissance and high-risk missions. This thus provides flexibility in a gradual integration of automation in future combat operations. Regional Market Dynamics France has the leading regional market share with around 20%, due in large part to its SCORPION program, which is heavily oriented toward digitally networked MBTs and IFVs.
This is followed by substantial investments by Germany under the Zeitenwende and by Poland's K2 modernization plans. EU programs such as the EDF and EDIRPA will further promote pan-national cooperation, joint procurement of military technology, and harmonized platform developments across their member states for improving Europe's overall armored capabilities.

Europe Armored Vehicles Market Growth Driver
Strategic Modernization Mandates Reinforcing Defense Preparedness
The rapidly upgrading armored vehicle fleets in Europe are meant for strengthening deterrence and achieving interoperability goals within the NATO and EU frameworks. Mounting geopolitical pressures from Russia and North Africa, along with evolving dynamics in hybrid warfare, have increased the mandates for modernization. The EDF and EDIRPA ensure financial and strategic coordination of these programs, hence promoting collaboration and efficiency. Germany's USD 12 billion Zeitenwende fund, France's USD 9 billion SCORPION initiative, and Poland's USD 5 billion investment in K2 MBTs and Borsuk IFVs thus put into perspective the regional collective modernization effort.
Besides adding new defense capability, governments are placing a higher emphasis on local production to build greater industrial resilience and independence. Across the board, OEMs such as Rheinmetall, KNDS, Thales, and Hanwha are increasing production, adding active protection systems, and/or adding digital command systems. Lessons learned from the conflict in Ukraine again underscore the need for adaptability, protection, and networked warfare—principles now clearly embedded within Europe’s armored modernization framework.
Europe Armored Vehicles Market Challenge
Industrial and Supply Chain Constraints Hindering Production Efficiency
European manufacturers are struggling with industrial bottlenecks and disrupted supply chains as demand for armored vehicles accelerates. Key OEMs include Rheinmetall, KNDS, BAE Systems, and Arquus, which are all facing capacity limitations in armor materials, engines, and electronic systems. Increased demand, coupled with a limited supply of high-grade steel, composites, and specialized components, has resulted in several production delays and higher costs. The main operational challenge for producers is maintaining quality while ramping up production rapidly.
Added to these are the regulatory and fiscal complications. Large programs such as Germany's Zeitenwende fund and France's SCORPION program depend on parliamentary approval, while EU standards for certification further prolong project implementation. Labor shortages in advanced manufacturing, combined with parallel upgrade programs in several countries, create logistical and scheduling challenges. Together, these factors limit industrial throughput, which continues to hamper efficient modernization despite strong budgetary commitments.
Unlock Market Intelligence
Explore the market potential with our data-driven report
Europe Armored Vehicles Market Trend
Integration of Digital Systems and Active Protection Technologies
The extensive introduction of active protection systems and digital networks is a signature technological feature in most armored vehicle programs in Europe. OEMs like Rheinmetall, Thales, and KNDS are embedding APS, C4ISR frameworks, and advanced sensors to enhance situational awareness and survivability. The increasing proliferation of loitering munitions and precision-guided threats has reinforced the need for agile protection and intelligent command systems.
Digital connectivity allows for seamless coordination between vehicles, command posts, and unmanned assets, promoting faster decision-making and enhanced operational visibility. Modular architectures support retrofit opportunities that extend the lifecycle of legacy fleets by upgrading systems. As NATO places great emphasis on interoperability, these advancements ensure that European land forces remain strategically integrated, technologically advanced, and prepared for multidomain combat scenarios.
Europe Armored Vehicles Market Opportunity
Collaborative Defense Programs Unlocking Cross-Border Synergies
Cross-border collaboration under EU frameworks provides a major avenue for industrial and operational advancement. EDF and EDIRPA-backed programs already support joint R&D, procurement, and platform standardization between member states. Other examples include KNDS's Franco-German MBT initiative and Thales' alliance with Hanwha in C4ISR development, marking a trend toward shared capability building and cost optimization.
With an estimated total defense spending of USD 2 trillion allocated for 2025-2032, European collaboration guarantees predictable funding and accelerated technological development. The emergence of unmanned and robotic armored systems, growing above 12% CAGR, also creates additional pathways toward AI-based automation and adaptive mobility solutions. Eastern European states like Poland become early adopters, demonstrating successful integration of cross-border defense programs that improve regional competitiveness and interoperability.
Europe Armored Vehicles Market Country Analysis
By Country
- Germany
- The UK
- France
- Spain
- Italy
- Benelux
- Scandinavia
- Poland
- Rest of Europe
France remains the leading market with around 20% share, primarily due to the extensive SCORPION program emphasizing digital transformation of armored fleets. The program ensures integration from MBTs and IFVs to reconnaissance under a single C4ISR framework for the purpose of real-time data and battlefield coordination. It will enhance fleet readiness besides reinforcing the leadership of France vis-à-vis collaborative EU defense projects amidst broader modernization standards at NATO.
With 14% market share, Germany closely follows, modernizing its Leopard MBTs and Puma IFVs via the USD 12 billion Zeitenwende fund. It focuses on active protection systems, digital command interfaces, and modular configurations. The Poland market is the fastest-growing, with over USD 5 billion investments in the fleet of K2 MBTs, Borsuk IFVs, and associated logistics platforms to strategically improve its defenses. The strong integration that Poland has with NATO and its industrial partnerships make the country a hub for Europe's evolving armored vehicle ecosystem.
Unlock Market Intelligence
Explore the market potential with our data-driven report
Europe Armored Vehicles Market Segmentation Analysis
By Platform
- Combat Vehicles
- Combat Support Vehicles
- Unmanned or Robotic Armored Ground Vehicles
Combat vehicles account share of around 70% of the overall deployments, reflecting their central role in Europe's strategic defense posture. MBTs and IFVs anchor high-intensity warfare capabilities, offering superior mobility, protection, and firepower; APCs and MRAPs enhance troop movement across challenging terrains. These platforms remain fundamental to NATO's land warfare doctrine and national security objectives.
Coupled with the EDF and EDIRPA frameworks, USD 2 trillion investments up to 2032 have strengthened combat vehicle modernization cycles. Modernization will ensure that MBT/IFVs continue to dominate Europe's armored fleet via the emphasis on modularity, standardization, and digital integration. Joint production programs further improve efficiency while moving along the goals of defense interoperability and sustaining relevance for long-term platforms.

By Mode of Operation
- Manned
- Unmanned
Manned vehicles retain the leading segment with around 95% share due to the continued importance of human oversight in both tactical and strategic missions. Forces across NATO especially rely on manned MBTs, IFVs, and APCs to rapidly deploy with adaptive decision-making and secure battlefield coordination. Such systems retain their indispensability for maintaining flexibility of operations and situational control in dynamic environments.
Unmanned and robotic systems are gaining traction, though, at over 12% CAGR growth rate. Leading OEMs like Rheinmetall, BAE Systems, and Arquus are rapidly integrating AI-based targeting, autonomous navigation, and remote-control technologies into hybrid fleets. Such innovation will complement manned operations and enable safer reconnaissance and expanded mission endurance, building a pathway toward future autonomous warfare capabilities.
Various Market Players in Europe Armored Vehicles Market
The companies mentioned below are highly active in the Europe armored vehicles market, occupying a considerable portion of the market and shaping industry progress.
- Arquus
- Patria Group
- Thales
- Rheinmetall AG
- KNDS (Krauss-Maffei Wegmann + Nexter)
- BAE Systems
- General Dynamics European Land Systems
- Iveco Defence Vehicles
- Oshkosh
- FNSS
- Hanwha
Frequently Asked Questions
Related Report
1. Market Segmentation
1.1. Research Scope
1.2. Research Methodology
1.3. Definitions and Assumptions
2. Executive Summary
3. How Geopolitical Events Are Shaping European Defense Spending?
3.1. NATO Norms
3.2. Russia Ukraine War
3.3. Growing Complexity of US-EU Relationships
3.4. Emergence of Global Powers Such as China, India, etc.,
3.5. Instability in Middle East Region
4. Europe Armored Vehicles Innovations & Capabilities
5. Europe Armored Vehicles Market Policies, Regulations, and Standards
6. Europe Armored Vehicles Market Dynamics
6.1. Growth Factors
6.2. Challenges
6.3. Trends
6.4. Opportunities
7. Europe Armored Vehicles Market Statistics, 2022-2032F
7.1. Market Size & Growth Outlook
7.1.1.By Revenues in USD Million
7.2. Market Segmentation & Growth Outlook
7.2.1.By Platform
7.2.1.1. Combat Vehicles- Market Insights and Forecast 2022-2032, USD Million
7.2.1.1.1. Main Battle Tanks (MBTs)- Market Insights and Forecast 2022-2032, USD Million
7.2.1.1.2. Infantry Fighting Vehicles (IFVs)- Market Insights and Forecast 2022-2032, USD Million
7.2.1.1.3. Armored Personnel Carriers (APCs)- Market Insights and Forecast 2022-2032, USD Million
7.2.1.1.4. Mine-Resistant Ambush Protected Vehicles (MRAPs)- Market Insights and Forecast 2022-2032, USD Million
7.2.1.2. Combat Support Vehicles- Market Insights and Forecast 2022-2032, USD Million
7.2.1.2.1. Armored Supply Vehicles- Market Insights and Forecast 2022-2032, USD Million
7.2.1.2.2. Command & Control Vehicles- Market Insights and Forecast 2022-2032, USD Million
7.2.1.2.3. Armored Recovery Vehicles- Market Insights and Forecast 2022-2032, USD Million
7.2.1.3. Unmanned or Robotic Armored Ground Vehicles- Market Insights and Forecast 2022-2032, USD Million
7.2.2.By System
7.2.2.1. Engines- Market Insights and Forecast 2022-2032, USD Million
7.2.2.2. Fire Control Systems- Market Insights and Forecast 2022-2032, USD Million
7.2.2.3. Armor & Protection Systems- Market Insights and Forecast 2022-2032, USD Million
7.2.2.4. Countermeasure Systems- Market Insights and Forecast 2022-2032, USD Million
7.2.2.5. Command & Control Systems- Market Insights and Forecast 2022-2032, USD Million
7.2.3.By Type
7.2.3.1. Conventional- Market Insights and Forecast 2022-2032, USD Million
7.2.3.2. Electric/Hybrid- Market Insights and Forecast 2022-2032, USD Million
7.2.4.By Mode of Operation
7.2.4.1. Manned- Market Insights and Forecast 2022-2032, USD Million
7.2.4.2. Unmanned- Market Insights and Forecast 2022-2032, USD Million
7.2.5.By Mobility
7.2.5.1. Wheeled (4x4)- Market Insights and Forecast 2022-2032, USD Million
7.2.5.2. Tracked- Market Insights and Forecast 2022-2032, USD Million
7.2.6.By Sales Channel
7.2.6.1. OEM- Market Insights and Forecast 2022-2032, USD Million
7.2.6.2. Retrofit- Market Insights and Forecast 2022-2032, USD Million
7.2.7.By Country
7.2.7.1. Germany
7.2.7.2. The UK
7.2.7.3. France
7.2.7.4. Spain
7.2.7.5. Italy
7.2.7.6. Benelux
7.2.7.7. Scandinavia
7.2.7.8. Poland
7.2.7.9. Rest of Europe
7.2.8.By Competitors
7.2.8.1. Competition Characteristics
7.2.8.2. Market Share & Analysis
8. Germany Armored Vehicles Market Statistics, 2022-2032F
8.1. Market Size & Growth Outlook
8.1.1.By Revenues in USD Million
8.2. Market Segmentation & Growth Outlook
8.2.1.By Platform- Market Insights and Forecast 2022-2032, USD Million
8.2.2.By System- Market Insights and Forecast 2022-2032, USD Million
8.2.3.By Type- Market Insights and Forecast 2022-2032, USD Million
8.2.4.By Mode of Operation- Market Insights and Forecast 2022-2032, USD Million
8.2.5.By Mobility- Market Insights and Forecast 2022-2032, USD Million
8.2.6.By Sales Channel- Market Insights and Forecast 2022-2032, USD Million
9. The UK Armored Vehicles Market Statistics, 2022-2032F
9.1. Market Size & Growth Outlook
9.1.1.By Revenues in USD Million
9.2. Market Segmentation & Growth Outlook
9.2.1.By Platform- Market Insights and Forecast 2022-2032, USD Million
9.2.2.By System- Market Insights and Forecast 2022-2032, USD Million
9.2.3.By Type- Market Insights and Forecast 2022-2032, USD Million
9.2.4.By Mode of Operation- Market Insights and Forecast 2022-2032, USD Million
9.2.5.By Mobility- Market Insights and Forecast 2022-2032, USD Million
9.2.6.By Sales Channel- Market Insights and Forecast 2022-2032, USD Million
10. France Armored Vehicles Market Statistics, 2022-2032F
10.1. Market Size & Growth Outlook
10.1.1. By Revenues in USD Million
10.2. Market Segmentation & Growth Outlook
10.2.1. By Platform- Market Insights and Forecast 2022-2032, USD Million
10.2.2. By System- Market Insights and Forecast 2022-2032, USD Million
10.2.3. By Type- Market Insights and Forecast 2022-2032, USD Million
10.2.4. By Mode of Operation- Market Insights and Forecast 2022-2032, USD Million
10.2.5. By Mobility- Market Insights and Forecast 2022-2032, USD Million
10.2.6. By Sales Channel- Market Insights and Forecast 2022-2032, USD Million
11. Spain Armored Vehicles Market Statistics, 2022-2032F
11.1. Market Size & Growth Outlook
11.1.1. By Revenues in USD Million
11.2. Market Segmentation & Growth Outlook
11.2.1. By Platform- Market Insights and Forecast 2022-2032, USD Million
11.2.2. By System- Market Insights and Forecast 2022-2032, USD Million
11.2.3. By Type- Market Insights and Forecast 2022-2032, USD Million
11.2.4. By Mode of Operation- Market Insights and Forecast 2022-2032, USD Million
11.2.5. By Mobility- Market Insights and Forecast 2022-2032, USD Million
11.2.6. By Sales Channel- Market Insights and Forecast 2022-2032, USD Million
12. Italy Armored Vehicles Market Statistics, 2022-2032F
12.1. Market Size & Growth Outlook
12.1.1. By Revenues in USD Million
12.2. Market Segmentation & Growth Outlook
12.2.1. By Platform- Market Insights and Forecast 2022-2032, USD Million
12.2.2. By System- Market Insights and Forecast 2022-2032, USD Million
12.2.3. By Type- Market Insights and Forecast 2022-2032, USD Million
12.2.4. By Mode of Operation- Market Insights and Forecast 2022-2032, USD Million
12.2.5. By Mobility- Market Insights and Forecast 2022-2032, USD Million
12.2.6. By Sales Channel- Market Insights and Forecast 2022-2032, USD Million
13. Benelux Armored Vehicles Market Statistics, 2022-2032F
13.1. Market Size & Growth Outlook
13.1.1. By Revenues in USD Million
13.2. Market Segmentation & Growth Outlook
13.2.1. By Platform- Market Insights and Forecast 2022-2032, USD Million
13.2.2. By System- Market Insights and Forecast 2022-2032, USD Million
13.2.3. By Type- Market Insights and Forecast 2022-2032, USD Million
13.2.4. By Mode of Operation- Market Insights and Forecast 2022-2032, USD Million
13.2.5. By Mobility- Market Insights and Forecast 2022-2032, USD Million
13.2.6. By Sales Channel- Market Insights and Forecast 2022-2032, USD Million
14. Scandinavia Armored Vehicles Market Statistics, 2022-2032F
14.1. Market Size & Growth Outlook
14.1.1. By Revenues in USD Million
14.2. Market Segmentation & Growth Outlook
14.2.1. By Platform- Market Insights and Forecast 2022-2032, USD Million
14.2.2. By System- Market Insights and Forecast 2022-2032, USD Million
14.2.3. By Type- Market Insights and Forecast 2022-2032, USD Million
14.2.4. By Mode of Operation- Market Insights and Forecast 2022-2032, USD Million
14.2.5. By Mobility- Market Insights and Forecast 2022-2032, USD Million
14.2.6. By Sales Channel- Market Insights and Forecast 2022-2032, USD Million
15. Poland Armored Vehicles Market Statistics, 2022-2032F
15.1. Market Size & Growth Outlook
15.1.1. By Revenues in USD Million
15.2. Market Segmentation & Growth Outlook
15.2.1. By Platform- Market Insights and Forecast 2022-2032, USD Million
15.2.2. By System- Market Insights and Forecast 2022-2032, USD Million
15.2.3. By Type- Market Insights and Forecast 2022-2032, USD Million
15.2.4. By Mode of Operation- Market Insights and Forecast 2022-2032, USD Million
15.2.5. By Mobility- Market Insights and Forecast 2022-2032, USD Million
15.2.6. By Sales Channel- Market Insights and Forecast 2022-2032, USD Million
16. Competitive Outlook
16.1. Company Profiles
16.1.1. Rheinmetall AG
16.1.1.1. Business Description
16.1.1.2. Product Portfolio
16.1.1.3. Collaborations & Alliances
16.1.1.4. Recent Developments
16.1.1.5. Financial Details
16.1.1.6. Others
16.1.2. KNDS (Krauss-Maffei Wegmann + Nexter)
16.1.2.1. Business Description
16.1.2.2. Product Portfolio
16.1.2.3. Collaborations & Alliances
16.1.2.4. Recent Developments
16.1.2.5. Financial Details
16.1.2.6. Others
16.1.3. BAE Systems
16.1.3.1. Business Description
16.1.3.2. Product Portfolio
16.1.3.3. Collaborations & Alliances
16.1.3.4. Recent Developments
16.1.3.5. Financial Details
16.1.3.6. Others
16.1.4. General Dynamics European Land Systems
16.1.4.1. Business Description
16.1.4.2. Product Portfolio
16.1.4.3. Collaborations & Alliances
16.1.4.4. Recent Developments
16.1.4.5. Financial Details
16.1.4.6. Others
16.1.5. Iveco Defence Vehicles
16.1.5.1. Business Description
16.1.5.2. Product Portfolio
16.1.5.3. Collaborations & Alliances
16.1.5.4. Recent Developments
16.1.5.5. Financial Details
16.1.5.6. Others
16.1.6. Arquus
16.1.6.1. Business Description
16.1.6.2. Product Portfolio
16.1.6.3. Collaborations & Alliances
16.1.6.4. Recent Developments
16.1.6.5. Financial Details
16.1.6.6. Others
16.1.7. Patria Group
16.1.7.1. Business Description
16.1.7.2. Product Portfolio
16.1.7.3. Collaborations & Alliances
16.1.7.4. Recent Developments
16.1.7.5. Financial Details
16.1.7.6. Others
16.1.8. Others
16.1.8.1. Business Description
16.1.8.2. Product Portfolio
16.1.8.3. Collaborations & Alliances
16.1.8.4. Recent Developments
16.1.8.5. Financial Details
16.1.8.6. Others
17. Disclaimer
| Segment | Sub-Segment |
|---|---|
| By Platform |
|
| By System |
|
| By Type |
|
| By Mode of Operation |
|
| By Mobility |
|
| By Sales Channel |
|
| By Country |
|
Research Methodology
This study followed a structured approach comprising four key phases to assess the size and scope of the electro-oxidation market. The process began with thorough secondary research to collect data on the target market, related markets, and broader industry context. These findings, along with preliminary assumptions and estimates, were then validated through extensive primary research involving industry experts from across the value chain. To calculate the overall market size, both top-down and bottom-up methodologies were employed. Finally, market segmentation and data triangulation techniques were applied to refine and validate segment-level estimations.
Secondary Research
The secondary research phase involved gathering data from a wide range of credible and published sources. This step helped in identifying industry trends, defining market segmentation, and understanding the market landscape and value chain.
Sources consulted during this phase included:
- Company annual reports, investor presentations, and press releases
- Industry white papers and certified publications
- Trade directories and market-recognized databases
- Articles from authoritative authors and reputable journals
- Gold and silver standard websites
Secondary research was critical in mapping out the industry's value chain and monetary flow, identifying key market segments, understanding regional variations, and tracking significant industry developments.
Other key sources:
- Financial disclosures
- Industry associations and trade bodies
- News outlets and business magazines
- Academic journals and research studies
- Paid industry databases
Primary Research
To validate secondary data and gain deeper market insights, primary research was conducted with key stakeholders across both the supply and demand sides of the market.
On the demand side, participants included decision-makers and influencers from end-user industries—such as CIOs, CTOs, and CSOs—who provided first-hand perspectives on market needs, product usage, and future expectations.
On the supply side, interviews were conducted with manufacturers, industry associations, and institutional participants to gather insights into current offerings, product pipelines, and market challenges.
Primary interviews provided critical inputs such as:
- Market size and revenue data
- Product and service breakdowns
- Market forecasts
- Regional and application-specific trends
Stakeholders consulted included:
- Leading OEM and solution providers
- Channel and distribution partners
- End users across various applications
- Independent consultants and industry specialists
Market Size Estimation and Data Triangulation
- Identifying Key Market Participants (Secondary Research)
- Goal: To identify the major players or companies in the target market. This typically involves using publicly available data sources such as industry reports, market research publications, and financial statements of companies.
- Tools: Reports from firms like Gartner, Forrester, Euromonitor, Statista, IBISWorld, and others. Public financial statements, news articles, and press releases from top market players.
- Extracting Earnings of Key Market Participants
- Goal: To estimate the earnings generated from the product or service being analyzed. This step helps in understanding the revenue potential of each market player in a specific geography.
- Methods: Earnings data can be gathered from:
- Publicly available financial reports (for listed companies).
- Interviews and primary data sources from professionals, such as Directors, VPs, SVPs, etc. This is especially useful for understanding more nuanced, internal data that isn't publicly disclosed.
- Annual reports and investor presentations of key players.
- Data Collation and Development of a Relevant Data Model
- Goal: To collate inputs from both primary and secondary sources into a structured, data-driven model for market estimation. This model will incorporate key market KPIs and any independent variables relevant to the market.
- Key KPIs: These could include:
- Market size, growth rate, and demand drivers.
- Industry-specific metrics like market share, average revenue per customer (ARPC), or average deal size.
- External variables, such as economic growth rates, inflation rates, or commodity prices, that could affect the market.
- Data Modeling: Based on this data, the market forecasts are developed for the next 5 years. A combination of trend analysis, scenario modeling, and statistical regression might be used to generate projections.
- Scenario Analysis
- Goal: To test different assumptions and validate how sensitive the market is to changes in key variables (e.g., market demand, regulatory changes, technological disruptions).
- Types of Scenarios:
- Base Case: Based on current assumptions and historical data.
- Best-Case Scenario: Assuming favorable market conditions, regulatory environments, and technological advancements.
- Worst-Case Scenario: Accounting for adverse factors, such as economic downturns, stricter regulations, or unexpected disruptions.


