Global Epoxy Prepreg Resins Market Report: Trends, Growth and Forecast (2026-2032)
By Product Type (Carbon Fiber Prepregs, Glass Fiber Prepregs), By Application (Aerospace, Automotive, Electronics, Construction, Sporting Goods), By Region (North America, Latin America, Europe, Middle East & Africa, Asia Pacific) ... Read more
|
Major Players
|
Global Epoxy Prepreg Resins Market Statistics and Insights, 2026
- Market Size Statistics
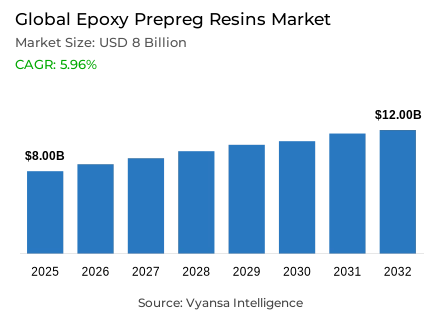
- Global epoxy prepreg resins market is estimated at USD 8 billion in 2025.
- The market size is expected to grow to USD 12 billion by 2032.
- Market to register a CAGR of around 5.96% during 2026-32.
- Product Type Shares
- Carbon fiber prepregs grabbed market share of 75%.
- Competition
- More than 30 companies are actively engaged in producing epoxy prepreg resins.
- Top 5 companies acquired around 50% of the market share.
- SGL Carbon SE; Solvay S.A.; Axiom Materials Inc.; Toray Industries; Teijin Limited etc., are few of the top companies.
- Application
- Aerospace grabbed 40% of the market.
- Region
- Asia Pacific leads with a 45% share of the global market.
Global Epoxy Prepreg Resins Market Outlook
The Global epoxy prepreg resins market is anticipated to grow at an approximately 5.96% CAGR from 2026-2032. As of 2025, the market size for Epoxy Prepreg Resins stood at USD 8 billion and will be valued at USD 12 billion in 2032. The aerospace industry remains at the forefront with considerable demands due to rising adoption rates for lighter composites, which help in improving fuel efficiency. Plane models, such as Boeing’s 787 Dreamliner, incorporate composites into almost half of their structure, thereby lowering fuel consumption rates. It decreases fuel consumption rates by as much as 20-25%.
Deliveries and presence within the aviation sector, as with Airbus, stabilize market demand within the industry. Carbon Fiber Epoxy Prepreg Resins possess remarkable strength and resilience against fatigue and corrosion, making them extremely suited for aircraft structure components. Carbon Fiber Prepregs lead with a market share contribution of about 75%, and this is because they have superior mechanical properties and a high strength-to-weight ratio. Not only are these materials preferred for use in aerospace but they are finding uses in relatively new market arenas like electric cars, which incorporate compositing for weight savings and thus an extension of range. Their adoption also gets facilitated because they have been OEM-integrated.
Aerospace accounts for approximately 40% of the market, reflecting the role it plays as a driving force and a stable source. Government regulation, with FAA and EASA approval, guarantees stable usage. Defense and aerospace expenditure, as well as developments in electric cars and alternative energy sources, offer complementary uses for epoxy prepreg. Region-wise, Asia Pacific currently holds 45% market share due to the presence of a large aerospace production industry in China, Japan, and South Korea, as well as swift adoption of EVs in China and India. Locally manufactured products assist with better supply chain optimization and reduce costs due to rising adoption among OEMs.
Epoxy prepreg resins will continue to expand with a focus on Asia Pacific due to better raw material availability, scale production advantages, and government support, thus making it a stronghold for market growth till 2032.

Global Epoxy Prepreg Resins Market Growth Driver
Rising Aerospace Production and Fuel Efficiency Imperatives
The aerospace industry remains an area with high demand for epoxy prepreg resins as aircraft manufacturers emphasize fuel efficiency and weight reduction with newer aircraft designs. A case in point would be the 787 Dreamliner aircraft from Boeing, whose airframe contains a structure that has about half materials based on compositing. This aircraft shows a fuel efficiency of 20-25% compared to similar aircraft. The 766 aircraft deliveries made by Airbus in 2024 and with an aircraft backlog of 8,658 demonstrate demand for aircraft with compositing designs.
The use of carbon fiber/epoxy prepregs in primary aircraft structures proves the superior strength, fatigue life, and corrosion resistance offered compared to conventional aluminum materials. These composites also offer reduced inspection and maintenance cycles and an extended service life with greater route flexibility. Continuous growth and modernization in aerospace production, and rising air travel worldwide, indicate demanding aerospace sector requirements, making it a prime growth driver for the Global epoxy prepreg resins market.
Global Epoxy Prepreg Resins Market Challenge
Environmental Impacts and Carbon Emissions from Carbon Fiber Production
Carbon Fiber production and usage affect the Global epoxy prepreg resins market as it requires highly energy demanding and greenhouse gas-intensive processes. For example, the carbonization process requires heating fibers at 1,500-3,000°C in an oxygen-free atmosphere to eliminate non-carbon components, thus requiring enormous electrical energy and making it a source of very high CO2 emissions. The life-cycle analysis shows that the production pollutes about 24.83 kg/CO2 equivalent per kg of production compared with 2-3kg for conventional steel. But with better technologies involving flame-resistant materials, there is a 20% decrease with a lower production value of about 19.29kg/kg. However, still higher compared with conventional light materials.
Higher energy requirements and costs limit its adoption for uses that are price-sensitive. Although carbon fiber composites can be used for reducing the weight of vehicles and aircraft, thus optimizing efficiency, it should be noted that these composites have some indirect impacts on emissions. There is a challenge on manufacturers to develop more environmentally friendly processes and focus on applying circular economy practices.
Unlock Market Intelligence
Explore the market potential with our data-driven report
Global Epoxy Prepreg Resins Market Trend
Accelerating Circular Economy Integration and Material Recycling
The adoption of circular economy concepts within composites production can be seen within innovations involving recycling and sustainable supply. For instance, methods involving carbon nanofibers created at Oak Ridge National Laboratory have shown a 50% increase in tensile strength and a doubling of toughness, indicating more definable and quantifiable performance enhancements for epoxy prepregs. U.S. Department of Energy projects also include specific efforts within clean energy and composites as well as end-of-life processing for wind and solar energy components as well as components within cars.
Governments and agencies, such as UNECE and OECD, also demonstrate support for transition toward a circular economy with guidelines on resource loop closure and efficiency. U.S. Carbon Fiber Technology Facility and similar businesses offer valuable case studies on low-cost and high-potential raw materials created from lignin, textiles, polymers, and hydrocarbons. It represents actions and efforts made easier and more affordable as sustainability projects improve standards on costs and performance criteria within the Global epoxy prepreg resins market.
Global Epoxy Prepreg Resins Market Opportunity
Growth Prospects from Increasing Electric Vehicle Adoption
Fast adoption rates for electric vehicles open major opportunities for epoxy prepregs in structural parts, batteries, and thermal management systems. Just as an example, about 14 million EVs were sold worldwide in 2023, which marked a 35% increase from the previous year and is set to break beyond 20 million sales in 2025. A 10% weight reduction achieved with composites will bring about an 6-8% increase in range, thereby emphasizing the benefits brought about by epoxy prepregs. About 250 million EVs will be sold by 2030, and with that, end-user demand for composites continues to intensify.
OEM Integration of Epoxy-based Composites for structural, thermal, and damping applications is yet another instance demonstrating market growth. Government support, lower costs associated with batteries, and developments within infrastructure have aided adoption at large geographies. The above-mentioned instances have thus depicted market advantage based on an emerging trend of Vehicle Electrification, aside from served Aerospace markets.
Global Epoxy Prepreg Resins Market Regional Analysis

By Region
- North America
- Latin America
- Europe
- Middle East & Africa
- Asia Pacific
Asia-Pacific leads the Global epoxy prepreg resins market with an approximate 45% share, providing examples of both production and consumption concentration. Strong aerospace manufacturing in China, Japan, and South Korea, coupled with rapidly growing electric vehicle adoption in China and India, illustrates regional demand trends. Manufacturers establish local production facilities to optimize supply chains, reduce logistics costs, and remain close to expanding OEM operations.
The competitive advantages include lower production costs, established access to carbon fiber and resin feedstocks, and proximity to major end-user markets. China’s dominance in electronics, renewable energy components, and electric vehicle production exemplifies downstream demand for epoxy prepregs across structural and thermal applications. Indian government initiatives promoting indigenous composite development further illustrate Asia-Pacific’s strategic market strength, reinforcing barriers for competitors and supporting sustained growth through 2032.
Unlock Market Intelligence
Explore the market potential with our data-driven report
Global Epoxy Prepreg Resins Market Segmentation Analysis
By Product Type
- Carbon Fiber Prepregs
- Glass Fiber Prepregs
Carbon fiber prepregs dominate the Global epoxy prepreg resins market, commanding approximately 75% of total share. Their high strength-to-weight ratio, superior fatigue resistance, and exceptional mechanical properties make them the preferred reinforcement material for primary aerospace structures and advanced vehicle components. For example, Boeing 787 and Airbus A350 fuselage sections, as well as structural components in electric vehicles, extensively use carbon fiber prepregs where durability under high operational loads is critical.
The ongoing expansion of production capacity provides further examples of the market response to increasing aerospace and automotive demand. The 70% market share illustrates a longstanding preference for carbon fiber in performance-critical applications and is expected to persist through 2026-2032, demonstrating continuity in both traditional and emerging end-use applications.

By Application
- Aerospace
- Automotive
- Electronics
- Construction
- Sporting Goods
Aerospace applications account for approximately 40% of the Global epoxy prepreg resins market, serving as a prime example of high-demand, mission-critical end-use sectors. Commercial aircraft manufacturers exemplify this by deploying carbon fiber epoxy prepregs in fuselage, wings, empennage, and flight control components where fatigue resistance and reliability are paramount. Regulatory requirements from the FAA and EASA further demonstrate instances of how stringent certifications reinforce material adoption in aerospace.
Defense and military aerospace provide additional examples of premium composite utilization, with investments in fighter aircraft, transport platforms, and space systems. Although applications in electric vehicles, industrial, and renewable energy sectors are expanding, aerospace remains the largest single sector, illustrating its role as both a technological driver and a stable source of demand. The sector’s 40% share is expected to remain consistent through 2032.
Market Players in Global Epoxy Prepreg Resins Market
These market players maintain a significant presence in the Global epoxy prepreg resins market sector and contribute to its ongoing evolution.
- SGL Carbon SE
- Solvay S.A.
- Axiom Materials Inc.
- Toray Industries
- Teijin Limited
- Hexcel Corporation
- Mitsubishi Chemical Corporation (Mitsubishi Chemical Carbon Fiber & Composites)
- Gurit Holding AG
- Park Aerospace Corporation
- Owens Corning
- Asahi Kasei Corp.
- SK Chemicals
- Huntsman / Araldite systems
- Arkema
- Plastic Reinforcement Fabrics Ltd.
Market News & Updates
- Toray Industries, 2025:
Announced 4000-series BMI resins providing high-temperature resistance up to 450°F (232°C) with improved curing properties and familiar handling characteristics for advanced aerospace primary structure applications.
- Hexcel Corporation, 2025:
Introduced HexPly® M91 toughened epoxy prepreg with superior performance for primary aircraft structures and engines, outperforming previous HexPly® M21 system while maintaining full compatibility.
Frequently Asked Questions
Related Report
1. Market Segmentation
1.1. Research Scope
1.2. Research Methodology
1.3. Definitions and Assumptions
2. Executive Summary
3. Global Epoxy Prepreg Resins Market Policies, Regulations, and Standards
4. Global Epoxy Prepreg Resins Market Dynamics
4.1. Growth Factors
4.2. Challenges
4.3. Trends
4.4. Opportunities
5. Global Epoxy Prepreg Resins Market Statistics, 2022-2032F
5.1. Market Size & Growth Outlook
5.1.1.By Revenues in USD Million
5.2. Market Segmentation & Growth Outlook
5.2.1.By Product Type
5.2.1.1. Carbon Fiber Prepregs- Market Insights and Forecast 2022-2032, USD Million
5.2.1.2. Glass Fiber Prepregs- Market Insights and Forecast 2022-2032, USD Million
5.2.2.By Application
5.2.2.1. Aerospace- Market Insights and Forecast 2022-2032, USD Million
5.2.2.2. Automotive- Market Insights and Forecast 2022-2032, USD Million
5.2.2.3. Electronics- Market Insights and Forecast 2022-2032, USD Million
5.2.2.4. Construction- Market Insights and Forecast 2022-2032, USD Million
5.2.2.5. Sporting Goods- Market Insights and Forecast 2022-2032, USD Million
5.2.3.By Region
5.2.3.1. North America
5.2.3.2. Latin America
5.2.3.3. Europe
5.2.3.4. Middle East & Africa
5.2.3.5. Asia Pacific
5.2.4.By Competitors
5.2.4.1. Competition Characteristics
5.2.4.2. Market Share & Analysis
6. North America Epoxy Prepreg Resins Market Statistics, 2022-2032F
6.1. Market Size & Growth Outlook
6.1.1.By Revenues in USD Million
6.2. Market Segmentation & Growth Outlook
6.2.1.By Product Type- Market Insights and Forecast 2022-2032, USD Million
6.2.2.By Application- Market Insights and Forecast 2022-2032, USD Million
6.2.3.By Country
6.2.3.1. US
6.2.3.2. Canada
6.2.3.3. Mexico
6.2.3.4. Rest of North America
6.3. US Epoxy Prepreg Resins Market Statistics, 2022-2032F
6.3.1.Market Size & Growth Outlook
6.3.1.1. By Revenues in USD Million
6.3.2.Market Segmentation & Growth Outlook
6.3.2.1. By Product Type- Market Insights and Forecast 2022-2032, USD Million
6.3.2.2. By Application- Market Insights and Forecast 2022-2032, USD Million
6.4. Canada Epoxy Prepreg Resins Market Statistics, 2022-2032F
6.4.1.Market Size & Growth Outlook
6.4.1.1. By Revenues in USD Million
6.4.2.Market Segmentation & Growth Outlook
6.4.2.1. By Product Type- Market Insights and Forecast 2022-2032, USD Million
6.4.2.2. By Application- Market Insights and Forecast 2022-2032, USD Million
6.5. Mexico Epoxy Prepreg Resins Market Statistics, 2022-2032F
6.5.1.Market Size & Growth Outlook
6.5.1.1. By Revenues in USD Million
6.5.2.Market Segmentation & Growth Outlook
6.5.2.1. By Product Type- Market Insights and Forecast 2022-2032, USD Million
6.5.2.2. By Application- Market Insights and Forecast 2022-2032, USD Million
7. Latin America Epoxy Prepreg Resins Market Statistics, 2022-2032F
7.1. Market Size & Growth Outlook
7.1.1.By Revenues in USD Million
7.2. Market Segmentation & Growth Outlook
7.2.1.By Product Type- Market Insights and Forecast 2022-2032, USD Million
7.2.2.By Application- Market Insights and Forecast 2022-2032, USD Million
7.2.3.By Country
7.2.3.1. Brazil
7.2.3.2. Rest of Latin America
7.3. Brazil Epoxy Prepreg Resins Market Statistics, 2022-2032F
7.3.1.Market Size & Growth Outlook
7.3.1.1. By Revenues in USD Million
7.3.2.Market Segmentation & Growth Outlook
7.3.2.1. By Product Type- Market Insights and Forecast 2022-2032, USD Million
7.3.2.2. By Application- Market Insights and Forecast 2022-2032, USD Million
8. Europe Epoxy Prepreg Resins Market Statistics, 2022-2032F
8.1. Market Size & Growth Outlook
8.1.1.By Revenues in USD Million
8.2. Market Segmentation & Growth Outlook
8.2.1.By Product Type- Market Insights and Forecast 2022-2032, USD Million
8.2.2.By Application- Market Insights and Forecast 2022-2032, USD Million
8.2.3.By Country
8.2.3.1. Germany
8.2.3.2. France
8.2.3.3. UK
8.2.3.4. Italy
8.2.3.5. Spain
8.2.3.6. Netherlands
8.2.3.7. Belgium
8.2.3.8. Russia
8.2.3.9. Poland
8.2.3.10. Turkey
8.2.3.11. Rest of Europe
8.3. Germany Epoxy Prepreg Resins Market Statistics, 2022-2032F
8.3.1.Market Size & Growth Outlook
8.3.1.1. By Revenues in USD Million
8.3.2.Market Segmentation & Growth Outlook
8.3.2.1. By Product Type- Market Insights and Forecast 2022-2032, USD Million
8.3.2.2. By Application- Market Insights and Forecast 2022-2032, USD Million
8.4. France Epoxy Prepreg Resins Market Statistics, 2022-2032F
8.4.1.Market Size & Growth Outlook
8.4.1.1. By Revenues in USD Million
8.4.2.Market Segmentation & Growth Outlook
8.4.2.1. By Product Type- Market Insights and Forecast 2022-2032, USD Million
8.4.2.2. By Application- Market Insights and Forecast 2022-2032, USD Million
8.5. UK Epoxy Prepreg Resins Market Statistics, 2022-2032F
8.5.1.Market Size & Growth Outlook
8.5.1.1. By Revenues in USD Million
8.5.2.Market Segmentation & Growth Outlook
8.5.2.1. By Product Type- Market Insights and Forecast 2022-2032, USD Million
8.5.2.2. By Application- Market Insights and Forecast 2022-2032, USD Million
8.6. Italy Epoxy Prepreg Resins Market Statistics, 2022-2032F
8.6.1.Market Size & Growth Outlook
8.6.1.1. By Revenues in USD Million
8.6.2.Market Segmentation & Growth Outlook
8.6.2.1. By Product Type- Market Insights and Forecast 2022-2032, USD Million
8.6.2.2. By Application- Market Insights and Forecast 2022-2032, USD Million
8.7. Spain Epoxy Prepreg Resins Market Statistics, 2022-2032F
8.7.1.Market Size & Growth Outlook
8.7.1.1. By Revenues in USD Million
8.7.2.Market Segmentation & Growth Outlook
8.7.2.1. By Product Type- Market Insights and Forecast 2022-2032, USD Million
8.7.2.2. By Application- Market Insights and Forecast 2022-2032, USD Million
8.8. Netherlands Epoxy Prepreg Resins Market Statistics, 2022-2032F
8.8.1.Market Size & Growth Outlook
8.8.1.1. By Revenues in USD Million
8.8.2.Market Segmentation & Growth Outlook
8.8.2.1. By Product Type- Market Insights and Forecast 2022-2032, USD Million
8.8.2.2. By Application- Market Insights and Forecast 2022-2032, USD Million
8.9. Belgium Epoxy Prepreg Resins Market Statistics, 2022-2032F
8.9.1.Market Size & Growth Outlook
8.9.1.1. By Revenues in USD Million
8.9.2.Market Segmentation & Growth Outlook
8.9.2.1. By Product Type- Market Insights and Forecast 2022-2032, USD Million
8.9.2.2. By Application- Market Insights and Forecast 2022-2032, USD Million
8.10. Russia Epoxy Prepreg Resins Market Statistics, 2022-2032F
8.10.1. Market Size & Growth Outlook
8.10.1.1. By Revenues in USD Million
8.10.2. Market Segmentation & Growth Outlook
8.10.2.1. By Product Type- Market Insights and Forecast 2022-2032, USD Million
8.10.2.2. By Application- Market Insights and Forecast 2022-2032, USD Million
8.11. Poland Epoxy Prepreg Resins Market Statistics, 2022-2032F
8.11.1. Market Size & Growth Outlook
8.11.1.1. By Revenues in USD Million
8.11.2. Market Segmentation & Growth Outlook
8.11.2.1. By Product Type- Market Insights and Forecast 2022-2032, USD Million
8.11.2.2. By Application- Market Insights and Forecast 2022-2032, USD Million
8.12. Turkey Epoxy Prepreg Resins Market Statistics, 2022-2032F
8.12.1. Market Size & Growth Outlook
8.12.1.1. By Revenues in USD Million
8.12.2. Market Segmentation & Growth Outlook
8.12.2.1. By Product Type- Market Insights and Forecast 2022-2032, USD Million
8.12.2.2. By Application- Market Insights and Forecast 2022-2032, USD Million
9. Middle East & Africa Epoxy Prepreg Resins Market Statistics, 2022-2032F
9.1. Market Size & Growth Outlook
9.1.1.By Revenues in USD Million
9.2. Market Segmentation & Growth Outlook
9.2.1.By Product Type- Market Insights and Forecast 2022-2032, USD Million
9.2.2.By Application- Market Insights and Forecast 2022-2032, USD Million
9.2.3.By Country
9.2.3.1. Saudi Arabia
9.2.3.2. UAE
9.2.3.3. Rest of Middle East & Africa
9.3. Saudi Arabia Epoxy Prepreg Resins Market Statistics, 2022-2032F
9.3.1.Market Size & Growth Outlook
9.3.1.1. By Revenues in USD Million
9.3.2.Market Segmentation & Growth Outlook
9.3.2.1. By Product Type- Market Insights and Forecast 2022-2032, USD Million
9.3.2.2. By Application- Market Insights and Forecast 2022-2032, USD Million
9.4. UAE Epoxy Prepreg Resins Market Statistics, 2022-2032F
9.4.1.Market Size & Growth Outlook
9.4.1.1. By Revenues in USD Million
9.4.2.Market Segmentation & Growth Outlook
9.4.2.1. By Product Type- Market Insights and Forecast 2022-2032, USD Million
9.4.2.2. By Application- Market Insights and Forecast 2022-2032, USD Million
10. Asia Pacific Epoxy Prepreg Resins Market Statistics, 2022-2032F
10.1. Market Size & Growth Outlook
10.1.1. By Revenues in USD Million
10.2. Market Segmentation & Growth Outlook
10.2.1. By Product Type- Market Insights and Forecast 2022-2032, USD Million
10.2.2. By Application- Market Insights and Forecast 2022-2032, USD Million
10.2.3. By Country
10.2.3.1. China
10.2.3.2. Japan
10.2.3.3. South Korea
10.2.3.4. India
10.2.3.5. Australia
10.2.3.6. Thailand
10.2.3.7. Rest of Asia Pacific
10.3. China Epoxy Prepreg Resins Market Statistics, 2022-2032F
10.3.1. Market Size & Growth Outlook
10.3.1.1. By Revenues in USD Million
10.3.2. Market Segmentation & Growth Outlook
10.3.2.1. By Product Type- Market Insights and Forecast 2022-2032, USD Million
10.3.2.2. By Application- Market Insights and Forecast 2022-2032, USD Million
10.4. Japan Epoxy Prepreg Resins Market Statistics, 2022-2032F
10.4.1. Market Size & Growth Outlook
10.4.1.1. By Revenues in USD Million
10.4.2. Market Segmentation & Growth Outlook
10.4.2.1. By Product Type- Market Insights and Forecast 2022-2032, USD Million
10.4.2.2. By Application- Market Insights and Forecast 2022-2032, USD Million
10.5. South Korea Epoxy Prepreg Resins Market Statistics, 2022-2032F
10.5.1. Market Size & Growth Outlook
10.5.1.1. By Revenues in USD Million
10.5.2. Market Segmentation & Growth Outlook
10.5.2.1. By Product Type- Market Insights and Forecast 2022-2032, USD Million
10.5.2.2. By Application- Market Insights and Forecast 2022-2032, USD Million
10.6. India Epoxy Prepreg Resins Market Statistics, 2022-2032F
10.6.1. Market Size & Growth Outlook
10.6.1.1. By Revenues in USD Million
10.6.2. Market Segmentation & Growth Outlook
10.6.2.1. By Product Type- Market Insights and Forecast 2022-2032, USD Million
10.6.2.2. By Application- Market Insights and Forecast 2022-2032, USD Million
10.7. Australia Epoxy Prepreg Resins Market Statistics, 2022-2032F
10.7.1. Market Size & Growth Outlook
10.7.1.1. By Revenues in USD Million
10.7.2. Market Segmentation & Growth Outlook
10.7.2.1. By Product Type- Market Insights and Forecast 2022-2032, USD Million
10.7.2.2. By Application- Market Insights and Forecast 2022-2032, USD Million
10.8. Thailand Epoxy Prepreg Resins Market Statistics, 2022-2032F
10.8.1. Market Size & Growth Outlook
10.8.1.1. By Revenues in USD Million
10.8.2. Market Segmentation & Growth Outlook
10.8.2.1. By Product Type- Market Insights and Forecast 2022-2032, USD Million
10.8.2.2. By Application- Market Insights and Forecast 2022-2032, USD Million
11. Competitive Outlook
11.1. Company Profiles
11.1.1. Toray Industries
11.1.1.1. Business Description
11.1.1.2. Product Portfolio
11.1.1.3. Collaborations & Alliances
11.1.1.4. Recent Developments
11.1.1.5. Financial Details
11.1.1.6. Others
11.1.2. Teijin Limited
11.1.2.1. Business Description
11.1.2.2. Product Portfolio
11.1.2.3. Collaborations & Alliances
11.1.2.4. Recent Developments
11.1.2.5. Financial Details
11.1.2.6. Others
11.1.3. Hexcel Corporation
11.1.3.1. Business Description
11.1.3.2. Product Portfolio
11.1.3.3. Collaborations & Alliances
11.1.3.4. Recent Developments
11.1.3.5. Financial Details
11.1.3.6. Others
11.1.4. Mitsubishi Chemical Corporation (Mitsubishi Chemical Carbon Fiber & Composites)
11.1.4.1. Business Description
11.1.4.2. Product Portfolio
11.1.4.3. Collaborations & Alliances
11.1.4.4. Recent Developments
11.1.4.5. Financial Details
11.1.4.6. Others
11.1.5. Gurit Holding AG
11.1.5.1. Business Description
11.1.5.2. Product Portfolio
11.1.5.3. Collaborations & Alliances
11.1.5.4. Recent Developments
11.1.5.5. Financial Details
11.1.5.6. Others
11.1.6. SGL Carbon SE
11.1.6.1. Business Description
11.1.6.2. Product Portfolio
11.1.6.3. Collaborations & Alliances
11.1.6.4. Recent Developments
11.1.6.5. Financial Details
11.1.6.6. Others
11.1.7. Solvay S.A.
11.1.7.1. Business Description
11.1.7.2. Product Portfolio
11.1.7.3. Collaborations & Alliances
11.1.7.4. Recent Developments
11.1.7.5. Financial Details
11.1.7.6. Others
11.1.8. Axiom Materials Inc.
11.1.8.1. Business Description
11.1.8.2. Product Portfolio
11.1.8.3. Collaborations & Alliances
11.1.8.4. Recent Developments
11.1.8.5. Financial Details
11.1.8.6. Others
11.1.9. Park Aerospace Corporation
11.1.9.1. Business Description
11.1.9.2. Product Portfolio
11.1.9.3. Collaborations & Alliances
11.1.9.4. Recent Developments
11.1.9.5. Financial Details
11.1.9.6. Others
11.1.10. Owens Corning
11.1.10.1.Business Description
11.1.10.2.Product Portfolio
11.1.10.3.Collaborations & Alliances
11.1.10.4.Recent Developments
11.1.10.5.Financial Details
11.1.10.6.Others
11.1.11. Asahi Kasei Corp.
11.1.11.1.Business Description
11.1.11.2.Product Portfolio
11.1.11.3.Collaborations & Alliances
11.1.11.4.Recent Developments
11.1.11.5.Financial Details
11.1.11.6.Others
11.1.12. SK Chemicals
11.1.12.1.Business Description
11.1.12.2.Product Portfolio
11.1.12.3.Collaborations & Alliances
11.1.12.4.Recent Developments
11.1.12.5.Financial Details
11.1.12.6.Others
11.1.13. Huntsman / Araldite systems
11.1.13.1.Business Description
11.1.13.2.Product Portfolio
11.1.13.3.Collaborations & Alliances
11.1.13.4.Recent Developments
11.1.13.5.Financial Details
11.1.13.6.Others
11.1.14. Arkema
11.1.14.1.Business Description
11.1.14.2.Product Portfolio
11.1.14.3.Collaborations & Alliances
11.1.14.4.Recent Developments
11.1.14.5.Financial Details
11.1.14.6.Others
11.1.15. Plastic Reinforcement Fabrics Ltd.
11.1.15.1.Business Description
11.1.15.2.Product Portfolio
11.1.15.3.Collaborations & Alliances
11.1.15.4.Recent Developments
11.1.15.5.Financial Details
11.1.15.6.Others
12. Disclaimer
| Segment | Sub-Segment |
|---|---|
| By Product Type |
|
| By Application |
|
| By Region |
|
Research Methodology
This study followed a structured approach comprising four key phases to assess the size and scope of the electro-oxidation market. The process began with thorough secondary research to collect data on the target market, related markets, and broader industry context. These findings, along with preliminary assumptions and estimates, were then validated through extensive primary research involving industry experts from across the value chain. To calculate the overall market size, both top-down and bottom-up methodologies were employed. Finally, market segmentation and data triangulation techniques were applied to refine and validate segment-level estimations.
Secondary Research
The secondary research phase involved gathering data from a wide range of credible and published sources. This step helped in identifying industry trends, defining market segmentation, and understanding the market landscape and value chain.
Sources consulted during this phase included:
- Company annual reports, investor presentations, and press releases
- Industry white papers and certified publications
- Trade directories and market-recognized databases
- Articles from authoritative authors and reputable journals
- Gold and silver standard websites
Secondary research was critical in mapping out the industry's value chain and monetary flow, identifying key market segments, understanding regional variations, and tracking significant industry developments.
Other key sources:
- Financial disclosures
- Industry associations and trade bodies
- News outlets and business magazines
- Academic journals and research studies
- Paid industry databases
Primary Research
To validate secondary data and gain deeper market insights, primary research was conducted with key stakeholders across both the supply and demand sides of the market.
On the demand side, participants included decision-makers and influencers from end-user industries—such as CIOs, CTOs, and CSOs—who provided first-hand perspectives on market needs, product usage, and future expectations.
On the supply side, interviews were conducted with manufacturers, industry associations, and institutional participants to gather insights into current offerings, product pipelines, and market challenges.
Primary interviews provided critical inputs such as:
- Market size and revenue data
- Product and service breakdowns
- Market forecasts
- Regional and application-specific trends
Stakeholders consulted included:
- Leading OEM and solution providers
- Channel and distribution partners
- End users across various applications
- Independent consultants and industry specialists
Market Size Estimation and Data Triangulation
- Identifying Key Market Participants (Secondary Research)
- Goal: To identify the major players or companies in the target market. This typically involves using publicly available data sources such as industry reports, market research publications, and financial statements of companies.
- Tools: Reports from firms like Gartner, Forrester, Euromonitor, Statista, IBISWorld, and others. Public financial statements, news articles, and press releases from top market players.
- Extracting Earnings of Key Market Participants
- Goal: To estimate the earnings generated from the product or service being analyzed. This step helps in understanding the revenue potential of each market player in a specific geography.
- Methods: Earnings data can be gathered from:
- Publicly available financial reports (for listed companies).
- Interviews and primary data sources from professionals, such as Directors, VPs, SVPs, etc. This is especially useful for understanding more nuanced, internal data that isn't publicly disclosed.
- Annual reports and investor presentations of key players.
- Data Collation and Development of a Relevant Data Model
- Goal: To collate inputs from both primary and secondary sources into a structured, data-driven model for market estimation. This model will incorporate key market KPIs and any independent variables relevant to the market.
- Key KPIs: These could include:
- Market size, growth rate, and demand drivers.
- Industry-specific metrics like market share, average revenue per customer (ARPC), or average deal size.
- External variables, such as economic growth rates, inflation rates, or commodity prices, that could affect the market.
- Data Modeling: Based on this data, the market forecasts are developed for the next 5 years. A combination of trend analysis, scenario modeling, and statistical regression might be used to generate projections.
- Scenario Analysis
- Goal: To test different assumptions and validate how sensitive the market is to changes in key variables (e.g., market demand, regulatory changes, technological disruptions).
- Types of Scenarios:
- Base Case: Based on current assumptions and historical data.
- Best-Case Scenario: Assuming favorable market conditions, regulatory environments, and technological advancements.
- Worst-Case Scenario: Accounting for adverse factors, such as economic downturns, stricter regulations, or unexpected disruptions.


