Ecuador Sports Nutrition Market Report: Trends, Growth and Forecast (2026-2032)
Product Type (Sports Protein Products (Protein/Energy Bars, Sports Protein Powder, Sports Protein RTD), Sports Non-Protein Products), Sales Channel (Retail Offline, Retail Online), Ingredients (Vitamins and Minerals, Proteins and Amino Acids, Carbohydrates, Probiotics, Botanicals/Herbals, Others), Functionality (Energy, Muscle growth, Hydration, Weight Management, Others), End User (Bodybuilders, Athletes, Lifestyle Users) ... Read more
|
Major Players
|
Ecuador Sports Nutrition Market Statistics and Insights, 2026
- Market Size Statistics
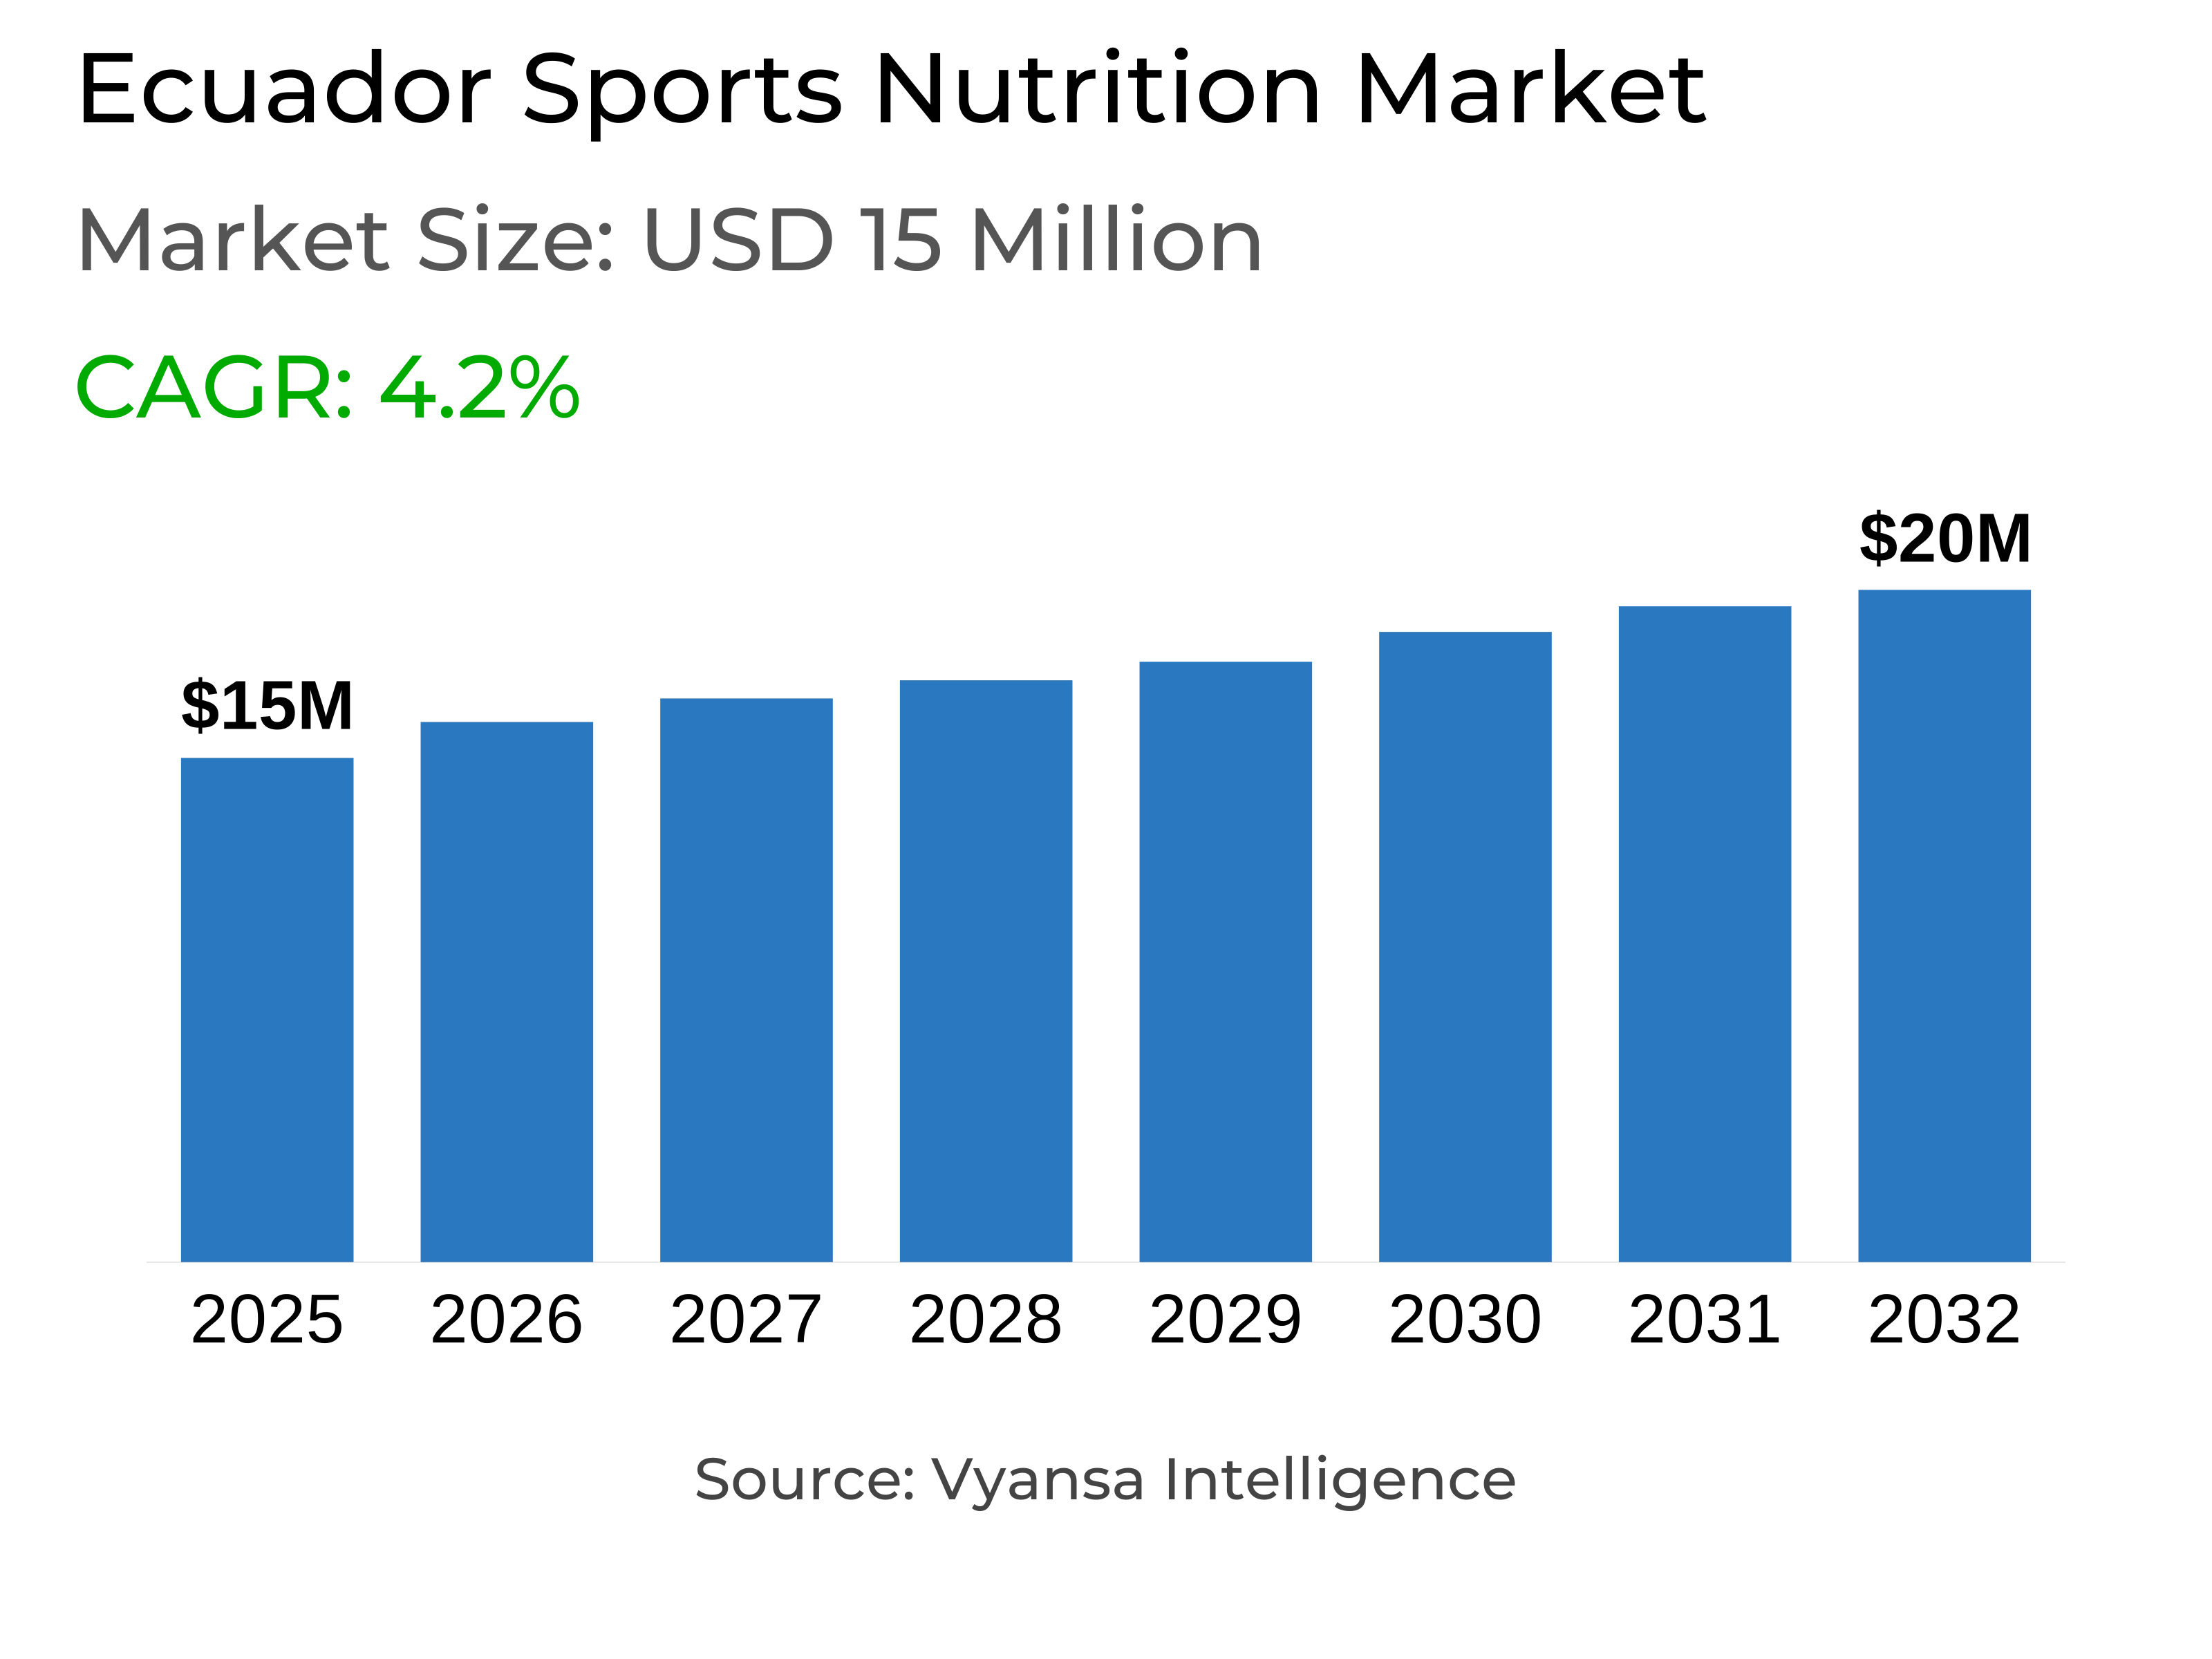
- Sports nutrition in ecuador is estimated at USD 15 million.
- The market size is expected to grow to USD 20 million by 2032.
- Market to register a cagr of around 4.2% during 2026-32.
- Product Type Shares
- Sports protein products grabbed market share of 65%.
- Competition
- More than 5 companies are actively engaged in producing sports nutrition in ecuador.
- Top 3 companies acquired around 70% of the market share.
- Prolife Ecuador SA, Omnilife del Ecuador SA, Herbalife del Ecuador SA etc., are few of the top companies.
- Sales Channel
- Retail offline grabbed 70% of the market.
Ecuador Sports Nutrition Market Outlook
The sports nutrition market in Ecuador is worth around USD 15 million in 2025 and is anticipated to reach around USD 20 million in 2032, with a CAGR of around 4.2% over the forecast period of 2026–2032. The consistent increase reflects the trend of more individuals engaging in fitness, recovery, and healthy lifestyles. Sports nutrition products are now increasingly used by many end users to remain active and enhance overall health. Despite the high prices, the market remains firm, demonstrating the strength of its capacity to expand irrespective of economic setbacks.
Sports protein products dominate the market with around 65% share, as the end user demands protein powder, bars, and ready to drink formats due to their convenience and nutritional values. These will assist in recovering and building muscle strength, which is why they are the most sought after. Other non protein products such as BCAAs, creatine, and pre-workout supplements are used, but they account for a smaller segment of the market.
Retail offline channels account for around 70% of overall sales, supported by additional specialist stores and health food shops opening in key cities. Greater availability makes it easier for reliable products to reach end users and minimizes illegal sales. Direct selling is also becoming better, allowing customizable payment and more immediate contact between buyers and sellers.
With increasing health consciousness, improved availability, and increased interest in active living, the market will grow steadily to 2032, becoming a staple of everyday fitness and wellness practices in Ecuador.

Ecuador Sports Nutrition Market Growth DriverGrowing Focus on Health and Physical Activity
End user are more focused on staying healthy and physically active. They seek sports nutrition products to aid their physical activities, enabling them to enhance fitness levels, recover more quickly, and enjoy overall well being. This growing interest keeps the category strong, even when prices are high, showing its resilience despite economic and social challenges.
The increasing demand has also led to a huge number of brands entering the market. Though there are only a few dominating brands, the competition encourages innovation and diversity, providing end users with a lot of choice. As end users become aware of the advantages of sports nutrition, the market continues to expand steadily. End users focus on health, convenience, and performance supports long term growth, making sports nutrition a key part of their active lifestyles.
Ecuador Sports Nutrition Market ChallengeHigh Prices and Informal Market Impact
Sports nutrition products are sold at very high rates, with some of them being almost double the price in other markets. This encourages informal market activity, as end users go for the cheaper alternatives rather than purchasing from official retailers. Smuggling plays a major role, enabling end users to obtain products at lower costs. Though it benefits end user by saving them money, it effects the sales and growth of brands sold through regular stores.
End users with higher incomes use shopping websites such as Amazon or Tiendamía to purchase products from overseas. They do this to get better prices, more variety, and higher quality products. This creates an additional difficulty for local brands to compete. End users still favor informal or imported products, which restricts the development of officially marketed brands and creates a persistent problem for the market to keep growing steadily.
Unlock Market Intelligence
Explore the market potential with our data-driven report
Ecuador Sports Nutrition Market TrendRising Awareness and Demand for Tailored Nutrition
End users are becoming aware of sports nutrition and are look for products tailored to their individual requirements. Knowing the advantages of accurate nutrient consumption for enhanced performance and recovery, the demand for specific supplements is increasing. Protein powders, BCAAs, creatine, and pre workout supplements are popular as end users search for solutions that support their fitness objectives, such as muscle growth, endurance, and fat loss.
This change is supported by increased exposure to information via digital media and more emphasis on health and wellness. End user are better educated than ever before and are deliberately opting for products that enable them to meet their individual wellness goals. Brands that respond to this demand navigate more engagement and loyalty with end users.
Ecuador Sports Nutrition Market OpportunitySupportive Policies and Growing Market
Government initiatives to promote healthier lifestyles and fight obesity will help sports nutrition grow. More numbers of end users will incorporate nutrients products into their fitness, recovery, and general health goals, supported by marketing campaigns that promote physical exercise and good nutrition. The emphasis on being healthy will support sales of sports nutrition products across various age groups and areas of the country.
Brands supplying products that are aligned with these health programs such as energy, recovery, and balanced nutrition products will have the chance to reach more end users using various sales channels. Promotion in gyms, wellness programs, and schools will also raise awareness and use. With government assistance and people being increasingly concerned about health, the market is anticipated to grow consistently and reach more end users over this period.
Unlock Market Intelligence
Explore the market potential with our data-driven report
Ecuador Sports Nutrition Market Segmentation Analysis

By Product Type
- Sports Protein Products
- Sports Non-Protein Products
Sports protein products dominate the segment, with around 65% of the overall market, with protein powders proving the most popular as end users look for products to support recovery, muscle gain, and general wellbeing. Protein and energy bars, along with ready to drink protein, are also gaining attention for their convenience and quick nutrition. Sports protein products' dominance is predicted to persist throughout 2026–2032 as more end users adopt active lifestyles and focus on preventive health.
Non protein products, including BCAAs, creatine, and pre workout supplements, constitute a niche segment with consistent growth. Although they serve individual fitness requirements, the major market activity and demand will be centered on sports protein products that keep pushing the category's overall growth in the forecast period.
By Sales Channel
- Retail Offline
- Retail Online
Retail offline channels dominate the market, accounting for around 70% of sales. More specialist stores and health food shops are opening across cities, offering a wide range of sports nutrition products at different prices. Most of these stores are situated in shopping centres, where they capture constant foot traffic and high exposure. This broader retail presence allows more end users to access trusted products and is expected to reduce informal sales.
Additionally, with more shops expanding and competition increasing, prices are likely to remain steady, driving steady market expansion in the next few years. Direct selling is also coming back from the pandemic, supported by increasing numbers of independent sellers. This is a good channel for sports nutrition since it provides personal contact between sellers and end users. It also provides customizable payment terms, making expensive products more affordable.
Top Companies in Ecuador Sports Nutrition Market
The top companies operating in the market include Prolife Ecuador SA, Omnilife del Ecuador SA, Herbalife del Ecuador SA, etc., are the top players operating in the ecuador sports nutrition market.
Frequently Asked Questions
Related Report
1. Market Segmentation
1.1. Research Scope
1.2. Research Methodology
1.3. Definitions and Assumptions
2. Executive Summary
3. Ecuador Sports Nutrition Market Policies, Regulations, and Standards
4. Ecuador Sports Nutrition Market Dynamics
4.1. Growth Factors
4.2. Challenges
4.3. Trends
4.4. Opportunities
5. Ecuador Sports Nutrition Market Statistics, 2022-2032F
5.1. Market Size & Growth Outlook
5.1.1.By Revenues in US$ Million
5.2. Market Segmentation & Growth Outlook
5.2.1.By Product Type
5.2.1.1. Sports Protein Products- Market Insights and Forecast 2022-2032, USD Million
5.2.1.1.1. Protein/Energy Bars- Market Insights and Forecast 2022-2032, USD Million
5.2.1.1.2. Sports Protein Powder- Market Insights and Forecast 2022-2032, USD Million
5.2.1.1.3. Sports Protein RTD- Market Insights and Forecast 2022-2032, USD Million
5.2.1.2. Sports Non-Protein Products- Market Insights and Forecast 2022-2032, USD Million
5.2.2.By Sales Channel
5.2.2.1. Retail Offline- Market Insights and Forecast 2022-2032, USD Million
5.2.2.2. Retail Online- Market Insights and Forecast 2022-2032, USD Million
5.2.3.By Ingredients
5.2.3.1. Vitamins and Minerals- Market Insights and Forecast 2022-2032, USD Million
5.2.3.2. Proteins and Amino Acids- Market Insights and Forecast 2022-2032, USD Million
5.2.3.3. Carbohydrates- Market Insights and Forecast 2022-2032, USD Million
5.2.3.4. Probiotics- Market Insights and Forecast 2022-2032, USD Million
5.2.3.5. Botanicals/Herbals- Market Insights and Forecast 2022-2032, USD Million
5.2.3.6. Others- Market Insights and Forecast 2022-2032, USD Million
5.2.4.By Functionality
5.2.4.1. Energy- Market Insights and Forecast 2022-2032, USD Million
5.2.4.2. Muscle growth- Market Insights and Forecast 2022-2032, USD Million
5.2.4.3. Hydration- Market Insights and Forecast 2022-2032, USD Million
5.2.4.4. Weight Management- Market Insights and Forecast 2022-2032, USD Million
5.2.4.5. Others- Market Insights and Forecast 2022-2032, USD Million
5.2.5.By End User
5.2.5.1. Bodybuilders- Market Insights and Forecast 2022-2032, USD Million
5.2.5.2. Athletes- Market Insights and Forecast 2022-2032, USD Million
5.2.5.3. Lifestyle Users- Market Insights and Forecast 2022-2032, USD Million
5.2.6.By Competitors
5.2.6.1. Competition Characteristics
5.2.6.2. Market Share & Analysis
6. Ecuador Protein Products Sports Nutrition Market Statistics, 2022-2032F
6.1. Market Size & Growth Outlook
6.1.1.By Revenues in US$ Million
6.2. Market Segmentation & Growth Outlook
6.2.1.By Sales Channel- Market Insights and Forecast 2022-2032, USD Million
6.2.2.By Ingredients- Market Insights and Forecast 2022-2032, USD Million
6.2.3.By Functionality- Market Insights and Forecast 2022-2032, USD Million
6.2.4.By End User- Market Insights and Forecast 2022-2032, USD Million
7. Ecuador Non-Protein Products Sports Nutrition Market Statistics, 2022-2032F
7.1. Market Size & Growth Outlook
7.1.1.By Revenues in US$ Million
7.2. Market Segmentation & Growth Outlook
7.2.1.By Sales Channel- Market Insights and Forecast 2022-2032, USD Million
7.2.2.By Ingredients- Market Insights and Forecast 2022-2032, USD Million
7.2.3.By Functionality- Market Insights and Forecast 2022-2032, USD Million
7.2.4.By End User- Market Insights and Forecast 2022-2032, USD Million
8. Competitive Outlook
8.1. Company Profiles
8.1.1.Omnilife del Ecuador SA
8.1.1.1. Business Description
8.1.1.2. Product Portfolio
8.1.1.3. Collaborations & Alliances
8.1.1.4. Recent Developments
8.1.1.5. Financial Details
8.1.1.6. Others
8.1.2.Herbalife del Ecuador SA
8.1.2.1. Business Description
8.1.2.2. Product Portfolio
8.1.2.3. Collaborations & Alliances
8.1.2.4. Recent Developments
8.1.2.5. Financial Details
8.1.2.6. Others
8.1.3.Prolife Ecuador SA
8.1.3.1. Business Description
8.1.3.2. Product Portfolio
8.1.3.3. Collaborations & Alliances
8.1.3.4. Recent Developments
8.1.3.5. Financial Details
8.1.3.6. Others
8.1.4.Company 4
8.1.4.1. Business Description
8.1.4.2. Product Portfolio
8.1.4.3. Collaborations & Alliances
8.1.4.4. Recent Developments
8.1.4.5. Financial Details
8.1.4.6. Others
8.1.5.Company 5
8.1.5.1. Business Description
8.1.5.2. Product Portfolio
8.1.5.3. Collaborations & Alliances
8.1.5.4. Recent Developments
8.1.5.5. Financial Details
8.1.5.6. Others
8.1.6.Company 6
8.1.6.1. Business Description
8.1.6.2. Product Portfolio
8.1.6.3. Collaborations & Alliances
8.1.6.4. Recent Developments
8.1.6.5. Financial Details
8.1.6.6. Others
8.1.7.Company 7
8.1.7.1. Business Description
8.1.7.2. Product Portfolio
8.1.7.3. Collaborations & Alliances
8.1.7.4. Recent Developments
8.1.7.5. Financial Details
8.1.7.6. Others
8.1.8.Company 8
8.1.8.1. Business Description
8.1.8.2. Product Portfolio
8.1.8.3. Collaborations & Alliances
8.1.8.4. Recent Developments
8.1.8.5. Financial Details
8.1.8.6. Others
8.1.9.Company 9
8.1.9.1. Business Description
8.1.9.2. Product Portfolio
8.1.9.3. Collaborations & Alliances
8.1.9.4. Recent Developments
8.1.9.5. Financial Details
8.1.9.6. Others
8.1.10. Company 10
8.1.10.1. Business Description
8.1.10.2. Product Portfolio
8.1.10.3. Collaborations & Alliances
8.1.10.4. Recent Developments
8.1.10.5. Financial Details
8.1.10.6. Others
9. Disclaimer
| Segment | Sub-Segment |
|---|---|
| By Product Type |
|
| By Sales Channel |
|
| By Ingredients |
|
| By Functionality |
|
| By End User |
|
Research Methodology
This study followed a structured approach comprising four key phases to assess the size and scope of the electro-oxidation market. The process began with thorough secondary research to collect data on the target market, related markets, and broader industry context. These findings, along with preliminary assumptions and estimates, were then validated through extensive primary research involving industry experts from across the value chain. To calculate the overall market size, both top-down and bottom-up methodologies were employed. Finally, market segmentation and data triangulation techniques were applied to refine and validate segment-level estimations.
Secondary Research
The secondary research phase involved gathering data from a wide range of credible and published sources. This step helped in identifying industry trends, defining market segmentation, and understanding the market landscape and value chain.
Sources consulted during this phase included:
- Company annual reports, investor presentations, and press releases
- Industry white papers and certified publications
- Trade directories and market-recognized databases
- Articles from authoritative authors and reputable journals
- Gold and silver standard websites
Secondary research was critical in mapping out the industry's value chain and monetary flow, identifying key market segments, understanding regional variations, and tracking significant industry developments.
Other key sources:
- Financial disclosures
- Industry associations and trade bodies
- News outlets and business magazines
- Academic journals and research studies
- Paid industry databases
Primary Research
To validate secondary data and gain deeper market insights, primary research was conducted with key stakeholders across both the supply and demand sides of the market.
On the demand side, participants included decision-makers and influencers from end-user industries—such as CIOs, CTOs, and CSOs—who provided first-hand perspectives on market needs, product usage, and future expectations.
On the supply side, interviews were conducted with manufacturers, industry associations, and institutional participants to gather insights into current offerings, product pipelines, and market challenges.
Primary interviews provided critical inputs such as:
- Market size and revenue data
- Product and service breakdowns
- Market forecasts
- Regional and application-specific trends
Stakeholders consulted included:
- Leading OEM and solution providers
- Channel and distribution partners
- End users across various applications
- Independent consultants and industry specialists
Market Size Estimation and Data Triangulation
- Identifying Key Market Participants (Secondary Research)
- Goal: To identify the major players or companies in the target market. This typically involves using publicly available data sources such as industry reports, market research publications, and financial statements of companies.
- Tools: Reports from firms like Gartner, Forrester, Euromonitor, Statista, IBISWorld, and others. Public financial statements, news articles, and press releases from top market players.
- Extracting Earnings of Key Market Participants
- Goal: To estimate the earnings generated from the product or service being analyzed. This step helps in understanding the revenue potential of each market player in a specific geography.
- Methods: Earnings data can be gathered from:
- Publicly available financial reports (for listed companies).
- Interviews and primary data sources from professionals, such as Directors, VPs, SVPs, etc. This is especially useful for understanding more nuanced, internal data that isn't publicly disclosed.
- Annual reports and investor presentations of key players.
- Data Collation and Development of a Relevant Data Model
- Goal: To collate inputs from both primary and secondary sources into a structured, data-driven model for market estimation. This model will incorporate key market KPIs and any independent variables relevant to the market.
- Key KPIs: These could include:
- Market size, growth rate, and demand drivers.
- Industry-specific metrics like market share, average revenue per customer (ARPC), or average deal size.
- External variables, such as economic growth rates, inflation rates, or commodity prices, that could affect the market.
- Data Modeling: Based on this data, the market forecasts are developed for the next 5 years. A combination of trend analysis, scenario modeling, and statistical regression might be used to generate projections.
- Scenario Analysis
- Goal: To test different assumptions and validate how sensitive the market is to changes in key variables (e.g., market demand, regulatory changes, technological disruptions).
- Types of Scenarios:
- Base Case: Based on current assumptions and historical data.
- Best-Case Scenario: Assuming favorable market conditions, regulatory environments, and technological advancements.
- Worst-Case Scenario: Accounting for adverse factors, such as economic downturns, stricter regulations, or unexpected disruptions.


