Denmark Sports Nutrition Market Report: Trends, Growth and Forecast (2026-2032)
By Product Type (Sports Protein Products (Protein/Energy Bars, Sports Protein Powder, Sports Protein RTD), Sports Non-Protein Products), By Sales Channel (Retail Offline, Retail Online), By Ingredients (Vitamins and Minerals, Proteins and Amino Acids, Carbohydrates, Probiotics, Botanicals/Herbals, Others), By Functionality (Energy, Muscle growth, Hydration, Weight Management, Others), By End User (Bodybuilders, Athletes, Lifestyle Users) ... Read more
|
Major Players
|
Denmark Sports Nutrition Market Statistics and Insights, 2026
- Market Size Statistics
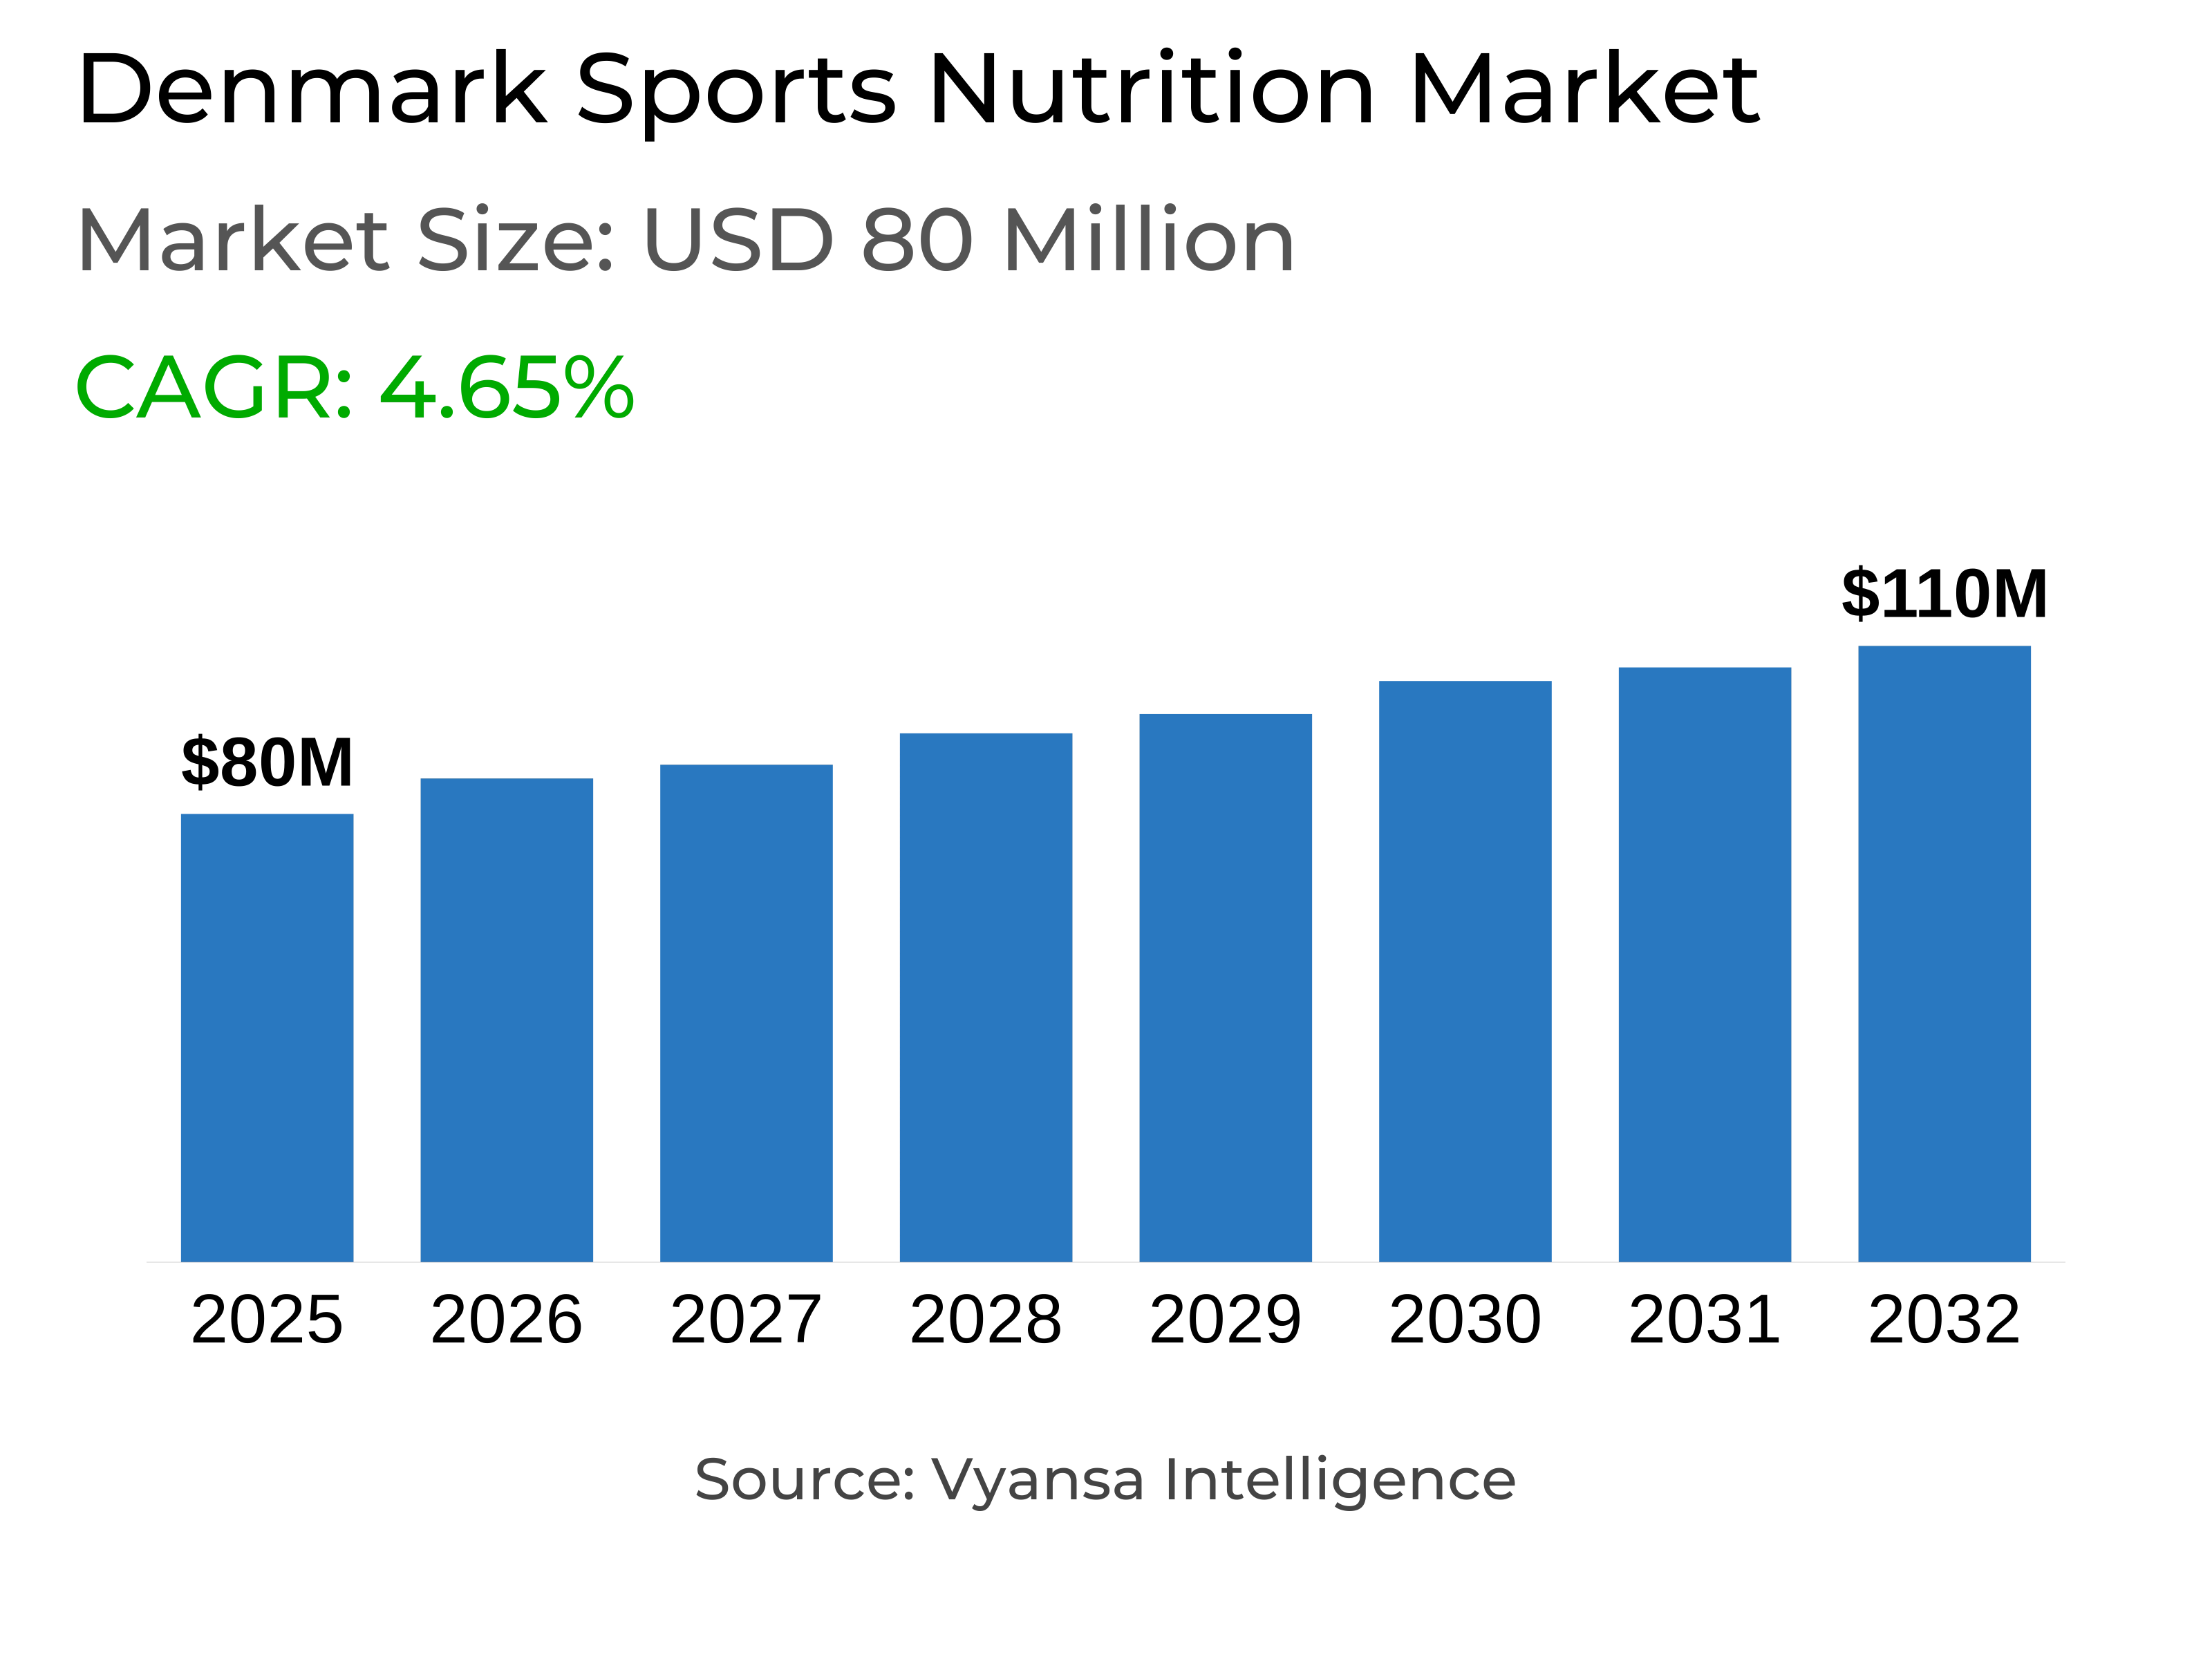
- Sports nutrition in denmark is estimated at USD 80 million.
- The market size is expected to grow to USD 110 million by 2032.
- Market to register a cagr of around 4.65% during 2026-32.
- Product Type Shares
- Sports protein products grabbed market share of 85%.
- Competition
- More than 10 companies are actively engaged in producing sports nutrition in denmark.
- Top 5 companies acquired around 55% of the market share.
- Orkla Care A/S, Vitamin Well Danmark ApS, PurePower Aps, Nutramino ApS, Bodylab ApS etc., are few of the top companies.
- Sales Channel
- Retail online grabbed 70% of the market.
Denmark Sports Nutrition Market Outlook
The sports nutrition market in Denmark is estimated at around $80 million in 2025 and is likely to reach around $110 million by 2032, growing at a rate of around 4.65% between the years 2026-32. Such growth is due to an increasing number of end users being focused on health and fitness. End users who visit gyms and aged end users are incorporating protein products as part of their daily routines in order to maintain strength and boost overall health. Easy availability of these products in stores and online encourages regular use and strengthens overall growth.
Sports protein products lead in the market, with a share of around 85%, while ready to drink beverages and protein bars are the most rapidly growing formats. Their convenience and accessibility make them a preferred choice for end users looking for quick, nutritious options. Non-protein products grow but represent a smaller segment of the market because end users only concentrate on protein based solutions for recovery and fitness.
Retail online is the dominant channel, with around 70% of the market share, due to its convenience and competitive pricing. End users are now more frequently purchasing in bulk from retail online channels, with retail offline channels like supermarkets and health clubs being utilized more for protein bars and RTDs. Online retail will continue to dominate because brands are enhancing delivery and shopping experiences to attract more end users.
Additionally, with increasing social media popularity, growing demand for vegan and natural formulations, and increased focus on active lifestyles are helping the market expand steadily. Players are expected to launch more plant based and clean label products, while protein-based solutions continue to be popular among end users.

Denmark Sports Nutrition Market Growth DriverExpanding Interest Among Health Focused End Users
Sports nutrition is experiencing consistent growth with end users developing a health and fitness conscious lifestyle. Although gym going end users are still the primary group, a majority of older end users are now using protein products in order to stay strong and support muscle health. This increased interest across various age groups is making sports nutrition an integral component of daily wellness rather than a product reserved for athletes alone.
The accessibility of such products in everyday stores and gyms supports this rise in demand. End users can now find their preferred products easily, which encourages frequent use and builds stronger brand loyalty. With increasing end users from different age groups recognizing the advantages of proper protein intake, the market for sports nutrition keeps on expanding steadily.
Denmark Sports Nutrition Market ChallengeUnclear Rules and Labeling Issues
Unclear rules about product definitions and labeling continues to create difficulties for the sports nutrition industry. Most sport nutrition products intended for end users like athletes are governed by the general food laws, which leads to inconsistent labels and marketing. This may confuse end users, which makes it more difficult for them to understand product benefit and choose the most appropriate choices for their fitness needs.
Moreover, upcoming changes in European Union regulations cast a shadow of uncertainty over manufacturers. Companies must adhere to these regulations to make sure their products meet legal standards. This may slow down new product rollouts and restrict innovation,while also making it harder for brands to gain the trust of end users. Navigating these rules is an important concern for the market’s steady growth.
Unlock Market Intelligence
Explore the market potential with our data-driven report
Denmark Sports Nutrition Market TrendSocial Media Inspiring Active Lifestyles
Social media is playing a significant role in influencing end users perceptions on fitness and healthy diets. End users follow fitness pages and influencers who share workout ideas and promote protein rich snacks and drinks. It encourages end users to include products such as protein bars and ready-to-drink shakes in their daily lives as an easy way to stay healthy and active. The steady flow of content on such topics keeps sports nutrition in the limelight and on everyone's tongues.
Meanwhile, as more end users are focussed on incorporating fitness into their daily routine. They are looking forward for sports nutrition products that enable them to remain energetic, recover quicker, and feel healthier in general. Such growing interest to lead an active lifestyle is consistently strengthening the demand for sports nutrition products in the market.
Denmark Sports Nutrition Market OpportunityRising Scope for Vegan and Natural Formulations
The growing number of end users following vegan and vegetarian diets will create new scope for plant-based and natural sports nutrition products in the coming years.Manufacturers will expnad their portfolios with more protein powders, bars, and ready-to-drink products made from clean and natural ingredients that are vegan. This shift will help brands reach a wider group of health-conscious end users who prefer sustainable and plant-based choices.
Even though vegan variants are currently on offer, their demand will increase further as more end users perceive them as healthier and safer options. This shift in demand will push manufacturers to innovate and create new formulas that fit the clean label movement. Consequently, the category for vegan and natural sports nutrition products will emerge as one of the major growth segments in the sport nutrition market during the period.
Unlock Market Intelligence
Explore the market potential with our data-driven report
Denmark Sports Nutrition Market Segmentation Analysis

By Product Type
- Sports Protein Products
- Sports Non-Protein Products
Sports protein products lead the market with around 86% market share due to high demand from end users. Ready-to-drink (RTD) and protein bars are the most rapidly growing categories, fueled by their convenience and popularity as quick food or snack among health oriented, busy end users. Their convenient availability in supermarkets, convenience stores, and vending machines ensures that they are very accessible and invites frequent use, deepening their penetration in the market.
Non-protein sports products occupy a smaller share of the market and continue to grow steadily, catering to specific needs of certain end users. However, the main focus still goes to protein based products for their direct benefits in fitness and recovery. In general, convenience, popularity, and widespread availability of RTDs and protein bars guarantee that sports protein products continue to be the dominant segment, defining the structure and dynamics of the sports nutrition market.
By Sales Channel
- Retail Offline
- Retail Online
Retail online is the leading channel for sports nutrition, capturing around 70% market share. It is favored by end users due to its convenience and prices, making it the most favored method of purchase. Most brands have established robust retail online shops, with some specializing significantly in retail online or offering special online discounts. Bulk buying of protein powders and non-protein products is common online, whereas protein bars and RTDs tend to be purchased through retail offline channels such as convenience stores, gyms, or grocery stores.
Retail online will continue to remain the leading channel over the next few years as competition intensifies. Brands are enhancing delivery, providing quicker shipment and simplified shopping processes to get the attention of end users. As more end users seek convenience and competitive prices, retail online will continue to take a larger share from retail offline and remain the key channel for sports nutrition.
Top Companies in Denmark Sports Nutrition Market
The top companies operating in the market include Orkla Care A/S, Vitamin Well Danmark ApS, PurePower Aps, Nutramino ApS, Bodylab ApS, Gymgrossisten AB, Hut Group Ltd, The, Optimum Nutrition Sweden AB, Natur Drogeriet A/S, Easis A/S, etc., are the top players operating in the denmark sports nutrition market.
Frequently Asked Questions
Related Report
1. Market Segmentation
1.1. Research Scope
1.2. Research Methodology
1.3. Definitions and Assumptions
2. Executive Summary
3. Denmark Sports Nutrition Market Policies, Regulations, and Standards
4. Denmark Sports Nutrition Market Dynamics
4.1. Growth Factors
4.2. Challenges
4.3. Trends
4.4. Opportunities
5. Denmark Sports Nutrition Market Statistics, 2022-2032F
5.1. Market Size & Growth Outlook
5.1.1.By Revenues in USD Million
5.2. Market Segmentation & Growth Outlook
5.2.1.By Product Type
5.2.1.1. Sports Protein Products- Market Insights and Forecast 2022-2032, USD Million
5.2.1.1.1. Protein/Energy Bars- Market Insights and Forecast 2022-2032, USD Million
5.2.1.1.2. Sports Protein Powder- Market Insights and Forecast 2022-2032, USD Million
5.2.1.1.3. Sports Protein RTD- Market Insights and Forecast 2022-2032, USD Million
5.2.1.2. Sports Non-Protein Products- Market Insights and Forecast 2022-2032, USD Million
5.2.2.By Sales Channel
5.2.2.1. Retail Offline- Market Insights and Forecast 2022-2032, USD Million
5.2.2.2. Retail Online- Market Insights and Forecast 2022-2032, USD Million
5.2.3.By Ingredients
5.2.3.1. Vitamins and Minerals- Market Insights and Forecast 2022-2032, USD Million
5.2.3.2. Proteins and Amino Acids- Market Insights and Forecast 2022-2032, USD Million
5.2.3.3. Carbohydrates- Market Insights and Forecast 2022-2032, USD Million
5.2.3.4. Probiotics- Market Insights and Forecast 2022-2032, USD Million
5.2.3.5. Botanicals/Herbals- Market Insights and Forecast 2022-2032, USD Million
5.2.3.6. Others- Market Insights and Forecast 2022-2032, USD Million
5.2.4.By Functionality
5.2.4.1. Energy- Market Insights and Forecast 2022-2032, USD Million
5.2.4.2. Muscle growth- Market Insights and Forecast 2022-2032, USD Million
5.2.4.3. Hydration- Market Insights and Forecast 2022-2032, USD Million
5.2.4.4. Weight Management- Market Insights and Forecast 2022-2032, USD Million
5.2.4.5. Others- Market Insights and Forecast 2022-2032, USD Million
5.2.5.By End User
5.2.5.1. Bodybuilders- Market Insights and Forecast 2022-2032, USD Million
5.2.5.2. Athletes- Market Insights and Forecast 2022-2032, USD Million
5.2.5.3. Lifestyle Users- Market Insights and Forecast 2022-2032, USD Million
5.2.6.By Competitors
5.2.6.1. Competition Characteristics
5.2.6.2. Market Share & Analysis
6. Denmark Protein Products Sports Nutrition Market Statistics, 2022-2032F
6.1. Market Size & Growth Outlook
6.1.1.By Revenues in USD Million
6.2. Market Segmentation & Growth Outlook
6.2.1.By Sales Channel- Market Insights and Forecast 2022-2032, USD Million
6.2.2.By Ingredients- Market Insights and Forecast 2022-2032, USD Million
6.2.3.By Functionality- Market Insights and Forecast 2022-2032, USD Million
6.2.4.By End User- Market Insights and Forecast 2022-2032, USD Million
7. Denmark Non-Protein Products Sports Nutrition Market Statistics, 2022-2032F
7.1. Market Size & Growth Outlook
7.1.1.By Revenues in USD Million
7.2. Market Segmentation & Growth Outlook
7.2.1.By Sales Channel- Market Insights and Forecast 2022-2032, USD Million
7.2.2.By Ingredients- Market Insights and Forecast 2022-2032, USD Million
7.2.3.By Functionality- Market Insights and Forecast 2022-2032, USD Million
7.2.4.By End User- Market Insights and Forecast 2022-2032, USD Million
8. Competitive Outlook
8.1. Company Profiles
8.1.1.Nutramino ApS
8.1.1.1. Business Description
8.1.1.2. Product Portfolio
8.1.1.3. Collaborations & Alliances
8.1.1.4. Recent Developments
8.1.1.5. Financial Details
8.1.1.6. Others
8.1.2.Bodylab ApS
8.1.2.1. Business Description
8.1.2.2. Product Portfolio
8.1.2.3. Collaborations & Alliances
8.1.2.4. Recent Developments
8.1.2.5. Financial Details
8.1.2.6. Others
8.1.3.Gymgrossisten AB
8.1.3.1. Business Description
8.1.3.2. Product Portfolio
8.1.3.3. Collaborations & Alliances
8.1.3.4. Recent Developments
8.1.3.5. Financial Details
8.1.3.6. Others
8.1.4.Hut Group Ltd, The
8.1.4.1. Business Description
8.1.4.2. Product Portfolio
8.1.4.3. Collaborations & Alliances
8.1.4.4. Recent Developments
8.1.4.5. Financial Details
8.1.4.6. Others
8.1.5.Optimum Nutrition Sweden AB
8.1.5.1. Business Description
8.1.5.2. Product Portfolio
8.1.5.3. Collaborations & Alliances
8.1.5.4. Recent Developments
8.1.5.5. Financial Details
8.1.5.6. Others
8.1.6.Orkla Care A/S
8.1.6.1. Business Description
8.1.6.2. Product Portfolio
8.1.6.3. Collaborations & Alliances
8.1.6.4. Recent Developments
8.1.6.5. Financial Details
8.1.6.6. Others
8.1.7.Vitamin Well Danmark ApS
8.1.7.1. Business Description
8.1.7.2. Product Portfolio
8.1.7.3. Collaborations & Alliances
8.1.7.4. Recent Developments
8.1.7.5. Financial Details
8.1.7.6. Others
8.1.8.PurePower Aps
8.1.8.1. Business Description
8.1.8.2. Product Portfolio
8.1.8.3. Collaborations & Alliances
8.1.8.4. Recent Developments
8.1.8.5. Financial Details
8.1.8.6. Others
8.1.9.Natur Drogeriet A/S
8.1.9.1. Business Description
8.1.9.2. Product Portfolio
8.1.9.3. Collaborations & Alliances
8.1.9.4. Recent Developments
8.1.9.5. Financial Details
8.1.9.6. Others
8.1.10. Easis A/S
8.1.10.1. Business Description
8.1.10.2. Product Portfolio
8.1.10.3. Collaborations & Alliances
8.1.10.4. Recent Developments
8.1.10.5. Financial Details
8.1.10.6. Others
9. Disclaimer
| Segment | Sub-Segment |
|---|---|
| By Product Type |
|
| By Sales Channel |
|
| By Ingredients |
|
| By Functionality |
|
| By End User |
|
Research Methodology
This study followed a structured approach comprising four key phases to assess the size and scope of the electro-oxidation market. The process began with thorough secondary research to collect data on the target market, related markets, and broader industry context. These findings, along with preliminary assumptions and estimates, were then validated through extensive primary research involving industry experts from across the value chain. To calculate the overall market size, both top-down and bottom-up methodologies were employed. Finally, market segmentation and data triangulation techniques were applied to refine and validate segment-level estimations.
Secondary Research
The secondary research phase involved gathering data from a wide range of credible and published sources. This step helped in identifying industry trends, defining market segmentation, and understanding the market landscape and value chain.
Sources consulted during this phase included:
- Company annual reports, investor presentations, and press releases
- Industry white papers and certified publications
- Trade directories and market-recognized databases
- Articles from authoritative authors and reputable journals
- Gold and silver standard websites
Secondary research was critical in mapping out the industry's value chain and monetary flow, identifying key market segments, understanding regional variations, and tracking significant industry developments.
Other key sources:
- Financial disclosures
- Industry associations and trade bodies
- News outlets and business magazines
- Academic journals and research studies
- Paid industry databases
Primary Research
To validate secondary data and gain deeper market insights, primary research was conducted with key stakeholders across both the supply and demand sides of the market.
On the demand side, participants included decision-makers and influencers from end-user industries—such as CIOs, CTOs, and CSOs—who provided first-hand perspectives on market needs, product usage, and future expectations.
On the supply side, interviews were conducted with manufacturers, industry associations, and institutional participants to gather insights into current offerings, product pipelines, and market challenges.
Primary interviews provided critical inputs such as:
- Market size and revenue data
- Product and service breakdowns
- Market forecasts
- Regional and application-specific trends
Stakeholders consulted included:
- Leading OEM and solution providers
- Channel and distribution partners
- End users across various applications
- Independent consultants and industry specialists
Market Size Estimation and Data Triangulation
- Identifying Key Market Participants (Secondary Research)
- Goal: To identify the major players or companies in the target market. This typically involves using publicly available data sources such as industry reports, market research publications, and financial statements of companies.
- Tools: Reports from firms like Gartner, Forrester, Euromonitor, Statista, IBISWorld, and others. Public financial statements, news articles, and press releases from top market players.
- Extracting Earnings of Key Market Participants
- Goal: To estimate the earnings generated from the product or service being analyzed. This step helps in understanding the revenue potential of each market player in a specific geography.
- Methods: Earnings data can be gathered from:
- Publicly available financial reports (for listed companies).
- Interviews and primary data sources from professionals, such as Directors, VPs, SVPs, etc. This is especially useful for understanding more nuanced, internal data that isn't publicly disclosed.
- Annual reports and investor presentations of key players.
- Data Collation and Development of a Relevant Data Model
- Goal: To collate inputs from both primary and secondary sources into a structured, data-driven model for market estimation. This model will incorporate key market KPIs and any independent variables relevant to the market.
- Key KPIs: These could include:
- Market size, growth rate, and demand drivers.
- Industry-specific metrics like market share, average revenue per customer (ARPC), or average deal size.
- External variables, such as economic growth rates, inflation rates, or commodity prices, that could affect the market.
- Data Modeling: Based on this data, the market forecasts are developed for the next 5 years. A combination of trend analysis, scenario modeling, and statistical regression might be used to generate projections.
- Scenario Analysis
- Goal: To test different assumptions and validate how sensitive the market is to changes in key variables (e.g., market demand, regulatory changes, technological disruptions).
- Types of Scenarios:
- Base Case: Based on current assumptions and historical data.
- Best-Case Scenario: Assuming favorable market conditions, regulatory environments, and technological advancements.
- Worst-Case Scenario: Accounting for adverse factors, such as economic downturns, stricter regulations, or unexpected disruptions.


