Denmark Alcoholic Drinks Market Report: Trends, Growth and Forecast (2026-2032)
By Type (Beer, Cider/Perry, RTDs, Spirits, Wine), By Alcohol Content (High, Medium, Low), By Flavor (Unflavored, Flavored), By Packaging Type (Glass Bottles, Tins, Plastic Bottles, Others), By Sales Channel (On-Trade, Off-Trade (Retail Offline, Retail Online)) ... Read more

|
Major Players
|
Denmark Alcoholic Drinks Market Statistics and Insights, 2026
- Market Size Statistics
- Alcoholic Drinks in Denmark is estimated at $ 8.73 Billion.
- The market size is expected to grow to $ 9.29 Billion by 2032.
- Market to register a CAGR of around 0.89% during 2026-32.
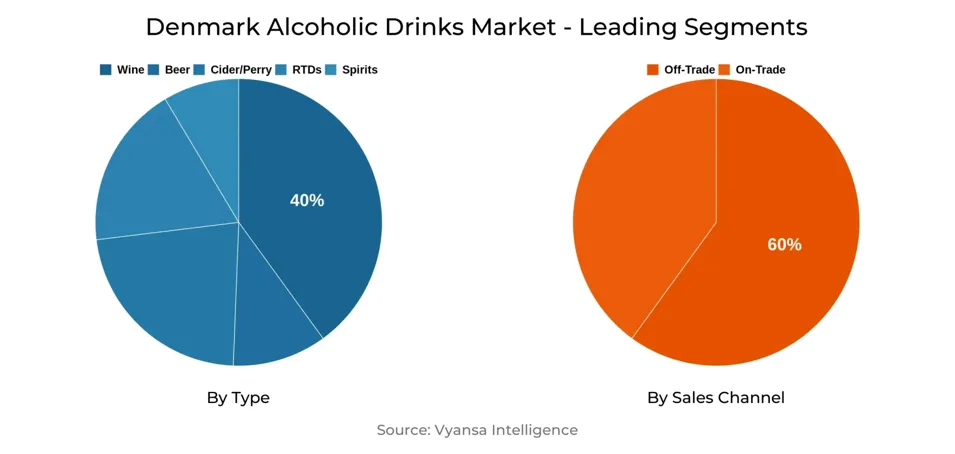
- Type Shares
- Wine grabbed market share of 40%.
- Competition
- More than 10 companies are actively engaged in producing Alcoholic Drinks in Denmark.
- Top 5 companies acquired 60% of the market share.
- Harboes Bryggeri A/S, Accolade Wines Ltd, Amka Danmark A/S, Carlsberg A/S, Royal Unibrew A/S etc., are few of the top companies.
- Sales Channel
- Off-Trade grabbed 60% of the market.
Denmark Alcoholic Drinks Market Outlook
The Denmark Alcoholic Drinks Market is valued at USD 8.73 billion and is anticipated to reach USD 9.29 billion by 2032. Volume sales are expected to fall further as young adults and health-driven end users cut back on alcohol or switch to lower-strength and non-alcoholic variants. Regardless of declining volumes, the total value sales are projected to stabilize as demand increases for premium, speciality, and innovative products. Beer will continue to be the largest category, though development is restricted, as premium dark beers and craft options are now appealing to end users that are prepared to pay more per serving.
Ready-to-Drink (RTD) beverages will continue to be the most dynamic category by volume. Spirit. RTDs and non-alcoholic RTDs will grow on as the end users demands convenient, moderate-alcohol drinks at home. The health and wellness trend will propel growth in non-alcoholic beverages in every category, such as beer, wine, and spirits. Innovative products, like upscale non-alcoholic red wine by ISH ApS, will satisfy end users demands for quality and taste, further supporting the trend towards responsible drinking.
The off-trade channel will continue to lead, with approximately 60% of total sales. Multipack promotions, competitive prices, and wide availability will underpin modern grocery retailers, discounters, and hypermarkets as preferred outlets. Convenience, price discounts, home delivery, and the internet will drive e-commerce growth during the forecast period but see its absolute market share remain small compared with classical retailing.
On-trade sales are likely to bounce back over time but could potentially stay below pre-pandemic levels because of risk-averse end users spending and less alcoholic drinking in bars and restaurants. End users will look more and more towards premium and sustainable products to draw them in, while value-conscious shoppers will stick with cut-price or multi-pack alternatives. Premiumisation, health-trend offerings, and innovation in soft drinks will drive the market trend by 2032.

Denmark Alcoholic Drinks Market Growth Driver
Health and Wellness Trend
A growing focus on health and well-being among Danish consumers is shaping the dynamics of the alcoholic beverages market. Young-adults end users, in particular, are opting for lower alcohol beverages or abstaining from drinking altogether as part of their efforts to be healthier. This trend spurs demand for non-alcoholic drinks, low-calorie drinks, and premium drinks, which are perceived as higher quality.
These end users are also willing to invest more in beverages that complement their health objectives, like specialty beers, premium wines, and spirit-flavored Ready-to-Drink products. Increased interest in distinctive flavors and superior ingredients also adds momentum to the trend. Overall, the health-oriented consumption trend is beneficial for the premium and non-alcoholic categories, presenting companies with a robust growth engine in the market.
Denmark Alcoholic Drinks Market Trend
Premiumisation of Alcoholic Drinks
A notable trend shaping Denmark’s Alcoholic Drinks Market is the growing premiumisation of products. While consumption is reducing overall, end users show a preference for higher-end and specialty beverages. Premium-positioned dark beers, wines of distinctive origins, and creative craft beverages are becoming more popular.
This indicates the willingness of end users to pay more per drink for improved taste, distinctive flavor, and an appealing story behind it. Premium and special segments are availed of the shift, with microbrewery substitutes and innovation-positioned products being successful. Brands emphasizing quality, uniqueness, and innovation continue to secure the interest of end users and propel value expansion in the market.
Unlock Market Intelligence
Explore the market potential with our data-driven report
Denmark Alcoholic Drinks Market Opportunity
Non-Alcoholic Product Expansion
Increasing demand for non-alcoholic beverages is a real opportunity for the market. Non-alcoholic wine, beer, and spirits are becoming popular due to end users increasing interest in health and responsible drinking. Businesses can release new products in these categories to satisfy changing tastes.
Throughout the forecast period, the opportunity exists to launch premium non-alcoholic products within different categories, such as ales, RTDs, and red wines. High quality and taste are what the end users expects, allowing the differentiation of brands. Non-alcoholic extension also serves to meet health-conscious demand but drives product innovation, leading to growth in a category with solid long-term potential.
Unlock Market Intelligence
Explore the market potential with our data-driven report
Denmark Alcoholic Drinks Market Segmentation Analysis
By Type
- Beer
- Cider/Perry
- RTDs
- Spirits
- Wine
The segment with the highest market share under the Type is Wine, capturing 40% of the market. Wine continues to hold a strong position in Denmark due to end users interest in premium and speciality options, as well as the growing focus on quality and origin stories. Despite the overall decline in alcohol consumption, Danes are willing to spend more per drink, which supports value growth in wine.
Premium and sparkling wines are also doing well, especially among health-oriented end users who tend to opt for lighter or lower-alcohol wine. Non-wine is also becoming popular, echoing the growing trend of conscious drinking and health-oriented consumption. Amka Danmark A/S and ISH ApS are leading growth through innovation and premiumisation, making wine a top-performing category in the Danish market for alcoholic beverages.
By Sales Channel
- On-Trade
- Off-Trade
The segment with highest market share under sales channel is Off-Trade, with 60% market share. Off-Trade remains dominant because of the pervasive availability of hypermarkets, supermarkets, and discounters with convenience, competitive prices, and multi-packing promotion that makes them attractive to end users seeking to economise.
Contemporary grocery stores continue to be the channels of choice for wine, beer, and spirits, with discounters and hypermarkets drawing end users through enticing promotions and bundle offers. E-commerce is slowly increasing, aided by web-based services like Salling Group, Dagfora, and Nemlig, but Off-Trade is still the largest channel. Its convenience, assortment, and value for money position it as the channel of choice for Danish end users buying alcoholic beverages.
Top Companies in Denmark Alcoholic Drinks Market
The top companies operating in the market include Harboes Bryggeri A/S, Accolade Wines Ltd, Amka Danmark A/S, Carlsberg A/S, Royal Unibrew A/S, Anora Group Oyj, Taster Wine A/S, Heineken NV, Diageo Plc, Viña Santa Rita SA, etc., are the top players operating in the Denmark Alcoholic Drinks Market.
Frequently Asked Questions
Related Report
1. Market Segmentation
1.1. Research Scope
1.2. Research Methodology
1.3. Definitions and Assumptions
2. Executive Summary
3. Denmark Alcoholic Drinks Market Policies, Regulations, and Standards
4. Denmark Alcoholic Drinks Market Dynamics
4.1. Growth Factors
4.2. Challenges
4.3. Trends
4.4. Opportunities
5. Denmark Alcoholic Drinks Market Statistics, 2022-2032F
5.1. Market Size & Growth Outlook
5.1.1. By Revenues in US$ Million
5.1.2. By Quantity Sold in Million Litres
5.2. Market Segmentation & Growth Outlook
5.2.1. By Type
5.2.1.1. Beer- Market Insights and Forecast 2022-2032, USD Million
5.2.1.2. Cider/Perry- Market Insights and Forecast 2022-2032, USD Million
5.2.1.3. RTDs- Market Insights and Forecast 2022-2032, USD Million
5.2.1.4. Spirits- Market Insights and Forecast 2022-2032, USD Million
5.2.1.5. Wine- Market Insights and Forecast 2022-2032, USD Million
5.2.2. By Alcohol Content
5.2.2.1. High- Market Insights and Forecast 2022-2032, USD Million
5.2.2.2. Medium- Market Insights and Forecast 2022-2032, USD Million
5.2.2.3. Low- Market Insights and Forecast 2022-2032, USD Million
5.2.3. By Flavor
5.2.3.1. Unflavored- Market Insights and Forecast 2022-2032, USD Million
5.2.3.2. Flavored- Market Insights and Forecast 2022-2032, USD Million
5.2.4. By Packaging Type
5.2.4.1. Glass Bottles- Market Insights and Forecast 2022-2032, USD Million
5.2.4.2. Tins- Market Insights and Forecast 2022-2032, USD Million
5.2.4.3. Plastic Bottles- Market Insights and Forecast 2022-2032, USD Million
5.2.4.4. Others- Market Insights and Forecast 2022-2032, USD Million
5.2.5. By Sales Channel
5.2.5.1. On-Trade- Market Insights and Forecast 2022-2032, USD Million
5.2.5.2. Off-Trade- Market Insights and Forecast 2022-2032, USD Million
5.2.5.2.1. Retail Offline- Market Insights and Forecast 2022-2032, USD Million
5.2.5.2.2. Retail Online- Market Insights and Forecast 2022-2032, USD Million
5.2.6. By Competitors
5.2.6.1. Competition Characteristics
5.2.6.2. Market Share & Analysis
6. Denmark Beer Market Statistics, 2022-2032F
6.1. Market Size & Growth Outlook
6.1.1. By Revenues in US$ Million
6.1.2. By Quantity Sold in Million Litres
6.2. Market Segmentation & Growth Outlook
6.2.1. By Alcohol Content- Market Insights and Forecast 2022-2032, USD Million
6.2.2. By Flavor- Market Insights and Forecast 2022-2032, USD Million
6.2.3. By Packaging Type- Market Insights and Forecast 2022-2032, USD Million
6.2.4. By Sales Channel- Market Insights and Forecast 2022-2032, USD Million
7. Denmark Cider/Perry Market Statistics, 2022-2032F
7.1. Market Size & Growth Outlook
7.1.1. By Revenues in US$ Million
7.1.2. By Quantity Sold in Million Litres
7.2. Market Segmentation & Growth Outlook
7.2.1. By Alcohol Content- Market Insights and Forecast 2022-2032, USD Million
7.2.2. By Flavor- Market Insights and Forecast 2022-2032, USD Million
7.2.3. By Packaging Type- Market Insights and Forecast 2022-2032, USD Million
7.2.4. By Sales Channel- Market Insights and Forecast 2022-2032, USD Million
8. Denmark Ready-to-Drink Market Statistics, 2022-2032F
8.1. Market Size & Growth Outlook
8.1.1. By Revenues in US$ Million
8.1.2. By Quantity Sold in Million Litres
8.2. Market Segmentation & Growth Outlook
8.2.1. By Alcohol Content- Market Insights and Forecast 2022-2032, USD Million
8.2.2. By Flavor- Market Insights and Forecast 2022-2032, USD Million
8.2.3. By Packaging Type- Market Insights and Forecast 2022-2032, USD Million
8.2.4. By Sales Channel- Market Insights and Forecast 2022-2032, USD Million
9. Denmark Spirits Market Statistics, 2022-2032F
9.1. Market Size & Growth Outlook
9.1.1. By Revenues in US$ Million
9.1.2. By Quantity Sold in Million Litres
9.2. Market Segmentation & Growth Outlook
9.2.1. By Alcohol Content- Market Insights and Forecast 2022-2032, USD Million
9.2.2. By Flavor- Market Insights and Forecast 2022-2032, USD Million
9.2.3. By Packaging Type- Market Insights and Forecast 2022-2032, USD Million
9.2.4. By Sales Channel- Market Insights and Forecast 2022-2032, USD Million
10. Denmark Wine Market Statistics, 2022-2032F
10.1.Market Size & Growth Outlook
10.1.1. By Revenues in US$ Million
10.1.2. By Quantity Sold in Million Litres
10.2.Market Segmentation & Growth Outlook
10.2.1. By Alcohol Content- Market Insights and Forecast 2022-2032, USD Million
10.2.2. By Flavor- Market Insights and Forecast 2022-2032, USD Million
10.2.3. By Packaging Type- Market Insights and Forecast 2022-2032, USD Million
10.2.4. By Sales Channel- Market Insights and Forecast 2022-2032, USD Million
11. Competitive Outlook
11.1.Company Profiles
11.1.1. Carlsberg A/S
11.1.1.1. Business Description
11.1.1.2. Product Portfolio
11.1.1.3. Collaborations & Alliances
11.1.1.4. Recent Developments
11.1.1.5. Financial Details
11.1.1.6. Others
11.1.2. Royal Unibrew A/S
11.1.2.1. Business Description
11.1.2.2. Product Portfolio
11.1.2.3. Collaborations & Alliances
11.1.2.4. Recent Developments
11.1.2.5. Financial Details
11.1.2.6. Others
11.1.3. Anora Group Oyj
11.1.3.1. Business Description
11.1.3.2. Product Portfolio
11.1.3.3. Collaborations & Alliances
11.1.3.4. Recent Developments
11.1.3.5. Financial Details
11.1.3.6. Others
11.1.4. Taster Wine A/S
11.1.4.1. Business Description
11.1.4.2. Product Portfolio
11.1.4.3. Collaborations & Alliances
11.1.4.4. Recent Developments
11.1.4.5. Financial Details
11.1.4.6. Others
11.1.5. Heineken NV
11.1.5.1. Business Description
11.1.5.2. Product Portfolio
11.1.5.3. Collaborations & Alliances
11.1.5.4. Recent Developments
11.1.5.5. Financial Details
11.1.5.6. Others
11.1.6. Harboes Bryggeri A/S
11.1.6.1. Business Description
11.1.6.2. Product Portfolio
11.1.6.3. Collaborations & Alliances
11.1.6.4. Recent Developments
11.1.6.5. Financial Details
11.1.6.6. Others
11.1.7. Accolade Wines Ltd
11.1.7.1. Business Description
11.1.7.2. Product Portfolio
11.1.7.3. Collaborations & Alliances
11.1.7.4. Recent Developments
11.1.7.5. Financial Details
11.1.7.6. Others
11.1.8. Amka Danmark A/S
11.1.8.1. Business Description
11.1.8.2. Product Portfolio
11.1.8.3. Collaborations & Alliances
11.1.8.4. Recent Developments
11.1.8.5. Financial Details
11.1.8.6. Others
11.1.9. Diageo Plc
11.1.9.1. Business Description
11.1.9.2. Product Portfolio
11.1.9.3. Collaborations & Alliances
11.1.9.4. Recent Developments
11.1.9.5. Financial Details
11.1.9.6. Others
11.1.10. Viña Santa Rita SA
11.1.10.1. Business Description
11.1.10.2. Product Portfolio
11.1.10.3. Collaborations & Alliances
11.1.10.4. Recent Developments
11.1.10.5. Financial Details
11.1.10.6. Others
12. Disclaimer
| Segment | Sub-Segment |
|---|---|
| By Type |
|
| By Alcohol Content |
|
| By Flavor |
|
| By Packaging Type |
|
| By Sales Channel |
|
Research Methodology
This study followed a structured approach comprising four key phases to assess the size and scope of the electro-oxidation market. The process began with thorough secondary research to collect data on the target market, related markets, and broader industry context. These findings, along with preliminary assumptions and estimates, were then validated through extensive primary research involving industry experts from across the value chain. To calculate the overall market size, both top-down and bottom-up methodologies were employed. Finally, market segmentation and data triangulation techniques were applied to refine and validate segment-level estimations.
Secondary Research
The secondary research phase involved gathering data from a wide range of credible and published sources. This step helped in identifying industry trends, defining market segmentation, and understanding the market landscape and value chain.
Sources consulted during this phase included:
- Company annual reports, investor presentations, and press releases
- Industry white papers and certified publications
- Trade directories and market-recognized databases
- Articles from authoritative authors and reputable journals
- Gold and silver standard websites
Secondary research was critical in mapping out the industry's value chain and monetary flow, identifying key market segments, understanding regional variations, and tracking significant industry developments.
Other key sources:
- Financial disclosures
- Industry associations and trade bodies
- News outlets and business magazines
- Academic journals and research studies
- Paid industry databases
Primary Research
To validate secondary data and gain deeper market insights, primary research was conducted with key stakeholders across both the supply and demand sides of the market.
On the demand side, participants included decision-makers and influencers from end-user industries—such as CIOs, CTOs, and CSOs—who provided first-hand perspectives on market needs, product usage, and future expectations.
On the supply side, interviews were conducted with manufacturers, industry associations, and institutional participants to gather insights into current offerings, product pipelines, and market challenges.
Primary interviews provided critical inputs such as:
- Market size and revenue data
- Product and service breakdowns
- Market forecasts
- Regional and application-specific trends
Stakeholders consulted included:
- Leading OEM and solution providers
- Channel and distribution partners
- End users across various applications
- Independent consultants and industry specialists
Market Size Estimation and Data Triangulation
- Identifying Key Market Participants (Secondary Research)
- Goal: To identify the major players or companies in the target market. This typically involves using publicly available data sources such as industry reports, market research publications, and financial statements of companies.
- Tools: Reports from firms like Gartner, Forrester, Euromonitor, Statista, IBISWorld, and others. Public financial statements, news articles, and press releases from top market players.
- Extracting Earnings of Key Market Participants
- Goal: To estimate the earnings generated from the product or service being analyzed. This step helps in understanding the revenue potential of each market player in a specific geography.
- Methods: Earnings data can be gathered from:
- Publicly available financial reports (for listed companies).
- Interviews and primary data sources from professionals, such as Directors, VPs, SVPs, etc. This is especially useful for understanding more nuanced, internal data that isn't publicly disclosed.
- Annual reports and investor presentations of key players.
- Data Collation and Development of a Relevant Data Model
- Goal: To collate inputs from both primary and secondary sources into a structured, data-driven model for market estimation. This model will incorporate key market KPIs and any independent variables relevant to the market.
- Key KPIs: These could include:
- Market size, growth rate, and demand drivers.
- Industry-specific metrics like market share, average revenue per customer (ARPC), or average deal size.
- External variables, such as economic growth rates, inflation rates, or commodity prices, that could affect the market.
- Data Modeling: Based on this data, the market forecasts are developed for the next 5 years. A combination of trend analysis, scenario modeling, and statistical regression might be used to generate projections.
- Scenario Analysis
- Goal: To test different assumptions and validate how sensitive the market is to changes in key variables (e.g., market demand, regulatory changes, technological disruptions).
- Types of Scenarios:
- Base Case: Based on current assumptions and historical data.
- Best-Case Scenario: Assuming favorable market conditions, regulatory environments, and technological advancements.
- Worst-Case Scenario: Accounting for adverse factors, such as economic downturns, stricter regulations, or unexpected disruptions.


